

Abstract
Rhodopsin is the best-understood member of the large G protein–coupled receptor (GPCR) superfamily. The G-protein amplification cascade is triggered by poorly understood light-induced conformational changes in rhodopsin that are homologous to changes caused by agonists in other GPCRs. We have applied the "antibody imprint" method to light-activated rhodopsin in native membranes by using nine monoclonal antibodies (mAbs) against aqueous faces of rhodopsin. Epitopes recognized by these mAbs were found by selection from random peptide libraries displayed on phage. A new computer algorithm, FINDMAP, was used to map the epitopes to discontinuous segments of rhodopsin that are distant in the primary sequence but are in close spatial proximity in the structure. The proximity of a segment of the N-terminal and the loop between helices VI and VIII found by FINDMAP is consistent with the X-ray structure of the dark-adapted rhodopsin. Epitopes to the cytoplasmic face segregated into two classes with different predicted spatial proximities of protein segments that correlate with different preferences of the antibodies for stabilizing the metarhodopsin I or metarhodopsin II conformations of light-excited rhodopsin. Epitopes of antibodies that stabilize metarhodopsin II indicate conformational changes from dark-adapted rhodopsin, including rearrangements of the C-terminal tail and altered exposure of the cytoplasmic end of helix VI, a portion of the C-3 loop, and helix VIII. As additional antibodies are subjected to antibody imprinting, this approach should provide increasingly detailed information on the conformation of light-excited rhodopsin and be applicable to structural studies of other challenging protein targets.
Keywords: Antibody epitopes, epitope mapping, G protein–coupled receptors, guanosine diphosphate, guanosine triphosphate, phage display, protein structure, rhodopsin
Knowledge of the three-dimensional (3D) structures of proteins has enabled tremendous progress in understanding biological mechanisms. The determination of 3D structures of biological macromolecules has depended primarily on X-ray crystallography and nuclear magnetic resonance (NMR). Many proteins cannot be studied by these methods for a number of reasons, such as difficulty with crystallization, limitations in the amounts of protein obtainable, or too high a molecular weight and/or insufficient solubility for NMR. Determination of the 3D structure of intact membrane proteins and their different functional states has been especially elusive. The "antibody imprint" approach (Burritt et al. 1998; Jesaitis et al. 1999) can provide structural insights in difficult cases in which traditional structure determination methods cannot be applied, by revealing the folding of discontinuous epitopes on protein surfaces. Segments of discontinuous epitopes may be far apart in the primary sequence but folded in close proximity in the 3D structure of proteins, thereby assembling antibody-binding sites that have also been called conformational epitopes. Most antibodies have discontinuous epitopes, which contain information on the structure of target proteins that is somewhat analogous to distance constraints obtained from NOESY NMR. In the present work, antibody epitopes were deduced by affinity selection of peptides from random peptide libraries displayed on bacteriophage (Cwirla et al. 1990; Scott and Smith 1990), and we developed a new FINDMAP algorithm (Mumey et al. 2002, 2003) to map discontinuous antibody epitopes to the target protein sequence.
A library of random peptide sequences, usually from 6 to 10 residues in length, can be expressed as fusions with integral proteins of bacteriophage by using "phage display" technology to present unique peptide sequences on each phage particle (Barbas 2001). A number of recent reviews give overviews of phage display methodology and applications (Burritt et al. 1996; Koscielska et al. 1998; Cabilly 1999). Phage-displayed libraries contain a large amount of sequence diversity (Smith and Scott 1993), typically with a diversity of 109–1010 unique clones per library (Yip and Ward 1999). This diversity is sufficient for up to all possible combinations of seven-amino-acid sequences to be represented (Yip and Ward 1999), and some recent work has provided even greater diversity in peptide libraries (Sidhu 2000). When a phage-displayed peptide library is exposed to a protein target, peptide sequences that have the highest affinity for the protein target are bound and selected by appropriate washing and eluting procedures. Because the antibody-binding pockets of monoclonal antibodies (mAbs) are complementary to the epitopes on target protein surfaces, peptides that bind to antibodies contain information on the original protein structure. There are a number of reports in which mAbs have been subjected to phage display and have been used to find linear peptide epitopes on target protein surfaces (for review, see Yip and Ward 1999).
A structural analysis of nine fragment antibody-binding domains (Fabs) complexed with their protein antigens by using X-ray diffraction shows that all the mAbs investigated formed complexes with discontinuous epitopes (Padlan 1996), indicating that mAbs may typically recognize complex discontinuous epitopes on the surfaces of proteins. Antibodies that recognize discontinuous epitopes provide a potentially vast reservoir of structural information that has not been widely used. Relatively few reports have appeared describing mappings of discontinuous epitopes to the surfaces of protein targets, presumably because it is often difficult to interpret the protein residues that comprise discontinuous epitopes (Burritt et al. 1998). In some cases, in which phage display has been used to find and map a discontinuous epitope to a protein surface, the procedure has relied upon preexisting knowledge of the 3D structure of the protein surface, for example ferritin (Luzzago et al. 1993), transcription factor p53 (Ravera et al. 1998), and actin (Jesaitis et al. 1999). There are reports of discontinuous epitopes that were found by phage display and then mapped to a protein with unknown structure, including studies of an MDR1 class-I P-glycoprotein (Poloni et al. 1995), α2-macroglobin (Birkenmeier et al. 1997), p185HER2 oncoprotein (Orlandi et al. 1997), envelope glycoproteins G1 and G2 of Puumala hantavirus (Heiskanen et al. 1999), crotoxin (Demangel et al. 2000), and prior work from our laboratories in which peptides have been identified that mimic discontinuous epitopes on the surface of the flavocytochrome b558 protein (Burritt et al. 1998, 2001). For example, a discontinuous epitope identified on flavocytochrome b558 consists of two regions separated by 150 residues in the protein sequence and two putative transmembrane spans (Burritt et al. 1998). NMR measurements on the folded conformation of this peptide epitope, when it is bound to its antiflavocytochrome b558 mAb, support the conclusion that the discontinuous epitope is folded into a spatially compact form (Burritt et al. 1998). Thus, antibody imprinting can provide a detailed picture of the conformation of segments of the target protein surface by using NMR or X-ray diffraction analyses of the conformation of peptide epitopes when they are bound to the mAb that selected the peptide (Burritt et al. 1998).
Relatively few long-distance constraints may be necessary to define the folding topology of a protein surface (Clore et al. 1993; Dandekar and Argos 1997). A single mAb against a discontinuous epitope can be expected to provide constraints on only a portion of the 3D surface of a protein with unknown structure. Thus, to create an image of the protein surface, we expect that it will usually be necessary to use a panel of mAbs with members that collectively imprint several discontinuous epitopes on the protein. Epitope mapping, using phage display with polyclonal antibodies, has been reported, including the recent mapping of polyclonal antibodies against a peptide from fibroblast growth factor receptor 1 (FGFR 1; Moshitch-Moshkovitz et al. 2000), bovine β-lactoglobulin (Williams et al. 1998), and actin (Jesaitis et al. 1999). Reports of the use of a panel of mAbs for phage display mapping, with each member recognizing different epitopes on a target protein, include studies of the small hepatitis B virus surface antigen (HBsAg; Chen et al. 1996), dystrophin and utrophin (Morris et al. 1998), and a panel of 23 IgG mAbs (11 linear, 11 discontinuous, 1 uncertain) against human neutrophil flavocytochrome b558 that have been reported in a series of articles from one of our laboratories (Burritt et al. 1995, 1998, 2000, 2001).
Here we report the use of a new computational approach (Mumey et al. 2002, 2003) and the application of the antibody imprinting method to the study of the conformational changes of an integral membrane protein in different functional states. We used a panel of eight antirhodopsin mAbs directed against the cytoplasmic face of rhodopsin (MacKenzie and Molday 1982; Adamus et al. 1991; Abdulaev and Ridge 1998) and one against the intradiskal face (Adamus et al. 1991). Rhodopsin (Fig. 1 ▶) is an integral membrane protein that spans the membrane seven times and is responsible for light reception in low-light vision. Rhodopsin is the best understood member of the large G protein–coupled receptor (GPCR) superfamily (Horn et al. 1998; Wess 1999). After numerous attempts over many years, a 2.8-Å X-ray structure of dark-adapted rhodopsin was finally achieved in 2000 (Palczewski et al. 2000), and in a somewhat more refined form in 2001 (Teller et al. 2001), that provides a structural template for other members of the GPCR superfamily in the resting state, in the absence of agonists (Okada and Palczewski 2001). After photon excitation, rhodopsin undergoes a series of conformational changes, leading to a relatively stable equilibrium between metarhodopsin I (MI) and metarhodopsin II (MII) states (for review, see Hofmann 2000). MII is the active conformation, and the MII–G protein complex catalyzes the release of GDP and the exchange of GTP on the G protein to trigger visual excitation. The cytoplasmic face of rhodopsin is of particular interest because light-induced conformational changes on this face elicit coupling to the G-protein transducin, rhodopsin kinase, and arrestin, which control the turn on and turn off of the amplification cascade of visual excitation (Hofmann 2000). X-ray structures of rhodopsin photo-intermediate species are not available, although some inferences about structural changes associated with light activation have been made from diverse experiments, including site-directed mutagenesis (Sakmar 1998), site-specific spin-labeling (for review, see Hubbell et al. 2000), FTIR spectroscopy (Vogel and Siebert 2001), and cross-linking analysis (Cai et al. 2001; Itoh et al. 2001). The conformations of the light-triggered states of rhodopsin are thought to be similar to agonist-stimulated GPCRs (for review, see Gether and Kobilka 1998; Okada et al. 2001), and presumably, the detailed structures of rhodopsin photo-intermediates would be of great help in understanding the structure/function relationships of other GPCRs.
Figure 1.

Diagram of the transmembrane topology of rhodopsin incorporating current understanding of residues in helices or loops and loop/helix positions relative to the lipid–water interface (Palczewski et al. 2000; Teller et al. 2001). The amino acids are differently shaded on different regions of rhodopsin, and these same shadings are used in Figures 4–6 ▶ ▶ ▶ for illustrating the mAb epitopes mapped on the rhodopsin surface. Shading designations are as follows: N terminus and C terminus, salmon pink; C-1 and I-1 loops, dark grey; C-2 and I-2 loops, medium grey; C-3 and I-3 loops, light grey; and C-4 loop/helix VIII, very light grey.
We found that most of the consensus peptide epitopes derived from phage display analysis of the antirhodopsin mAbs could not be mapped as continuous determinants on the rhodopsin sequence and instead reveal discontinuous epitopes on the protein surface. Therefore, we developed a computer program called FINDMAP (Mumey et al. 2002) to systematically examine and evaluate the large number of possible ways to map antibody epitope sequences to discontinuous segments of the target protein sequence. The different possible epitope maps are scored by the FINDMAP program to find the most favored mappings. The best-fit mappings of the discontinuous epitopes generate a network of distance constraints for the folding of the solvent-exposed faces of rhodopsin. The distance constraints were grouped into three sets, one of which was associated with the intradiskal face of rhodopsin and two different groups that were directed against the cytoplasmic face of rhodopsin. The two groups of epitopes directed against the cytoplasmic surface showed distinctly different patterns of structural constraints. Placement of the mAbs in the two groups of spatial constraints was found to correlate with ability of the mAbs to stabilize the MI or the MII conformations of light-excited rhodopsin. Thus, the two different patterns of distance constraints appear to provide information on the conformational changes of the MI and MII functional states, which have been difficult to obtain in other ways. The number of antirhodopsin mAbs currently available is not yet sufficient to provide explicit molecular models of the surface structures of the two different metarhodopsin photo-intermediates. The work described in this article develops a foundation needed to provide increasingly detailed constraints on the structures of the rhodopsin photo-intermediates as more antirhodopsin mAbs become available and their epitopes are mapped.
Results and Discussion
We carried out antibody imprinting on a panel of eight murine antirhodopsin IgG mAbs against the cytoplasmic surface of rhodopsin—K16-107C, K16-111C, K16-155C, K16-50C, K42-41L, K60-46L (Adamus et al. 1991), 4B4 (MacKenzie and Molday 1982), and TM7C (Abdulaev and Ridge 1998)—and one mAb against the intradiskal surface, B1gN (Adamus et al. 1991). The mAbs were expressed in hybridoma cell lines and were affinity-purified on immobilized protein G. The activity of each mAb was monitored by enzyme-linked immunosorbent assay (ELISA), using rhodopsin immobilized to wells of microtiter plates (data not shown), to confirm that the purified antibody preparations retained their ability to bind dark-adapted and/or light-exposed rhodopsin.
Purified mAbs were immobilized on CNBr-activated Sepharose 4B beads. Peptides that bound to the mAbs were selected by phage display from the J404 9-mer random peptide library (Burritt et al. 1996) on affinity columns. Low-binding phage were washed through the columns containing immobilized antibody. Adherent phage were eluted with low pH and were amplified by growth in Escherichia coli. Three rounds of selection, interspersed with amplification of adherent phage, were conducted separately for each mAb to isolate the more strongly binding peptide sequences. Phage that were retained by the antibodies were titered after each round of selection. Phage titers of solutions eluted from the mAb columns increased two to three orders of magnitude after each round of selection (data not shown) as adherent phage become more abundant, in agreement with earlier findings (Jesaitis et al. 1999). After the third round of selection, phage were diluted and grown as isolated plaques on lawns of E. coli. Twenty-five to 100 individual phage clones were picked for each antibody. In some cases, phage clones were assayed by ELISA or by a plaque lift technique (Burritt et al. 1998), similar to Western blotting, to determine the relative affinities of individual peptide clones for the mAbs.
Identifying consensus peptide epitope sequences
A total of 473 phage clones against nine antirhodopsin mAbs were grown and sequenced by using a complementary primer upstream of the random peptide insert (Burritt et al. 1998), and Big dye terminal labeling and automated capillary DNA sequencing. The peptide sequences selected by each mAb and derived from the phage clones were aligned manually or with the motif discovery program MEME (Bailey and Elkan 1994) to determine consensus epitopes for each mAb. Table 1 shows, for example, the alignment of 90 phage clones by the K42-41L antirhodopsin mAb (Adamus et al. 1991) that were selected from the J404 library. The phage clone sequences in Table 1 clustered around a consensus sequence, TGALQERSK, typical of the results for most other mAbs obtained in this study. The "identity score" at the bottom of the table shows the percentage of residues found at each aligned position in the 90 sequences that were identical to the consensus sequence. The "mapping score" at the bottom of the table shows the percentage of residues in the 90 sequences that were chemically similar to the consensus results, as explained in the caption to Table 1.
Table 1.
Peptide sequences selected by the K42-41L mAb from the J404 random peptide library

The "#" column indicates the number of phage clones with the same sequence that are independently isolated. Peptide sequences were ranked for antibody affinity by ELISA A405, which was measured in quadruplicate for each page clone, and STD indicates the standard deviation of the ELISA absorbance. Positions in the aligned phage clone sequences were assigned a color (greens, reds, blues, and pinks) such that different colors corresponds to different approximate "motifs" of the TGALQERSK consensus sequence, when mapped to the rhodopsin sequence. Four motifs—GAL, QE, R, and T/KS—were common to many mappings of this sequence to rhodopsin (as shown later). "Identity scores" for each position in the consensus were calculated relative to the consensus sequence TGALQERSK, reflected the tightness of the consensus, and the scores are shown under the consensus near the bottom of the table. Exact amino acid matches scored "1.00" and the sum total score for all phage clones at each position was divided by the total number of clones with a residue aligned to that position. "Homology scores" for each position in the consensus are at the bottom of the table and were calculated in a similar manner to identity scores, except that chemically similar residues scored as "0.50" per occurrence for closely related residues (letters in medium-colored boxes under the identity scores), or "0.25" for other similar residues (letters in light-colored boxes under identity scores). The definitions for chemically similar residues are listed in Table 3.
Ninety-seven percent of phage clones selected against K42-41L contain the dipeptide Gln-Glu, and thus, QE was used as the nexus of alignment of the K42-41L phage clones with the rhodopsin sequences and usually occurred in positions 5 and 6 of the peptide, as shown in Table 1. The dipeptide QE appears only once in the rhodopsin sequence, in the C-3 loop, and its frequent occurrence on the selected peptide indicates that it is a major determinant of the antibody epitope. The peptide sequences in Table 1 are ranked according to their ability to compete with rhodopsin for binding to the mAb K42-41L, as measured in competition ELISA assays. Thr is found in 62% of the peptides in position one of the consensus sequence and is more common in the higher-affinity phage clones. On the N-terminal side of the QE sequence, many peptides contain a G(A/P)L or, less frequently, G(A/P)I sequence in positions 2–4. Glycine is found in 78% of all mAb selected peptides in the second position of the consensus, including most of the highest-affinity phage. In phage with lower affinities, Ala or Pro is sometimes found in place of Gly. It is apparent that as affinity decreases, the middle residue (position 3 in the consensus) of the G(A/P)(L/I) sequence is less conserved. Proceeding down toward phage with lower affinity, clones with (L/I) in the fourth position of the consensus sequence become less frequent, giving way to the chemically related Met or Val residues or to even less closely related amino acids. On the C-terminal side of QE, in position seven of the aligned consensus sequence, Arg is found in a majority of the clones and is more commonly found in higher-affinity clones. Position eight has a higher than random occurrence of substitutionally acceptable S/A/T/G residues (Bordo and Argos 1991), especially at higher binding affinities. Position nine is less strongly conserved than is position eight, but often contains Lys or other residues that are frequently substituted for Lys on protein surfaces: A/R/Q/T/H (Bordo and Argos 1991). A closely related consensus, TGPLQEREQ, was also found for mAb K42-41L (not shown in Table 1) in which identities with the most frequently observed consensuses are underlined.
The two consensus sequences presumably fit the antibody-binding pocket in slightly different ways. Complementary determining regions of mAbs appear to have a core of residues that comprise ∼30% of the total contact surface with protein antigens, and these core residues are responsible for a majority of the high-affinity contacts between antibody and antigen (Conte et al. 1999). Positions eight and nine of the epitope in Figure 1 ▶ may be relatively weakly conserved because they mimic regions outside the core of the antibody-binding pocket and thus would be expected to contribute much less to the total affinity between the antibody CDR (complementary determining region on an antibody)–peptide binding interface. The K42-41L antibody was originally characterized as being directed against the C-3 loop of rhodopsin, by competition ELISA against peptides patterned after each of the different linear surface loops of rhodopsin (Adamus et al. 1991). The phage display mapping shown in Table 1 implies, however, that antibody K42-41L has a more complex "assembled" or discontinuous epitope on the cytoplasmic face of rhodopsin, composed only in part by the Gln–Glu sequence on the C-3 loop.
The two linear consensus peptides for the K42-41L epitope were synthesized, and the affinity of each peptide for the K42-41L mAb was determined by isothermal titration calorimetry (ITC). TGALQERSK and TGPLQEREQ were determined to have affinities for binding K42-41L that differ by a factor of five (Kd = 1.25 and 0.25 μM, respectively; data not shown). In ELISA assays, a dilution series of both consensus epitope peptides competed against light-bleached rhodopsin for K42-41L. The TGPLQEREQ peptide was more effective at competing against rhodopsin for antibody than was the peptide EAAAQQQESATTQ, which is comprised of residues 232–244 in the C-3 loop of rhodopsin (data not shown), indicating that TGPLQEREQ is a better mimic for the epitope mAb-binding pocket. The related consensus peptide, TGALQERSK, was slightly less capable of competing with light-exposed rhodopsin for K42-41L than was either TGPLQEREQ or EAAAQQQESATTQ, but was much more effective than a scrambled version of the TGPLQEREQ sequence, RESTLGQKA (∼1,000-fold lower apparent affinity by ELISA), indicating that the amino acid sequence order is critical for antibody binding of the peptide epitopes.
One or two related consensus sequences were obtained for seven of nine antirhodopsin mAbs mapped in this study, using the linear J404 phage-displayed random peptide library, as summarized in Table 2. Typically, members of the first consensus listed for each mAb were found with more frequency. K16-50C and K16-107C each yielded a single consensus sequence: TTVSKTEAP for K16-50C and GKALVND for K16-107C, as shown in Table 2. In cases in which a mAb selected two consensus sequences, the sequences share a common motif (underlined below) but are otherwise distinct. MAbs B1gN and TM7C each yielded two closely related consensus sequences: SFVDFSNKG and AYINYQNKG (B1gN) and YQ(A/T)PIGGWY and WIMPTGGWY (TM7C; Table 2). The K16-55C consensus peptides RSEAEMVAP and VSWGDMVPA share a SX1X2(E/D)MVAP motif, although they are in slightly different sequential order. MAbs K16-111C and K60-46L also mapped to two consensus sequences. The two K16-111C consensus peptides, GWAPNGKNG and WAPEVMGPL, share a Trp-Ala-Pro motif. Similar to K42-41L, K60-46L was originally classified as being against the C-3 loop of rhodopsin, by competition against linear peptides that mimic stretches of the rhodopsin sequence. However, the K60-46L mAb also appears to recognize the complex discontinuous epitope consensus peptide sequences of GRLP PRQQD and EKPWWRVKQ. The common Gln–(Glu/Asp) sequence found in the four consensus peptides of both K42-41L and K60-46L most likely mimics the unique Gln–Glu sequence that is located in the C-3 loop as shown in Figure 1 ▶. The locations of Gln in position 9 and Glu in position 1 of the consensus sequence EKPWWRVKQ indicates that this peptide may assume a circular structure, with its N and C termini folded together when bound to the K60-46L–binding pocket.
Table 2.
Consensus sequences of peptide epitopes and mapping scores for a panel of antirhodopsin monoclonal antibodies determined by phage-display
| Antibody | Consensus peptide sequences/ (homology score) | Original epitope | Reference | Ig class | |||||||||||
| B1gN | S | F | V | D | F | S | N | K | G | N-terminal | Adamus et al. 1991 | G1 | |||
| 2 | 3 | 5 | 1 | 4 | 2 | 2 | 8 | 6 | (7–18) | ||||||
| A | Y | I | N | Y | Q | N | K | G | |||||||
| 2 | 3 | 3 | 3 | 4 | 2 | 2 | 8 | 6 | |||||||
| 4B4 | E | Q | Q | V | S | A | T | A | Q | C-3 loop | MacKenzie and Molday 1982 | G3 | |||
| 3 | 8 | 9 | 3 | 7 | 6 | 3 | 4 | 4 | |||||||
| K42-41L | T | G | A | L | Q | E | R | S | K | C-3 loop | Adamus et al. | G1 | |||
| 6 | 8 | 2 | 6 | 9 | 9 | 6 | 2 | 1 | |||||||
| T | G | P | L | Q | E | R | E | Q | |||||||
| 6 | 8 | 2 | 6 | 9 | 9 | 6 | 0 | 0 | |||||||
| C | T | A | A | E | L | Q | E | G | E | G | C | ||||
| 4 | 7 | 6 | 3 | 4 | 6 | 9 | 4 | 3 | 5 | ||||||
| C | S | A | G | E | R | Q | E | S | R | E | C | ||||
| 5 | 7 | 7 | 3 | 2 | 8 | 9 | 3 | 2 | 3 | ||||||
| K60-46L | E | K | P | W | W | R | V | K | Q | C3 Loop | Adamus et al. 1991 | G1 | |||
| 5 | 6 | 5 | 5 | 5 | 7 | 5 | 6 | 6 | |||||||
| G | R | L | P | P | R | Q | Q | D | |||||||
| 2 | 4 | 1 | 2 | 3 | 7 | 2 | 2 | 2 | |||||||
| K16-107C | G | K | A | L | V | N | D | C-terminal | Adamus et al 1991 | G1 | |||||
| 0 | 0 | 2 | 2 | 1 | 1 | 0 | [ w e a k ] | 340-348) | |||||||
| K16-111C | G | W | A | P | N | G | K | N | G | C-terminal | Adamus et al. 1991 | G1 | |||
| 7 | 7 | 9 | 9 | 8 | 6 | 3 | 1 | 3 | (340-348) | ||||||
| W | A | P | E | V | M | P | G | L | |||||||
| 7 | 9 | 9 | 4 | 1 | 1 | 3 | 2 | 8 | |||||||
| K16-155C | R | S | E | A | E | M | V | A | P | C-terminal | G1 | ||||
| 5 | 8 | 4 | 7 | 7 | 7 | 6 | 7 | 9 | (340-348) | ||||||
| V | S | W | G | D | M | V | P | A | |||||||
| 2 | 8 | 2 | 5 | 5 | 4 | 4 | 5 | 5 | |||||||
| TM7C | Y | Q | (A/T) | P | I | G | G | W | Y | C-4 loop | Abdulaev and Ridge 1998 | ||||
| 2 | 2 | 2 | 4 | 2 | 4 | 5 | 4 | 4 | (304–311) | ||||||
| W | I | M | P | T | G | G | W | Y | |||||||
| 2 | 2 | 2 | 4 | 2 | 4 | 5 | 4 | 4 | |||||||
| K16-50C | T | T | V | S | K | T | E | A | P | C-terminal | Adamus et al. 1991 | G3 | |||
| 4 | 2 | 5 | 8 | 8 | 7 | 5 | 2 | 2 | (335–342) | ||||||
The "homology score" numbers shown in parentheses under the letters in Consensus Peptide Sequences indicate the strength of conservation of amino acid chemical type at each position selected in the phage clone peptide sequences. The homology scores are calculated by using the amino acid substitution score matrix in Table 3. The homology score percent number has been changed to an integer, for example, 1 = 10% to 19.9% up to 9 = 90% to 100.0% for compactness. "Original epitope" is the linear stretch of rhodopsin attributed as the mAb epitope by the original investigators, based on synthetic peptide screening or other nonantibody imprinting methods and is further described in the references in the table.
A possible reason for the selection of more than one consensus epitope by a single mAb may be that the antibody-binding pocket is too large to be filled entirely by a single nine-amino acid phage-displayed peptide (Dall’Acqua et al. 1998; Conte et al. 1999; Sundberg et al. 2000). Related consensus sequences, selected by a single mAb, may represent alternative ways to fill the antibody-binding pocket, which have similar affinity. This may explain why the two K42-41L consensus sequences, TGALQERSK and TG PLQEREQ, have affinities for K42-41L within a fivefold difference of each other. A contributing factor for the appearance of more than one consensus sequence observed for some antibodies in this study may be the lack of sufficient diversity in the phage library to represent all possible nine-amino acid peptides: 209 (∼1011), which is greater than the diversity of commonly used phage display technology (Yip and Ward 1999). The diversity of the J404 phage library (3.3 × 10⁷) is sufficient for the library to contain approximately all possible 7-mer sequences (Burritt et al. 1996). Some positions were more highly conserved than others in our phage clone consensus sequences. Presumably, the most highly conserved residues in each consensus sequence contribute the most to mAb CDR affinity (Conte et al. 1999) and residues in positions that contribute less to affinity can be more variable.
Scoring consensus epitope sequences
Most phage-displayed peptide clones that were selected against a particular mAb had sequences that bore similarity to the overall consensus sequence specific for each mAb (data not shown, available from us on request). Thus, it can be surmised that the antibodies in the panel selected primarily for phage clone sequences that were against the variable binding pockets of each antibody and not against constant regions of the antibody molecule, which are highly homologous across the antibody panel. We do not expect to find exact matches of peptide epitopes to the target protein sequences because amino acids with similar chemical properties are frequently able to substitute effectively for one another in protein structures or in protein–protein interactions. Since the seminal work of Dayhoff et al. in 1978, several different amino acid substitution probability matrices, based on different approaches to elucidation of amino acid substitution patterns, have been developed (for review, see Henikoff and Henikoff 2000). An analysis by Bordo and Argos (1991) found that amino acid substitution probabilities are different for solvent-exposed residues in proteins than the substitution probability for inaccessible buried residues. Peptides selected through phage display mimic surface-exposed loops on target proteins (imprinted by mAbs) and presumably are solvent exposed.
The substitution probability matrix that we used for scoring epitope maps is shown in Table 3. This matrix was modified from a substitution matrix developed by Bordo and Argos (1991) for solvent-exposed residues on proteins. A score of 1.00 was assigned for each exact amino acid match, a score of 0.50 was assigned for substitutions between favored residues on the surfaces of proteins as found by Bordo and Argos, and a score of 0.25 was assigned for substitutions between other chemically similar residues, as classified by Bordo and Argos. A few non-zero substitution scores not based on Bordo and Argos (1991) were also made as follows: We observed that Gly and Pro were frequently substituted for each other in aligned phage clone peptide epitope sequences, and thus, a score of 0.50 was assigned to Gly/Pro substitutions. In addition, Lys/His, Arg/His, and Gly/Ser substitutions are scored as 0.25, due to chemical similarity. All other amino acid substitutions that were not specified by Bordo and Argos or our additions were scored as 0.00.
Table 3.
Amino acid substitution scoring matrix used in the Findmap analyses presented
| 1.00 | 0.50 | 0.25 |
| A | GEKPS | T |
| C | ||
| D | EN | Q |
| E | ADQ | N |
| F | Y | W |
| G | ANP | ST |
| H | KR | |
| I | VL | M |
| K | AEQT | H |
| L | IV | M |
| M | ILV | |
| N | DG | EQ |
| P | AG | |
| Q | EK | DN |
| R | K | H |
| S | AT | G |
| T | KS | AG |
| V | IL | M |
| W | FY | |
| Y | F | W |
The substitution score is 1.00 if identical amino acids are aligned in the peptide and in the target protein. If the peptide and target protein amino acids are very similar (highly probable substitutions connected by black lines in Bordo and Argos 1991), the substitution score is taken to be 0.5. If peptide amino acid and target protein amino acid are within the same chemical group (Bordo and Argos 1991; Fig. 2 ▶, circles), the substitution score is taken to be 0.25. The Bordo and Argos substitution matrix was modified so that Gly/Pro substitutions score 0.50; Arg/His, Lys/His, and Gly/Ser substitutions score 0.25. All other substitutions are considered "forbidden" and score 0.00.
Based upon the numeric mapping scores in Table 2, it is apparent that most consensus epitope sequences have a highly conserved "core" region, which was found in most or all phage clones selected by a particular antibody and sequenced. This highly conserved core region was two to five amino acids in length (underlined): K4241L, TGALQER(SK/ EQ); K16-111C, WAPEVMGPL and GWAPNGKNG; K16-155C, RSEAEMVAP; and K16-50C, TTVSKTEAP. Some of the antibodies yielded one or two consensus sequences that did not contain a single strongly conserved core region, but rather two or more discontinuous, usually less highly conserved sequences of one to two amino acids each, with conserved "motifs" spacing (underlined): K16-155C-VSWGDMVPA, K60-46L-EKPWWRVKQ and GRLPPRQQD, K42-41L-(C)-TAAELQEGEG-(C) and (C)-SAGERQESRE-(C), 4B4 EQQVSATAQ, and B1gN SFVDFSNKG and AYINYQNKG. Those residues of the antigen protein that contribute most significantly to the antibody-binding affinity are expected to be the most highly conserved in peptides mimicking the epitopes of the antigens. It seems possible that the more conserved peptide epitope residues might dictate a more preferable peptide structure that could indirectly lead to higher affinity. This alternative explanation does not appear to agree with ongoing studies of the conformation of antibody-bound peptide epitopes in validation cases in which the structures of target protein bound to the antibody are known from X-ray diffraction (data not shown). In mAb–peptide complexes with known X-ray structures, in which alanine scanning mutagenesis and double-mutant cycles have been carried out to determine key residues involved in interactions, approximately one third of the contact residues were found to contribute most substantially to the energetics of the antigen-antibody interactions (Dall’Acqua et al. 1998; Conte et al. 1999).
Epitope mapping onto the rhodopsin sequence
Different possible mappings of the consensus peptide epitope sequences to the rhodopsin sequence must be considered and evaluated in order to explore the possibility of extracting conformational information from the antibody imprints. Epitope mapping of phage-display–derived consensus sequences onto a target protein has traditionally been carried out by visual inspection, and that is how we initially mapped many of the consensus sequences onto the rhodopsin primary sequence. Visually aligned mappings are shown in Table 4: B1gN mappings 1 and 2, K16-111C mapping 1, and K42-41L mappings 1 and 2. Visual mappings of the other antibody epitopes in Table 2 to the rhodopsin sequence are shown in the Supplemental Material.
Table 4.
Summary of FINDMAP and visual mappings of epitopes of the selected anti-rhodopsin antibodies

The "Substitution score" is the degree to which the epitope sequence resembles the rhodopsin sequence to which it was mapped. Table 3 was used to score residue relatedness. An exact amino acid match (green letters in the table) scores 1.0, mapping to a closely related residue scores 0.50 (purple letters), mapping to a less related residue scores 0.25 (orange letters), and mapping to a "forbidden" residue (red letters) scores 0.0. The sum score is divided by the epitope length and converted to a percentage. Residues in black in some epitope mappings were forced to a particular residue before FINDMAP was run. All the FINDMAP results shown were obtained with a gap penalty of 0.5 and a maximum gap width penalty of 1.5 (Mumey et al. 2002). Mappings with a FINDMAP score labeled N/A were done by manual inspection. The constraint codes for different mappings are as follows. (1) most stringent restrictions for mapping to the rhodopsin sequence using rhodopsin residues limited to the cytoplasmic face (65–70, 140–150, 226–253, 306–348); (2) a wider range of rhodopsin sequence was made accessible for mapping, including rhodopsin residues (61–77, 133–152, 216–254, 301–348); (3) the least stringent restrictions on the rhodopsin residues used for mapping (51–90, 116–164, 211–264, 291–348); (4) for mapping the extracellular face of rhodopsin, allowed regions are 1–36, 91–109, 171–199, 277–289; and (5) similar to mapping the extracellular face of rhodopsin except slightly less stringently constrained to the extracellular; rhodopsin residues 37–45 and 200–205 were also allowed. The "ROYGBIV" rainbow color scheme under "epitope sequences" corresponds to the colors used in Figures 5 ▶–7. Red denotes position 1 of the consensus and violet in position 9. Tabulations of additional mapping are included in the Supplemental Material.
There are a multitude of different ways in which peptide epitopes can be mapped to target protein antigen sequences. To explore a more systematic alignment of the antibody epitopes with the amino acid sequences of the antigen, we developed the FINDMAP program to systematically explore the alignment of the epitope and compare the multitude of different ways in which peptide epitopes can be mapped to target protein sequences. Inspection of structures of protein–mAb complexes (Padlan 1996) indicates that the spatial presentation of side-chains seen by mAbs is usually substantially different from the linear sequence of the target protein backbone, creating a great deal of complexity and variety in the possible mappings. Thus, when mapped to the target protein sequence, the epitope can be reversed, local transpositions can exist, and gaps can occur, resulting in a very large number of mapping possibilities, even for relatively short epitopes mapped to modest-sized proteins. The FINDMAP algorithm was designed to consider these possibilities. Briefly, FINDMAP uses a branch-and-bound approach (Atallah 1999) to examine all of the better-scoring matches between amino acids in the peptide probe and target protein primary sequence. This mapping procedure was shown to be a computationally "hard," NP-complete problem, and the details of the algorithm are described elsewhere (Mumey et al. 2002). To evaluate nonidentity substitution matches between target and probe sequences, we used the amino acid substitution matrix shown in Table 3 and discussed previously.
A "gap penalty" is added to an alignment in FINDMAP for each one residue gap used to map the peptide probe sequence to the target protein sequence. The sum of all amino acid substitution scores for each possible residue alignment is calculated, and gap penalties for the alignment are subtracted from the total alignment score. For example, a peptide probe of sequence "ADEFG" maps to a target protein sequence "ADXEFG" (gap width = 1 residue for the "X" gap) with a higher score than to "ADXXEFG" (gap width = 2 residues for the "XX" gap). Gaps above a certain (user adjustable) size receive no additional penalty because the gap can be assumed to be between two loops separated by an arbitrary length of intervening residues. Values of 0.5 for the gap penalty and 1.5 for maximum gap width penalty, as diagrammed in Figure 2A ▶, were chosen for mapping rhodopsin with FINDMAP in this study. These values are based upon prior optimization in which these values were found to lie in the middle of a range of values for these parameters that gave good epitope mappings with a test actin epitope (Mumey et al. 2002, 2003).
Figure 2.

FINDMAP gap penalty function primarily used in this work and clustering of interresidue proximity constraints mapped to the dark-rhodopsin structure. The proximity constraints obtained by mapping discontinuous epitope-mimetic peptide sequences onto the rhodopsin sequence are listed in Table 5. The numbers in B–D refer to amino acids in the rhodopsin primary sequence, which is shown as a faint Cα trace. The thickness of the colored lines correlates with the number of times a proximity constraint is found for a mAb. (A) Adjacent residues in the consensus epitope sequence receive a gap penalty if they are mapped to the rhodopsin primary sequence with residues intervening between them. In the function illustrated here, the mapping of AB to AX1B (with one intervening residue) incurs a 0.5 penalty, and the maximum gap width penalty of 1.5 is assigned if AB is mapped to AXnB, where n ≥ 3. (B) Proximity constraints from 13 mappings to the intradiskal side of rhodopsin that were found by using B1gN. The lines are color-coded based on average block substitution scores in Table 5: blue, 100% sequence match; green, 80%–99%; orange, 60%–79%; and red, <60%. (C) Proximity constraints from 30 mappings to the cytoplasmic face of rhodopsin for mAbs K42-41L and K60-46L. Sixteen mappings of K42-41L consensus peptides (red) and 14 mappings of K60-46L consensus peptides (orange) are shown. (D) Proximity constraints from 23 consensus peptide mappings to the cytoplasmic face of rhodopsin for mAbs K16-111C and K16-55C. Nine mappings of K16-111C consensus peptides (green) and 14 mappings of K16-155C consensus peptides (blue) are shown.
MAbs that are the most easily used for structural determination by antibody imprinting are those with modestly discontinuous epitopes that can be recognized clearly on the target protein sequence (Burritt et al. 1998). It is known from X-ray structures of Fab-Ab complexes that some antibody epitope sequences are inherently more discontinuous than are others (Benjamin 1995). FINDMAP scores depend on the degree of discontinuity of the antibody epitope surface because of the gap penalties, and thus, the scores are only directly comparable between different mappings of the same probe sequence, because added gap penalties lower the FINDMAP score. Thus FINDMAP scores are not directly comparable between antibodies or between different epitope probe sequences for a single antibody, but they are comparable for different maps of the same consensus sequence. Because there is a correlation between epitope discontinuity on the protein surface imprinted by the antibody and lower FINDMAP scores, antibodies with consensus peptides that have low FINDMAP scores may yield the most useful structural information on target proteins.
Complex conformational epitopes mapped manually and by FINDMAP
By using FINDMAP to explore all possible mappings of epitopes, we found that peptide consensus sequences often cannot be mapped to the rhodopsin sequence using less than two to four noncontinuous stretches of rhodopsin. This was somewhat surprising because seven of nine of these antibodies were initially characterized as recognizing continuous epitopes (Adamus et al. 1991; Abdulaev and Ridge 1998). Our findings, however, are quite consistent with other studies of protein antibody epitopes, in which the ratio of antibodies recognizing discontinuous epitopes relative to linear epitopes is very high (see Benjamin 1995).
Regions of rhodopsin that were mimicked by consensus epitopes were often not in the same sequential order in the epitope as in the linear rhodopsin sequence. For example, the G(A/P)L is strongly conserved in the TGPLQEREQ K42-41L mAb consensus sequence peptide and scores the best by far when mapped to 327-PLG-329 in rhodopsin. This PLG sequence is a unique three-amino acid stretch on the cytoplasmic side of rhodopsin, which was chosen by FINDMAP for mapping the GPL of TGPLQERSK for a large percentage of high-scoring mappings. The PL is in the same order, but the G is in the N-terminal rather than in the C-terminal as in the rhodopsin sequence. A consensus epitope found for antibody K16-111C, WAPEVMGPL, also mimics 327-PLG-329 and in the same inverted order of "G" (GPL versus PLG). It appears that the detailed conformation of the protein in this region may expose the amino acid side-chains to the medium in a different spatial arrangement than the linear peptide sequence, similar to the conclusions by Jesaitis et al. (1999) in the mapping of two complex epitopes onto the surface of actin.
FINDMAP mappings were scrutinized, and the best scoring ones are shown in Table 4 for three selected mAbs, along with manual mappings for some consensus sequences. Mappings of additional mAbs are shown in the Supplemental Material. Nonexact amino acid substitutions between consensus peptides and the rhodopsin sequence were commonly found in the best-scoring mappings. The residues in Table 4 are color-coded based on the substitution scores in Table 3 as follows: green, amino acid identity match between epitope sequence and rhodopsin; purple, amino acid substitution score 0.50; orange, amino acid substitution score 0.25; and red, amino acid substitution score 0.0 (substitution is unfavorable). Substitutions were almost always between amino acids with similar chemical properties, as can be seen by inspection of the color codes of residues in Table 4. Two mappings of SFVDFSNKG from B1gN that have the best substitution score (mappings 5 and 6 for this mAb in Table 4) have an exact match to discontinuous regions of the rhodopsin sequence. The mapping of the K16-111C epitope, WAPEVMGPL, with the best FINDMAP and substitution score, AAAEVMGPL (mapping 3 for this mAb in Table 4), matches the amino acids exactly in seven out of nine positions (xAxEVMGPL) and has substitutions of Ala for Trp and Ala for Pro. One of the mappings of K42-41L with the best combination of FINDMAP and substitution scores maps TASEQQEGEA to the epitope TAAELQEGEG (mapping 15 for K42-41L in Table 4). In mapping 15, nine of 10 residues score ≥0.50. Overall substitution scores for each mapping were calculated and ranged from 58% to 100% homology between the peptide epitope and target rhodopsin sequence as shown in Table 4 and in the Supplemental Material.
Constraints to the conformation of the target protein structure
Gaps in the epitope maps imply that the sequences on either side of the gap are in close proximity, such that they fit within the antibody-binding site in the folded protein. Because of the packing disorder of the surface loops and C-terminal region of rhodopsin in the crystals (based on relatively large B factors in these regions from the X-ray structure) and expected rearrangement of the cytoplasmic surface after light excitation, residues that appear buried in the model of rhodopsin were considered acceptable for mapping. The regions that were found to be the most disordered in the X-ray structure are implicated in the mappings for several mAbs: 236–240, K60-46L, K42-41L, and 4B4; 331–333, K16-111C, K16-107C, and K16-155C. The most recent refinement of the dark-adapted crystal structure of rhodopsin (1HZX; Teller et al. 2001) was used to aid in the interpretation of the epitope mapping data. This structure has regions that lack sufficient resolution to be included in the X-ray model. We built the missing regions, Gln 236 to Ser 240 on the C-3 loop and Asp 331 to Ala 333 on the C-terminal tail onto rhodopsin, as described in Materials and Methods. The loops were energy-minimized to remove bad contacts and to improve backbone angles, using CHARMm (Mackerell et al. 1998).
Average local substitution scores were calculated for all gaps, based upon how well the single amino acid on each side of a gap matched to residues in corresponding positions in the peptide epitope sequence. Physical proximity distances in the structures described by the gap constraints presumably are between 3 and 6 Å, depending on the length of the side-chains of the residues on either side of the gap, although we have not attempted to use precise physical gap distance information in the present article. The 73 best mappings shown in Table 4 and in the Supplemental Material were converted into 196 total and 125 unique long-distance constraints on the structure of rhodopsin or rhodopsin photo-intermediates, which are listed in Table 5 and in the Supplemental Material.
Table 5.
Summary of distance proximity constraints on rhodopsin conformations based upon epitope mappings of selected mAbs
| Constraint | |||||||
| Antibody name | No. occurrences | From | To | Avg. block sub. score | Map type | ||
| Intradiskal | |||||||
| B1gN | 1 | N | 2 | V | 11 | 75% | I |
| B1gN | 1 | T | 4 | F | 9 | 75% | I |
| B1gN | 1 | F | 9 | V | 11 | 100% | I |
| B1gN | 1 | V | 11 | F | 24 | 86% | F |
| B1gN | 1 | V | 11 | F | 37 | 88% | F |
| B1gN | 1 | P | 12 | V | 204 | 88% | F |
| B1gN | 1 | F | 13 | D | 190 | 100% | F |
| B1gN | 2 | F | 13 | D | 282 | 100% | V |
| B1gN | 1 | N | 15 | T | 17 | 75% | I |
| B1gN | 1 | N | 15 | Q | 28 | 100% | F |
| B1gN | 2 | N | 15 | Q | 36 | 100% | F |
| B1gN | 1 | N | 15 | Q | 184 | 100% | F |
| B1gN | 1 | N | 15 | Q | 279 | 100% | F |
| B1gN | 13 | K | 16 | G | 18 | 100% | V |
| B1gN | 1 | T | 17 | Y | 29 | 42% | I |
| B1gN | 1 | V | 19 | Q | 28 | 58% | I |
| B1gN | 1 | V | 19 | Y | 30 | 75% | I |
| B1gN | 1 | S | 22 | F | 24 | 100% | F |
| B1gN | 1 | Q | 28 | Y | 191 | 88% | F |
| B1gN | 5 | Y | 30 | A | 32 | 100% | V |
| B1gN | 4 | Y | 30 | I | 189 | 88% | F |
| B1gN | 2 | Q | 36 | Y | 191 | 88% | F |
| B1gN | 1 | Y | 43 | I | 189 | 88% | F |
| B1gN | 1 | Q | 184 | Y | 191 | 88% | F |
| B1gN | 1 | D | 190 | V | 204 | 100% | F |
| B1gN | 1 | Y | 191 | Q | 279 | 88% | F |
| B1gN | 1 | V | 204 | D | 282 | 100% | F |
| B1gN | 1 | S | 281 | F | 283 | 67% | I |
| B1gN | 1 | D | 282 | G | 284 | 50% | I |
| Cyloplasmic group I | |||||||
| K42-41L | 2 | R | 69 | E | 239 | 90% | F |
| K42-41L | 1 | R | 69 | S | 338 | 100% | F |
| K42-41L | 1 | R | 147 | E | 239 | 100% | F |
| K42-41L | 1 | R | 147 | S | 338 | 100% | F |
| K42-41L | 1 | G | 149 | E | 332 | 75% | F |
| K42-41L | 1 | E | 150 | A | 235 | 75% | F |
| K42-41L | 1 | E | 150 | Q | 237 | 81% | F |
| K42-41L | 1 | E | 150 | A | 333 | 75% | F |
| K42-41L | 1 | K | 231 | A | 234 | 67% | I |
| K42-41L | 1 | K | 231 | Q | 238 | 81% | F |
| K42-41L | 1 | E | 232 | A | 234 | 67% | F |
| K42-41L | 1 | A | 233 | Q | 236 | 72% | F |
| K42-41L | 1 | A | 233 | Q | 237 | 70% | I |
| K42-41L | 1 | Q | 237 | E | 239 | 57% | F |
| K42-41L | 1 | Q | 237 | E | 332 | 75% | F |
| K42-41L | 4 | Q | 238 | S | 240 | 69% | F |
| K42-41L | 4 | Q | 238 | L | 328 | 90% | F |
| K42-41L | 4 | E | 239 | K | 245 | 77% | V |
| K42-41L | 1 | E | 239 | R | 314 | 80% | F |
| K42-41L | 3 | S | 240 | K | 248 | 58% | F |
| K42-41L | 1 | K | 245 | E | 247 | 67% | F |
| K42-41L | 1 | K | 245 | E | 249 | 67% | F |
| K42-41L | 1 | K | 245 | S | 343 | 67% | I |
| K42041L | 1 | A | 246 | K | 248 | 67% | I |
| K42-41L | 3 | G | 324 | N | 326 | 75% | F |
| K42-41L | 1 | P | 327 | G | 329 | 83% | I |
| K42-41L | 1 | G | 329 | T | 342 | 100% | I |
| Cytoplasmic group II | |||||||
| K16-111c | |||||||
| K16-111c | 1 | N | 145 | G | 324 | 90% | I |
| K16-111c | 1 | N | 145 | P | 347 | 100% | I |
| K16-111c | 3 | F | 148 | A | 346 | 81% | V |
| K16-111c | 1 | N | 151 | G | 324 | 90% | H |
| K16-111c | 1 | N | 151 | P | 347 | 100% | H |
| K16-111c | 3 | E | 232 | V | 318 | 75% | F |
| K16-111c | 1 | E | 249 | P | 347 | 67% | H |
| K16-111c | 1 | T | 251 | G | 329 | 75% | H |
| K16-111c | 1 | N | 310 | G | 324 | 90% | I |
| K16-111c | 1 | N | 310 | P | 347 | 100% | I |
| K16-111c | 1 | N | 315 | M | 317 | 83% | F |
| K16-111c | 1 | N | 315 | P | 327 | 83% | F |
| K16-111c | 2 | M | 317 | G | 329 | 100% | V |
| K16-111c | 1 | V | 318 | N | 326 | 75% | I |
| K16-111c | 2 | K | 325 | P | 327 | 73% | F |
| K16-111c | 1 | N | 326 | M | 317 | 90% | F |
| K16-111c | 2 | N | 326 | P | 347 | 58% | I |
| K16-111c | 3 | P | 327 | G | 329 | 100% | I |
Additional distance proximity constraints on rhodopsin confirmations, based on the other mAbs mapped are presented in Supplementary Material to this paper.
Epitope maps that contain rhodopsin sequence gaps were used to infer structural proximities in the folded protein, as explained in the text. Average block substitution scores were calculated using the amino acid similarity matrix (based on Table 3) between the phage display consensus epitope and all linearly continuous residues of rhodopsin that are mapped to on either side of a gap. "Map type" describes how the mapping was obtained: F = mapped with FINDMAP, I = mapped by manual Inspection, H = Hybrid of both methods (some residues held constant then mapped by FINDMAP), or V = aVeraged, in cases where the gap is present in multiple mappings from different source types.
The proximity constraints are grouped by mAb in Table 5 and in the Supplemental Material, and are sorted based on the rhodopsin residue number of the most N-terminal residue in each constraint. For example, constraints between Arg 69 and Glu 239 are implicated for K42-41L. The mappings that provide these constraints are numbers 4 and 5 for K42-;41L as shown in Table 4 and T-243 T-242 A-241 S-240 Q-238 E-239 R-69 L-68 K-67 and T-243 T-242 A-241 S-240 Q-238 E-239 R-69 S-338 K-339. Both mappings contain Glu-Arg on either side of a gap, in agreement with the consensus sequences, TGALQE-(gap)-RSK, so the average local substitution score for the residues on each side of the gap is 100% (shown in the Supplemental Material). These two mappings have average block substitution scores of 100% and 80% respectively, as shown for individual mappings in the Supplemental Material. The average block score was calculated by determining the substitution score of all contiguous residues on both sides of the gap up to the next gap on the end of the consensus sequence (underlined residues): TTAS-240 Q238 E239 -(gap)- R69 L68 K67 (Table 4; K42-41L mapping 5) and TTAS-240 Q238 E239 -(gap)- R69 S338 K (Table 4, K42-41L mapping 4). Some constraints were obtained in more than one of the best mappings for a particular epitope, as indicated in Table 5 and the Supplemental Material. In total, 122 unique proximity constraints were obtained from the panel of mAbs used in this study.
Clustering of distance proximity constraints from multiple high-scoring mappings
All of the distance proximity constraints were superimposed onto the dark-adapted structure of rhodopsin to determine whether spatial clustering was present in the conformational constraints. We assume that any single constraint may or may not be accurate, but the overall pattern of constraints inferred from a mAb is likely to identify regions that constitute the epitope. Ongoing studies of FINDMAP using antibody–antigen structures in the Protein Data Bank (PDB) as validation cases support this assumption (T. Angel, B.M. Mumey, and E.A. Dratz, unpubl.). The FINDMAP and manual constraints in Table 5 and the Supplemental Material were plotted onto the surface of the dark-adapted structure of rhodopsin, as shown in Figure 2 ▶, B–D. Lines were drawn between pairs of constrained residues, with the line thickness proportional to the number of times a constraint was found. Views of the intradiskal and cytoplasmic faces of rhodopsin are represented as two-dimensional projection images. Depth was simulated by the size and boldness of the sequence number labels, with more proximal residues indicated by labels in larger and bolder fonts.
Constraints from 13 mappings of B1gN consensus epitopes are indicated on a schematic of the intradiskal face of dark-adapted rhodopsin in Figure 2B ▶. The distance proximity constraints are color-coded, based on the value of the average block score of the sequence match on each side of the gap site for each individual mapping shown in the Supplemental Material: blue, 100%; green, 80%–99%; orange, 60%–79%; and red, <60% sequence match on each side of the gap in Figure 2B ▶. The B1gN mAb, which maps to a well-ordered region of the X-ray structure on the N terminus, was previously found to have no influence on the MI⇋MII equilibrium of rhodopsin (B. Konig, K.P. Hofmann, and P.A. Hargrave, unpubl.), and thus, we infer that it binds to an epitope that changes relatively little upon photo-excitation. The epitope residues most buried in the mAb-binding sites that are responsible for high-affinity interactions are likely to be grouped relatively tightly within ∼500 Å2 (Conti et al. 1999), which is equivalent to a circle with a ∼12 Å radius. This relatively compact mapping of the B1gN-binding site onto the surface of the dark-adapted rhodopsin X-ray structure is consistent with the size of a typical antibody-binding site, which supports the idea that there are not major structural rearrangements in this region of rhodopsin upon photo-excitation.
The mAbs that were directed against the cytoplasmic surface of rhodopsin were found to group roughly into the two different spatial patterns of proximity constraints illustrated in Figure 2 ▶, C and D. If the region of the light-excited structure that is recognized by a mAb differs from the dark-adapted X-ray structure, we would not expect a compact pattern of proximity constraints for that mAb, but instead multiple spatially separated nexuses of clustering. In Figure 2 ▶, the color codes in C and D differ from those in B. Thirty mapping constraints for mAbs K42-41L (in red) and K60-46L (in orange) are shown in Figure 2C ▶. There is a nexus of clustering of constraints for both of these antibodies around rhodopsin residues 230–232, 236–240, and 245–248 on the C-3 surface loop of rhodopsin. There is also weaker clustering around residues spatially close to 327–332 on the C-terminal tail for mAb K42-42L and around residues near 147–150 on the C-2 loop for mAb K60-46L. The diffuse pattern of the constraints superimposed onto the dark-adapted rhodopsin structure in Figure 2C ▶ is consistent with structural changes in light-excited rhodopsin relative to dark-adapted rhodopsin, as discussed further below.
MAbs K16-111C (green) and K16-155C (blue) show two strong clustering centers as illustrated in Figure 2D ▶, using 23 mappings. These clustering centers are not present in mappings of mAbs shown in Figure 2C ▶. The first cluster to the upper right of Figure 2D ▶ is comprised of residues 315–318 on the eighth helix and of residues around 320–330 on the C terminus. The second cluster is centered around residues near 345–348 at the extreme C terminus. Both of these antibodies also map to a third weaker nexus incorporating approximately residues 240–250, on the C-terminal half of the C-3 loop and the cytoplasmic end of helix VI. Because there are two or three nexuses of clustering for each mAb in Figure 2 ▶, C and D, that are spatially far apart on the dark-adapted structure, instead of a single tight cluster as required for a mAb-binding site, these constraints appear cumulatively to indicate relatively large-scale rearrangements in the rhodopsin surface structure that differs from the dark-adapted structure after photoactivation.
Investigation of antibody preferences for different light-excited conformations of light-excited rhodopsin
Light-excited rhodopsin rapidly forms an equilibrium mixture of meta-I and meta-II conformations, which evolve more slowly into meta-III and the retinal-free opsin apoprotein (Wald 1968). Antibodies in the panel were made by injecting mice with light-bleached rhodopsin. The conformations of rhodopsin imprinted by the antigen-specific receptor on B cells when they reacted with the antigen are unknown, but presumably can vary over a range of conformations. The retinal chromophore hydrolyzes from bleached rhodopsin in an hour or two, forming the retinal-free opsin protein (Wald 1968). Vogel and Seibert (2001) recently showed, using FTIR spectroscopy, that the retinal-free opsin protein exists in an equilibrium mixture of conformations that resemble MI and MII rather closely. Moreover, the photolyzed chromophore all-transretinal binds to the opsin and generates an active confirmation (Robinson et al. 1992; Sachs 2000). Thus, the antibodies we are studying might recognize active or inactive conformations of light-excited rhodopsin.
To assess conformational preferences of the mAbs for MI or MII, flash photolysis assays (Pulvermüller et al. 1997) were conducted in the presence of several of the antibodies in the panel. Meta-II has a maximum absorbance at 380 nm, and the isosbestic point between MI and MII is at 417 nm. Enhancement of MII or MI in a sample is measured by using a dual-wavelength spectrophotometer to monitor differences in absorbance between 380 nm and 417 nm, Δ(A380 to A417), after a fraction of the rhodopsin is flash-photolyzed (bleached; Emeis and Hofmann 1981). The G-protein transducin and certain synthetic peptides, which mimic linear regions of transducin, have previously been shown to shift the MI⇋MII equilibrium toward the active MII conformation of rhodopsin. (Hamm et al. 1988; Dratz et al. 1993; Kisselev et al. 1994; Martin et al. 1996). Thus, the effects of mAbs on the MII enhancement are expected to correlate with the degree of preference of the antibody for binding to MI or MII. The mAb K42-41L was previously found to inhibit MII formation (B. Konig, K.P. Hofmann, and P.A. Hargrave, unpubl.). The extra-MII assays are typically done under temperature and pH conditions that substantially favor MI over MII (e.g., a ratio of 10:1), by transducin or suitable transducin-peptides (Emeis and Hofmann 1981; Parkes et al. 1999), so that the production of extra MII can be detected by a shift in the MI⇋MII equilibrium. Under these conditions, the MII signal can have a 10 times larger amplitude for enhancement (shifting of the MI⇋MII equilibrium toward MII) than for depression (shifting of MI⇋MII equilibrium in favor of MI). To determine whether any of the mAbs had a preference for MI, we shifted the MI⇋MII equilibrium toward MII by binding intact transducin or the appropriate transducin peptides, and tested the ability of each mAb to effect the elevated extra-MII signal after flash excitation, as shown in Figure 3 ▶.
Figure 3.
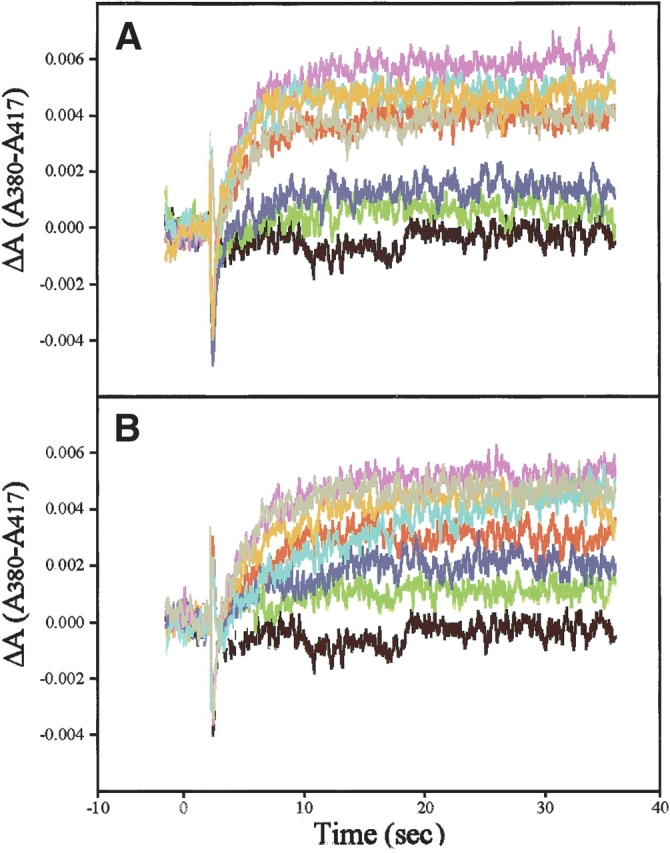
Extra-meta-II assays of flash-excited rhodopsin with antirhodopsin Fab antibodies with or without transducin-mimetic peptides. The difference in optical absorbance between the MII absorption maximum at 380 nm and at an isosbestic point between MI and MII at 417 nm (A380-A417), was measured versus time in hypotonically washed disk membrane suspensions. Formation of light-activated rhodopsin was triggered by a flash of 500 ± 20-nm light that bleached 12% of the rhodopsin. All samples contained 10 μM rhodopsin and 1 mM Gtα(340–350) wild-type peptide (IKENLKDCGLF; A), 10 μM Fab (if present). Black, rhodopsin baseline. Red indicates rhodopsin + peptide; green, rhodopsin + K42-41L and peptide; dark blue, rhodopsin and K60-46L and peptide; magenta, rhodopsin and K16-107C and peptide; light blue, rhodopsin and K16-111C + peptide; orange, rhodopsin and K16-155C and peptide; and grey, rhodopsin and 4B4 and peptide. (B) Shows 1 mM Gtγ(50–71) farnesyl peptide (EDPLVKGIPEDKNPFKELKGGC-farnesyl), 10 μM Fabs. The color key is the same as in A.
In the presence of the transducin α-subunit C-terminal 340–350 wild-type peptide IKENLKDCGLF (Gtα[340–350]; Hamm et al. 1988), mAbs K42-41L and K60-46L reduced the extra-MII signal, whereas mAbs K16-107C, K16-111C, and K16-155C enhanced the extra-MII signal, and mAb 4B4 had little effect (Fig. 3A ▶). MI or MII preferences were not determined for TM7C or B1gN in the present work, due to limited amounts of antibody available. However, Abdulaev and Ridge (1998) have previously reported that TM7C strongly prefers MII, and B1gN was previously determined to have no effect on the MI/MII equilibrium (B. Konig, K.P. Hofmann, and P.A. Hargrave, unpubl.). Based upon the extra-MII assays and previous studies, therefore, the antirhodopsin antibodies fall into three categories: those with preferences for MI (K42-1L and K60-46L) in the presence of transducin peptides that stabilize MII, those with preferences for MII (K16-107C, K16-111C, K16-155C, and TM7C), and those with little or no preference for MI/MII (B1gN and 4B4). Very similar effects on the MI⇋MII equilibrium were found in the presence of a different transducin peptide, the C-terminal farnesylated γ-subunit peptide (Gtγ[50–71]), EDPLVKGIPEDKNPFKELKGGC-farnesyl that also stabilizes MII (Kisselev et al. 1994) as shown in Figure 3B ▶. Similar results were obtained in the presence of intact transducin, but the mAbs were less effective in competing with transducin than with the competent transducin peptides, as evidenced by a smaller net change induced by the mAbs in the extra-MII signal (data not shown). The extra-MII assays use a 12% bleach of rhodopsin and thus were carried out with in the presence of a large excess of unbleached rhodopsin (88%). The assays presented in Figure 3 ▶ were not capable of revealing the preferences of the mAbs for rhodopsin relative to the photo-intermediates but are sensitive to the relative preferences of the antibodies for MI and MII species, in the presence of transducin peptides.
It was unexpected that some of the Fabs would be able to increase the amount of MII more effectively than essentially saturating amounts of the competent transducin peptides. Recent flash photolysis studies have found that additional MI and MII species and a "square" kinetic scheme were required to fit the detailed pathway followed by rhodopsin after light-excitation (Jäger et al. 1998; Szundi et al. 1998). The existence of these additional M species offers a rationale for the effects of the antibodies on the extra-MII assay as follows: The square kinetic scheme includes two forms of MII that were called MII* and MIIH+ in the analysis of rhodopsin flash photolysis data in the native membrane (Jäger et al. 1998), which appear to be similar to the MIIa and MIIb species proposed earlier (Arnis and Hofmann 1993). If the transducin peptides poised the system by stabilizing the MII* (∼MIIa) state, then the behavior in Figure 3 ▶, A and B, could be explained by some mAbs increasing 380-nm absorbance by favoring MIIH+ (which absorbs at 380 nm), and other mAbs favoring MI480. The conformation that is most likely to stimulate the G protein is MIIH+ ≈ MIIb, which is consistent with kinetic pH/rate profiles (Hofmann 1999) and a previously proposed two-site sequential fit mechanism for G-protein activation (Kisselev et al. 1999). In light of the above explanation, the mAbs that favor MII in Figure 3 ▶, A and B, would be carrying information on the conformation of light-excited rhodopsin that is active in stimulating the G protein. Vogel and Seibert (2001) found a conformation of opsin favored at low pH that had a very similar FTIR spectrum to MII and which might also be similar to MIIH+.
Visualization of epitopes of mAbs with no preferences for rhodopsin photo-intermediates
To illustrate the relation of the antibody imprint mappings to the dark-adapted protein structure, we prepared space-filling models of the protein surfaces for representative mappings. Most FINDMAP mappings of the B1gN consensus peptides were found to be quite compact on the surface of dark-adapted rhodopsin, as shown by two views of mapping 1 in Figure 4 ▶, A and B, that are rotated 90° relative to each other. The ROYGBIV color scheme for each epitope runs from red at the N terminus through orange, yellow, light green, dark green, light blue, medium blue, dark blue, and finally purple at the C terminus of the peptide sequence. In this and the subsequent figures, the C- and N-terminal ends of rhodopsin are shown in a salmon color, and the different interhelix loops are shown in different shades of grey, as illustrated in Figure 1 ▶. The compactness of the mapping of the B1gN epitope onto the rhodopsin sequence is consistent with there being little conformational change in this region of the intradiskal surface upon light excitation.
Figure 4.

Selected antirhodopsin antibody consensus epitopes for mAbs with no rhodopsin photo-state preference, mapped to the surface of the dark rhodopsin x-ray structure. The top line of text in each panel is the antibody name followed by the mapping ID in parentheses that corresponds to the mapping numbers in Table 4. The second line of text is the (C)onsensus epitope "probe" sequence, and the third line contains the residues used in the (M)apping. Mapped epitope residues are ordered such that they follow a rainbow color scheme from red (residue one of the consensus epitope) to purple (and pink if there are 10 residues in the epitope, as also shown in Table 4). A two-dimensional connectivity map is shown below each image, with corresponding residues having the same colors as in the images above. Distance proximity constraints on rhodopsin for each mapping are shown in the two-dimensional connectivity map as curved black lines connecting non-contiguous rhodopsin residues. (A, B) Two views of the epitope of the B1gN mAb on the intradiskal surface from different angles, showing consensus epitope peptide SFVDFSNK that was mapped on rhodopsin as SFGDFSNKG (mapping 1 for this mAb from Table 4). (C) View of cytoplasmic mAb 4B4 consensus peptide EQQVSATAQ mapped on rhodopsin residues as EQQASATTQ (mapping 1 for this mAb from Table 4). (D) Proposed orientation of residues 235–244 of the C-3 loop of rhodopsin, based on the mapping scheme in C.
The 4B4 mAb directed against the cytoplasmic surface also shows little or no effect on MI⇋MII equilibrium. A high-scoring, essentially linear mapping of the 4B4 epitope to the dark-adapted structure depicted in Figure 4C ▶ implies that Ala 235 (light green in Fig. 4C ▶) is spatially proximate to Ser 240 (dark green in Fig. 4C ▶). In the model that we built of the dark-adapted rhodopsin structure, these residues are not spatially close. The residues in question lie in the C-3 loop, a region of the molecule that is disordered and undefined in the X-ray structure. The antibody imprint implies, however, that the correct conformation in this region contains instead a loop between residues Gln 236 and Ser 240, bringing these residues spatially close, as diagrammed in Figure 4D ▶. We are currently seeking to obtain a more detailed picture of the conformation of this loop, by determining the crystal structure of the 235–244 peptide epitope when it is bound to the 4B4 Fab. It appears from the lack of effect of 4B4 on the MI⇋MII, however, that the conformation of the 5–6 loop is weakly coupled to the MI⇋MII equilibrium.
Epitopes of mAbs with preferences for MI or MII
Light-activated rhodopsin triggers visual excitation by changing its conformation and binding transducin on the cytoplasmic surface, followed by the slower binding of rhodopsin kinase and arrestin to shut off visual excitation (Hofmann 1999). We did not expect, and generally did not find, cytoplasmic mAb consensus epitope sequences clustering to compact patches when mapped onto the dark-rhodopsin X-ray structure, presumably because of structural movement occurring after photo-excitation. Space-filling models of representative best mappings of two consensus epitopes selected by K42-41L, a mAb that prefers MI, are shown in Figure 5 ▶. Most high-scoring FINDMAP mappings of TGALQERSK usually contain several of the same residues as the TGPLQEREQ consensus epitope that is shown in Figure 5A ▶. A large number of similar K42-41L (and K16-155C) mappings are found in which the G(A/P)L sequence in the consensus epitope maps to G329 P327 L328 in the rhodopsin C-terminal tail. The commonly mapped inversion of (A/P)L relative to PL in the rhodopsin sequence may be due to localized folding in this region of light-activated rhodopsin.
Figure 5.

Selected antirhodopsin antibody consensus epitopes for K42-41L, a mAb with preference for metarhodopsin I mapped to the cytoplasmic face of the dark rhodopsin X-ray structure. See Figure 4 ▶ legend for explanation of the color scheme and other relevant details. Mappings are shown for two different K42-41L mAb consensus peptides. (A) TGPLQEREQ consensus peptide mapped on rhodopsin residues as GNPLQEKEK (mapping 9 for this mAb from Table 4). (B) Disulfide constrained (C)TAAELQEGEG(C) consensus peptide mapped on rhodopsin residues as TASEQQEGEA (mapping 15 for this mAb from Table 4).
Representative best mappings of the consensus peptide sequences of two mAbs with MII preference, K16-111C and K16-155C, are shown in Figure 6 ▶. The best mappings of these mAbs make use of C-terminal residues, often near the extreme C-terminal, in helix VIII of rhodopsin and the cytoplasmic end of helix VI, but do not map to the QQE sequence of the C-3 loop that is a prime epitope determinant of mAbs we have mapped so far with an MI preference.
Figure 6.

Selected antirhodopsin antibody consensus epitopes for mAbs with preference for metarhodopsin II, mapped to the cytoplasmic face of the dark rhodopsin X-ray structure. See Figure 4 ▶ legend for explanation of the color scheme and other relevant details.(A, B) Views of two different mappings of the mAb K16-111C consensus peptide, WAPEVMGPL. (A) WAPEVMGPL mapped on rhodopsin residues as VAPNVMGPL (mapping 1 for this mAb from Table 4). (B) WAPEVMGPL mapped on rhodopsin residues as AAAEVMGPL (mapping 3 for this mAb from Table 4). (C, D) Views of two different mappings of the mAb K16-155C consensus peptide, RSEAEMVAP. (C) RSEAEMVAP mapped on rhodopsin residues as KAEKEMVAP (mapping 1 for this mAb from the Supplemental Material). (D) RSEAEMVAP mapped on rhodopsin residues as RTEKEMVAP (mapping 3 for this mAb from the Supplemental Material).
Representative mappings of the K16-111C consensus sequence, WAPEVMGPL (Fig. 6A,B; Table 4; K16-111C mappings 1 and 3), contain the same inverted GLP sequence that was apparently recognized by K42-41L on the C-terminal of rhodopsin. Many high-scoring K16-111C mappings, including both of the ones shown in Figure 6 ▶ also contain an MV motif mapped to Met 317 Val 318, which is a unique dipeptide sequence in the recently discovered eighth helix of rhodopsin (Palczewski et al. 2000). Interestingly, the GLP and MV motifs are already close together in the dark-adapted rhodopsin structure, but they may become more accessible to antibody binding by structural changes. There are several pieces of evidence that there are light-induced conformational changes in this region of rhodopsin (Dunham and Farrens 1999; Hubbell et al. 2000; Altenbach et al. 2001; Mielke et al. 2002). Peptides selected by K16-111C have a strongly conserved (W/V)AP motif, which appears to correspond to V345 A346 P347 near the end of the C-terminal tail, as illustrated in the mapping of WAPEVMGPL to VAPNVMGPL in Figure 6A ▶. This epitope implies the proximity of the extreme C-tail region of rhodopsin, parts of the VIII helix, and a region of the C-tail of rhodopsin centered around residues 327–329 in MII.
Figure 6 ▶, C and D, shows two of the best-scoring mappings of the mAb K16-155C consensus peptide RSEAEM VAP to the cytoplasmic face of rhodopsin. In Figure 6C ▶, RSEAEMVAP is mapped to rhodopsin as KAEKEMVAP (Supplemental Material K16-155C mapping 5), and in Figure 6D ▶, RSEAEMVAP is mapped to rhodopsin as RTEKEM VAP (Supplemental Material K16-155C mapping 9). Similar to mAb K16-111C, K16-155C has two consensus peptides that contain a strongly conserved VAP (or VPA). FINDMAP also finds mappings of this sequence to V345 A346 P347 near the end of the C-terminal tail. The K16-155C consensus peptides RSEAEMVAP and VSWGDMVPA contain an MV motif that overlaps the VAP or VPA motif. The K16-111C consensus peptide, WAPEVMGPL, contains this same MV motif. Because of the overlap in the K16-155C consensus peptide, RSEAEMVAP has high-scoring FINDMAP mappings that are split between Val 318 (as in Fig. 5C,D ▶), and Val 345 (Supplemental Material K16-155C mappings 2 through 4 and 7) in the C terminus. All the highest scoring FINDMAP mappings of the K16-155C consensus peptide RSEAEMVAP use several residues on the extreme C-terminal side of the C-3 loop of rhodopsin and on the N-terminal end of helix VI (residues 245–254 near the lipid-water interface), as shown in Supplemental Material I mappings 4–10 of K16-155C. This was not something we noticed by manual mapping (Supplemental Material I K16-155C mappings 1–3), but the FINDMAP substitution scores are generally high (73%–89%). Most of the FINDMAP runs excluded access to regions deep in the membrane (not highlighted in Fig. 1 ▶) to speed up the analysis. When FINDMAP was given access to residues deeper in the membrane, K16-155C often mapped to Met 253 Val 254 or Met 257 Val 258 in helix VI, as is shown in Table 4 for the K16-155C mappings 11 and 12. For example, mapping 11 found a largely linear epitope on the cytoplasmic end of helix VI as one of the high-scoring mappings: Lys 245 Ala 246 Glu 247 Lys 248 Glu 249 gap Met 253 Val 254 gap Ala 346 Pro 347. Mapping 13 for K16-155C has a slightly higher substitution score (89%) and uses Met 257 Val 258.
To fit within the size of an antibody-combining site, rearrangements to the dark-adapted rhodopsin structure are required to make the antibody epitopes in Figure 5 ▶ (MI-preference mAbs) and Figure 6 ▶ (MII-preference mAbs) more compact. The antibody imprinting data in the present work implies that the C-3 loop folds closer to the C-1 loop in the MI conformation and that a segment of the C-terminal tail folds closer to the C-3 loop. In the MII conformation, a substantial rearrangement of the C-terminal tail is implied as well as reorganization of the structure around the cytoplasmic end of helix VI and a portion of helix VIII. It seems likely from the results that in the active conformations of MII, the C-terminal tail moves to expose portions of the C-3 loop, the cytoplasmic (N-terminal end) of helix VI, and the Met 317 Val 318 side of helix VIII, and it is reasonable to propose that these changes give access to the G protein. Helix movements are also likely to be involved in increased access to the cytoplasmic end of helix VI.
Many aspects of this work agree qualitatively with a number of prior studies conducted, using a wide range of approaches. Conformational changes in the cytoplasmic end of helix VI have been implicated in the specificity of G-protein coupling by site-specific mutagenesis (Kostenis et al. 1997). The residues found to be essential for the specificity of G-protein coupling in m2 muscarinic receptors correspond to residues in helix VI that are mapped to the K16-155C epitope or adjacent residues (Supplemental Material K16-155C mappings 11 and 12). Changes in the helix VIII region have been implicated in MII formation by Abdulaev and Ridge (1998), and the C-terminal tail near helix VIII has also been implicated in the interaction with transducin (Ernst et al. 2000b). More detailed structural information may be inferred by using the presently available antibodies by studying the conformation of the consensus epitopes when they are bound to their mAbs, by co-crystallization and X-ray crystallography on the Fab-peptide complexes or transferred NOESY NMR on the mAb–peptide complexes (Burritt et al. 1998). Additional mAbs are being actively sought to provide additional data to develop detailed model of the light-excited conformations of rhodopsin (T. Dugger, E.A. Angel, P.A. Dratz, and D. Hargrave, unpubl.).
An important consideration is whether the antibodies recognize endogenous conformational epitopes on the surface of proteins, or whether the target protein undergoes an induced fit in which the antibody complex captures one possible conformation of the protein surface. Examination of structural differences between free protein and Fab–protein complexes, in which both have known X-ray structures, indicates that in all cases investigated there were only very small changes in surface structure upon antibody binding. The maximum conformational changes were small loop movements up to a maximum of 1.5 Å or limited rotation of surface side-chains in the region of the protein bound by antibody (Janin and Chothia 1990; Davies and Cohen 1996; Conte et al. 1999). As with any structural approach applied to proteins, there is greater uncertainty in defining areas of higher flexibility. Epitope flexibility can be accommodated in the antibody imprinting method by obtaining a number of antibodies that are directed toward a similar region of the antigen surface, as these may recognize different loop conformations. Structural flexibility in the target protein would be implicated if different mAb epitopes map to somewhat different target conformations. Because antibodies have a bias toward immunodominant regions of the surface of a protein, which tend to be more exposed and possibly flexible regions, there may be a rough "natural" correlation between the number of mAbs necessary to define a protein region and the percentage of mAbs in a panel of antibodies against that region.
Conclusions
The purpose of this study was to apply the previously described antibody imprinting technique (Burritt et al. 1998; Jesaitis et al. 1999) to the prototype GPCR protein, rhodopsin, to seeking insight into the poorly defined structures of the cytoplasmic loops in the dark-adapted structure and the structural changes that occur in light-excited rhodopsin. The mAbs investigated that showed no preference for MI or MII (B1GN) or little preference (4B4) map in relatively tight patterns onto the dark-adapted rhodopsin structure, consistent with little or no structural change in these regions after light excitation. In contrast, the mAbs that prefer the MI or MII conformations show much more delocalized mappings onto the dark-adapted structure, which is consistent with significant structural changes that rearrange the structure to assemble different, more compact antibody epitopes during the formation of the light-excited conformations. MAbs that reduced the extra-MII signal (K16-40L and K42-41L) were both directed against epitopes containing portions of the C-3 loop of rhodopsin. Those mAbs that increased the MII signal (K16-111C and K16-155C) were directed against epitopes with large contributions of the cytoplasmic end of helix VI, part of the helix VIII, and the C-terminal of rhodopsin, indicating that these regions are differently exposed between MI or MII.
This study used all of the IgG mAbs against the cytoplasmic face of rhodopsin that are in the literature and still obtainable. Additional mAbs are being sought so that a larger network of distance proximity constraints for each photo-intermediate can be built. It would be desirable if overlapping patches on the surfaces of different photo-states of rhodopsin could be epitope-mapped to define the structures with increasing clarity. To complete the antibody imprinting process, X-ray crystallography and NMR (Burritt et al. 1998) are being used to determine the 3D folding of the epitope peptides when they are bound to the Fabs that they were selected against. The antibody imprint technique should be applicable to studies of a broad range of proteins that have previously been difficult to investigate structurally, if panels of mAbs can be obtained against different features of the protein surfaces.
Materials and methods
Materials
Hybridoma lines expressing murine antirhodopsin mAbs were made in the Hargrave laboratory (Adamus et al. 1991) or obtained from Dr. Robert Molday (University of British Columbia; MacKenzie and Molday 1982). Standard hybridoma growth methodologies in 10% fetal bovine serum were used. Antibodies were purified from the cell supernatant with GammaBind Plus Sepharose (Pharmacia Biotech), eluted with 100 mM glycine and 0.15 M NaCl (pH 2.5), and neutralized with 1 M Tris. Antirhodopsin activity was confirmed by ELISA assays against rhodopsin coated to polystyrene titer plate wells. Lyophilized TM7C mAb (Abdulaev and Ridge 1998) was obtained from Dr. Kevin Ridge (Center for Advanced Research in Biotechnology). The J404 phage library, expressed on the pIII tail protein of M13 bacteriophage is described elsewhere (Burritt et al. 1996).
Phage display techniques
Phage display selection and amplification using the J404 phage-displayed random peptide library is described elsewhere (Burritt et al. 2001). Phage from the third round of phage selection were titrated via log serial dilutions in LB medium. Plates with phage dilutions resulting in ∼300 –1000 isolated plaques per plate were used for picking individual phage clones. Individual phage clones were picked from isolated plaques, added to 2 mL of 2XYT media supplemented with 75 μg/mL kanamycin, and grown for DNA sequencing of the peptide insert as previously described (Burritt et al. 1998). Phage clones for some mAbs were subjected to plaque lift assays (Burritt et al. 1998) or ELISA to correlate phage clone affinity to the amino acid sequence of the displayed peptide. Single-stranded phage DNA was isolated, subjected to PCR by using the ABI BigDye Terminator kit version 2.0 (PE Applied Biosystems), and sequenced by the automated capillary method.
Extra meta-II assays
Rod outer segments were prepared from frozen bovine retinae under dim red light by using a sucrose gradient procedure (Papermaster 1982). Hypotonically stripped disk membranes were prepared from rod outer segments by two consecutive extractions with low salt buffer as described (Bauer 1988) and stored in 20 mM BTP (pH 7.5), 130 mM NaCl, and 1 mM MgCl2. Rhodopsin concentration was determined after solubilization in 2% lauryldimethylamine oxide (LDAO) based on its absorption spectrum by using ɛ500 = 40,000 M−1cm−1. Rod outer segments were slightly sonicated in the dark just prior to use. Fabs were made from intact IgG mAbs via enzymatic digestion with ficin, using the ImmunoPure IgG1 Fab and F(ab’)2 Preparation Kit (Pierce) to prevent aggregation of mAbs and membranes during assays. Fab yields were quantified based on their absorption at 280 nm, using a value of 1.50 = 1 mg/mL. Transducin (Gt) was purified from bovine retinae as described (Heck and Hofmann 1993) and stored in 20 mM BTP (pH 7.1), 130 mM NaCl, 1 mM MgCl2, and 2 mM DTT. Samples in buffer (100 mM HEPES at pH 8.0, 50 mM NaCl, 1 mM MgCl2, 1 mM EDTA, and 1 mM DTT) contained 10 μM dark rhodopsin, Fab (varying concentrations) with or without either 2 μM transducin or a transducin mimetic peptide (varying concentrations). Control samples in buffer contained 10 μM dark-adapted rhodopsin and either 2 μM transducin or a transducin mimetic peptide (varying concentrations). Baseline control samples in buffer contained 10 μM dark rhodopsin. Accumulation of extra MII was monitored by time-resolved UV/Vis spectroscopy using a dual wavelength spectrophotometer (Shimadzu UV300). Recorded traces represent readings of a 380- to 417-nm absorbance difference (Ernst et al. 2000; Pulvermüller et al. 1997). Measurements were performed at 4°C (pH 8.0), at which [MII] / ([MI] + [MII]) ≅ 0.1 (Parkes et al. 1999). Cuvette path length was 2 mm. In each assay, ∼12 % of rhodopsin was flash-activated by 500 ± 20-nm light. The same batch of rhodopsin was used for all samples in a given experiment. Transducin-mimetic peptides were synthesized by using standard FMOC procedures, characterized by HPLC and MALDI mass spectrometry, and were lyophilized and stored dry until use (Ernst et al. 2000). Amino acid sequences of transducin-mimetic peptides are as follows: Gtα(340–350), IKENLKDCGLF (Hamm et al. 1988); Gtα(340–350) high-affinity analog peptide, VLEDLKSCGLF (Martin et al. 1996); and Gtγ(50–71)farnesyl, EDPLVKGIPEDKNPFKELKGGC-farnesyl (Kisselev et al. 1994).
Isothermal titration calorimetry
ITC assays were performed with a VP-ITC instrument (MicroCal, Inc.) at 30°C in 120 mM NaCl, 2.7 mM KCl, and 10 mM phosphate (pH 7.4) buffer; 7 μM K42-42L was loaded into the sample cell with a volume of 1.44 mL and titrated with either 1000 μM TGALQERSK or 500 μM TGPLQEREQ, using 5 μL per injection, 3.5 min per injection, 310 rpm stirring, a 10-sec injection duration, and a 2-sec noise filter. The raw ITC data, showing the evolved heat after each injection of a peptide aliquot, were integrated and analyzed by using the Origin software package (Microcal Software, Inc). The data were fit with the assumption of a 2:1 stoichiometry between peptide and mAb. Values were calculated for binding enthalpy (ΔHb), entropy of binding (ΔS), and binding constant (K) with Origin.
Rhodopsin modeling
The 1HZX rhodopsin X-ray structure coordinates (Teller et al. 2001) used in this investigation are available from the RCSB PDB (Berman et al. 2000). A separate Pdb file containing chain A and its four interior waters was created and loaded into Swiss-PdbViewer (Guex and Peitsch 1997). The "Add residue" and "Mutate" commands were used to build the missing residues Gln 236 to Ser 240. φ-ξ-Angles were adjusted by using the Ramachandran window until Ser 240 was well oriented relative to Ala 241, and the "Ligate" function was used to close the chain. Missing residues Asp 331 to Ala 333 were added in the same manner. The resulting structure was inserted into an explicit dimyristoylphosphatidylcholine lipid bilayer using utilities in CHARMm (version 26; Mackerell et al. 1998), and a shell of explicit water was added to the structure. Energy minimization was done with CHARMm by 1000 adapted basis Newton Raphson iterations, using a nonbonded interaction cutoff of 10 Å, no electrostatic cutoff, and a dielectric constant of unity. The Cα RMSD between the before and after energy-minimized structures was 0.78 Å.
Phage clone mapping and epitope visualization
A total of 473 readable phage clone peptide sequence were obtained by using the J404 phage library against a total of nine antirhodopsin mAbs as follows: K16-50C (35), K16-107 (50), K16-111C (30), K16-155C (44), K42-41L (90 with J404), K60-46L (47), B1gN (23), TM7C (72), and 4B4 (39). All sequences for a particular mAb and phage library combination were first manually inspected and aligned visually, based on recurring sequence motifs. The MIME algorithm (Bailey and Elkan 1994) was used to determine multiple alignments in cases in which the alignment was not obvious by manual inspection.
Consensus peptide sequences were mapped to the rhodopsin primary sequence manually or with FINDMAP, as described in the text. Some consensus sequences of some of the mAbs could not be mapped by inspection, due to a nonobvious complex epitope (K60-46 GRLPPRQQD and EPKWWRVKQ, K42-41L C-SAGERQESRE-C and TAAELQEGEG, TM7C WIMPTGGWY and YQTPIGGWY, and K16-107C GKALVND). The details of the method of mapping consensus peptides with FINDMAP is described in more detail elsewhere (Mumey et al. 2002, 2003). Images of the best manual and FINDMAP mappings were created using Swiss-PdbViewer (Guex and Peitsch 1997) and rendered with POV-Ray for Windows.
Acknowledgments
We thank Dr. Robert Molday (University of British Columbia) for the gift of the cell line producing 4B4, Dr. Kevin Ridge (Center for Advanced Research in Biotechnology) for the gift of lyophilized TM7C, Dr. Norman Lee and The Institute for Genomic Research (TIGR) for initial high-throughput sequencing of K42-41L phage clones, and Peter Henklein (Charité Berlin) for synthesis of transducin-mimetic peptides. At MSU we thank Rich Barry for isoelectric focusing and two-dimensional characterization of Fabs, and Mary Bateson, Connie McDonald, Erinn Ayers, Cory Crawford, Jana Pfeifle, and Sean Thurston for assistance with phage clone selection or DNA sequencing. This work was supported in part by NIH grant GM062547 (to E.A.D.), Deutsche Forchungsgemeinschaft Sfb 449 (to K.P.H.), and NIH grants EY06225, EY06226, and EY08571 (to P.A.H). P.A.H. is a Senior Scientific Investigator, Research to Prevent Blindness, and is supported by an institutional grant to the University of Florida Department of Ophthalmology from Research to Prevent Blindness. The publication costs of this article were defrayed in part by payment of page charges. This article must therefore be hereby marked "advertisement" in accordance with 18 USC section 1734 solely to indicate this fact.
Abbreviations
CDR, complementary determining regions on an antibody
CNBr, cyanogen bromide
DTT, dithiothreitol
EDTA, ethylenediaminetetraacetic acid
ELISA, enzyme-linked immunosorbent assay
Fab, fragment antibody-binding domain
FTIR, Fourier transform infrared
GPCR, G protein–coupled receptor
IgG, Immunoglobulin G
ITC, isothermal titration calorimetry
LB, Luria-Bertani broth
mAb, monoclonal antibody
MI, metarhodopsin I
MII, metarhodopsin II
NOESY NMR, nuclear Overhauser effect spectroscopy nuclear magnetic resonance
PBS, phosphate buffered saline
PFU, plaque forming unit
SDS-PAGE, sodium dodecyl sulfate–polyacrylamide gel electrophoresis
Article and publication are at http://www.proteinscience.org/cgi/doi/10.1110/ps.03233703.
References
- Abdulaev, N.G. and Ridge, K.D. 1998. Light-induced exposure of the cytoplasmic end of transmembrane helix seven in rhodopsin. Proc. Natl. Acad. Sci. 95 12854–12859. [DOI] [PMC free article] [PubMed] [Google Scholar]
- Adamus. G., Zam, Z.S., Arendt, A., Palczewski, K., McDowell, J.H., and Hargrave, P.A. 1991. Anti-rhodopsin monoclonal antibodies of defined specificity: Characterization and application. Vision Res. 31 17–31. [DOI] [PubMed] [Google Scholar]
- Altenbach, C., Klein-Seetharaman, J., Cai, K., Khorana, H.G., and Hubbell, W.L. 2001. Structure and function in rhodopsin: Mapping light-dependent changes in distance between residue 316 in helix 8 and residues in the sequence 60–75, covering the cytoplasmic end of helices TM1 and TM2 and their connection loop CL1. Biochemistry 40 15493–15500. [DOI] [PubMed] [Google Scholar]
- Arnis, S. and Hofmann, K.P. 1993. Two different forms of metarhodopsin II: Schiff base deprotonation precedes proton uptake and signaling state. Proc. Natl. Acad. Sci. 90 7849–7853. [DOI] [PMC free article] [PubMed] [Google Scholar]
- Atallah, M.J. 1999. Algorithms and theory of computation handbook. CRC Press, Boca Raton, FL.
- Bailey, T.L. and Elkan, C. 1994. Fitting a mixture model by expectation maximization to discover motifs in biopolymers. In Proceedings of the Second International Conference on Intelligent Systems for Molecular Biology, pp.28–36. AAAI Press, Menlo Park, CA. [PubMed]
- Barbas, C.F., ed. 2001. Phage display: A laboratory manual. Cold Spring Harbor Laboratory Press, Cold Spring Harbor, NY.
- Bauer, P.J. 1988. Evidence for two functionally different membrane fractions in bovine retinal rod outer segments. J. Physiol. 401 309–327. [DOI] [PMC free article] [PubMed] [Google Scholar]
- Benjamin, D.C. 1995. B-cell epitopes: Fact and fiction. Adv. Exp. Med. Biol. 386 95–108. [DOI] [PubMed] [Google Scholar]
- Berman, H.M., Westbrook, J., Feng, Z., Gilliland, G., Bhat, T.N., Weissig, H., Shindyalov, I.N., and Bourne, P.E. 2000. The Protein Data Bank. Nucleic Acids Res. 28 235–242. [DOI] [PMC free article] [PubMed] [Google Scholar]
- Birkenmeier, G., Osman, A.A., Kopperschlager, G., and Mothes, T. 1997. Epitope mapping by screening of phage display libraries of a monoclonal antibody directed against the receptor binding domain of humanα2-macroglobulin. FEBS Lett. 416 193–196. [DOI] [PubMed] [Google Scholar]
- Bordo, D. and Argos, P. 1991. Suggestions for "safe" residue substitutions in site-directed mutagenesis. J. Mol. Biol. 217 721–729. [DOI] [PubMed] [Google Scholar]
- Burritt, J.B., Quinn, M.T., Jutila, M.A., Bond, C.W., and Jesaitis, A.J. 1995. Topological mapping of neutrophil cytochrome b epitopes with phage-display libraries. J. Biol. Chem. 270 16974–16980. [DOI] [PubMed] [Google Scholar]
- Burritt, J.B., Bond, C.W., Doss, K.W., and Jesaitis, A.J. 1996. Filamentous phage display of oligopeptide libraries. Anal. Biochem. 238 1–13. [DOI] [PubMed] [Google Scholar]
- Burritt, J.B., Busse, S.C., Gizachew, D., Dratz, E.A., and Jesaitis, A.J. 1998. Antibody imprint of a membrane protein surface: Phagocyte flavocytochrome B. J. Biol. Chem. 273 24847–24852. [DOI] [PubMed] [Google Scholar]
- Burritt, J.B., Fritel, G.N., Dahan, I., Pick, E., Roos, D., and Jesaitis, A.J. 2000. Epitope identification for human neutrophil flavocytochrome b monoclonals 48 and 449. Eur. J. Haematol. 65 407–413. [DOI] [PubMed] [Google Scholar]
- Burritt, J.B., Deleo, F.R., McDonald, C.L., Prigge, J.R., Dinauer, M.C., Nakamura, M., Nauseef, W.M., and Jesaitis, A.J. 2001. Phage display epitope mapping of human neutrophil flavocytochrome b558: Identification of two juxtaposed extracellular domains. J. Biol. Chem. 276 2053–2061. [DOI] [PubMed] [Google Scholar]
- Cabilly, S. 1999. The basic structure of filamentous phage and its use in the display of combinatorial peptide libraries. Mol. Biotechnol. 12 143–148. [DOI] [PubMed] [Google Scholar]
- Cai, K., Itoh, Y., and Khorana, H.G. 2001. Mapping of contact sites in complex formation between transducin and light-activated rhodopsin by covalent crosslinking: Use of a photoactivatable reagent. Proc. Natl. Acad. Sci. 98 4877–4882. [DOI] [PMC free article] [PubMed] [Google Scholar]
- Chen, Y.C., Delbrook, K., Dealwis, C., Mimms, L., Mushahwar, I.K., and Mandecki, W. 1996. Discontinuous epitopes of hepatitis B surface antigen derived from a filamentous phage peptide library. Proc. Natl. Acad. Sci. 93 1997–2001. [DOI] [PMC free article] [PubMed] [Google Scholar]
- Clore, G.M., Robien, M.A., and Gronenborn, A.M. 1993. Exploring the limits of precision and accuracy of protein structures determined by nuclear magnetic resonance spectroscopy. J. Mol. Biol. 231 82–102. [DOI] [PubMed] [Google Scholar]
- Conte, L.L., Chothia, C., and Janin, J. 1999. The atomic structure of protein–protein recognition sites. J. Mol. Biol. 285 2177–2198. [DOI] [PubMed] [Google Scholar]
- Cwirla, S.E., Peters, E.A., Barrett, R.W., and Dower, W.J. 1990. Peptides on phage: A vast library of peptides for identifying ligands. Proc. Natl. Acad. Sci. 87 6378–6382. [DOI] [PMC free article] [PubMed] [Google Scholar]
- Dall’Acqua, W., Goldman, E.R., Lin, W., Teng, C., Tsuchiya, D., Li, H., Ysern, X., Braden, B.C., Li, Y., Smith-Gill, S.J., et al. 1998. A mutational analysis of binding interactions in an antigen-antibody protein–protein complex. Biochemistry 37 7981–7991. [DOI] [PubMed] [Google Scholar]
- Dandekar, T. and Argos, P. 1997. Applying experimental data to protein fold prediction with the genetic algorithm. Protein Eng. 10 877–893. [DOI] [PubMed] [Google Scholar]
- Davies, D.R. and Cohen, G.H. 1996. Interactions of protein antigens with antibodies. Proc. Natl. Acad. Sci. 93 7–12. [DOI] [PMC free article] [PubMed] [Google Scholar]
- Dayhoff, M.O., Schwartz, R.M., and Orcutt, B.C. 1978. A model of evolutionary change in proteins. In Atlas of protein sequence and function, pp. 345–352. Nat. Biomed. Research Foundation, Washington, DC.
- Demangel, C., Maroun, R.C., Rouyre, S., Bon, C., Mazie, J.C., and Choumet, V. 2000. Combining phage display and molecular modeling to map the epitope of a neutralizing antitoxin antibody. Eur. J. Biochem. 267 2345–2353. [DOI] [PubMed] [Google Scholar]
- Dratz, E.A., Furstenau, J.E., Lambert, C.G., Thireault, D.L., Rarick, H., Schepers, T., Pakhlevaniants, S., and Hamm, H.E. 1993. NMR structure of a receptor-bound G-protein peptide. Nature 363 276–281. [DOI] [PubMed] [Google Scholar]
- Dunham, T.D. and Farrens, D.L. 1999. Conformational changes in rhodopsin: Movement of helix f detected by site-specific chemical labeling and fluorescence spectroscopy. J. Biol. Chem. 274 1683–1690. [DOI] [PubMed] [Google Scholar]
- Emeis, D. and Hofmann, K.P. 1981. Shift in the relation between flash-induced metarhodopsin I and metarhodopsin II within the first 10% rhodopsin bleaching in bovine disc membranes. FEBS Lett. 136 201–207. [DOI] [PubMed] [Google Scholar]
- Ernst, O.P., Bieri, C., Vogel, H., and Hofmann, K.P. 2000a. Intrinsic biophysical monitors of transducin activation: fluorescence, UV-visible spectroscopy, light scattering, and evanescent field techniques. Meth. Enzymol. 315 471–489. [DOI] [PubMed] [Google Scholar]
- Ernst, O.P., Meyer, C.K., Marin, E.P., Henklein, P., Fu, W.Y., Sakmar, T.P., and Hofmann, K.P. 2000b. Mutation of the fourth cytoplasmic loop of rhodopsin affects binding of transducin and peptides derived from the carboxyl-terminal sequences of transducin α and γ subunits. J. Biol. Chem. 275 1937–1943. [DOI] [PubMed] [Google Scholar]
- Gether, U. and Kobilka, B.K. 1998. G protein–coupled receptors, II: Mechanism of agonist activation. J. Biol. Chem. 273 17979–17982. [DOI] [PubMed] [Google Scholar]
- Guex, N. and Peitsch, M.C. 1997. SWISS-MODEL and the Swiss-PdbViewer: An environment for comparative protein modeling. Electrophoresis 18 2714–2723. [DOI] [PubMed] [Google Scholar]
- Hamm, H.E., Deretic, D., Arendt, A., Hargrave, P.A., Koenig, B., and Hofmann, K.P. 1988. Site of G protein binding to rhodopsin mapped with synthetic peptides from the α subunit. Science 241 832–835. [DOI] [PubMed] [Google Scholar]
- Heck, M. and Hofmann, K.P. 1993. G-protein–effector coupling: A real-time light-scattering assay for transducin–phosphodiesterase interaction. Biochemistry 32 8220–8227. [DOI] [PubMed] [Google Scholar]
- Heiskanen, T., Lundkvist, A., Soliymani, R., Koivunen, E., Vaheri, A., and Lankinen, H. 1999. Phage-displayed peptides mimicking the discontinuous neutralization sites of Puumala hantavirus envelope glycoproteins. Virology 262 321–332. [DOI] [PubMed] [Google Scholar]
- Henikoff, S. and Henikoff, J.G. 2000. Amino acid substitution matrices. Adv. Protein Chem. 54 73–97. [DOI] [PubMed] [Google Scholar]
- Hofmann, K.P. 1999. Signalling states of photoactivated rhodopsin. Novartis Found. Symp. 224 158–175. [DOI] [PubMed] [Google Scholar]
- ———. 2000. Late photoproducts and signaling states of bovine rhodopsin. In Molecular mechanism in visual transduction (eds. D.G. Stavenga, et al.), pp. 91–142. Elsevier.
- Horn, F., Weare, J., Beukers, M.W., Horsch, S., Bairoch, A., Chen, W., Edvardsen, O., Campagne, F., and Vriend, G. 1998. GPCRDB: An information system for G protein–coupled receptors. Nucleic Acids Res. 26 275–279. [DOI] [PMC free article] [PubMed] [Google Scholar]
- Hubbell, W.L., Cafiso, D.S., and Altenbach, C. 2000. Identifying conformational changes with site-directed spin labeling. Nat. Struct. Biol. 7 735–739. [DOI] [PubMed] [Google Scholar]
- Itoh, Y., Cai, K., and Khorana, H.G. 2001. Mapping of contact sites in complex formation between light-activated rhodopsin and transducin by covalent crosslinking: Use of a chemically preactivated reagent. Proc. Natl. Acad. Sci. 98 4883–4887. [DOI] [PMC free article] [PubMed] [Google Scholar]
- Jager, S., Szundi, I., Lewis, J.W., Mah, T.L., and Kliger, D.S. 1998. Effects of pH on rhodopsin photointermediates from lumirhodopsin to metarhodopsin II. Biochemistry 37 6998–7005. [DOI] [PubMed] [Google Scholar]
- Janin, J. and Chothia, C. 1990. The structure of protein–protein recognition sites. J. Biol. Chem. 265 16027–16030. [PubMed] [Google Scholar]
- Jesaitis, A.J., Gizachew, D., Dratz, E.A., Siemsen, D.W., Stone, K.C., and Burritt, J.B. 1999. Actin surface structure revealed by antibody imprints: Evaluation of phage-display analysis of anti-actin antibodies. Protein Sci. 8 760–770. [DOI] [PMC free article] [PubMed] [Google Scholar]
- Kisselev, O.G., Ermolaeva, M.V., and Gautam, N. 1994. A farnesylated domain in the G protein γ subunit is a specific determinant of receptor coupling. J. Biol. Chem. 269 21399–21402. [PubMed] [Google Scholar]
- Kisselev, O.G., Meyer, C.K., Heck, M., Ernst, O.P., and Hofmann, K.P. 1999. Signal transfer from rhodopsin to the G protein: Evidence for a two-site sequential fit mechanism. Proc. Natl. Acad. Sci. 96 4898–4903. [DOI] [PMC free article] [PubMed] [Google Scholar]
- Koscielska, K., Kiczak, L., Kasztura, M., Wesolowska, O., and Otlewski, J. 1998. Phage display of proteins. Acta Biochim. Pol. 45 705–720. [PubMed] [Google Scholar]
- Kostenis, E., Conklin, B.R., and Wess, J. 1997. Molecular basis of receptor/G protein coupling selectivity studied by coexpression of wild type and mutant m2 muscarinic receptors with mutant G α(q) subunits. Biochemistry 36 1487–1495. [DOI] [PubMed] [Google Scholar]
- Luzzago, A., Felici, F., Tramontano, A., Pessi, A., and Cortese, R. 1993. Mimicking of discontinuous epitopes by phage-displayed peptides, I: Epitope mapping of human H ferritin using a phage library of constrained peptides. Gene 128 51–57. [DOI] [PubMed] [Google Scholar]
- MacKenzie, D. and Molday, R.S. 1982. Organization of rhodopsin and a high molecular weight glycoprotein in rod photoreceptor disc membranes using monoclonal antibodies. J. Biol. Chem. 257 7100–7105. [PubMed] [Google Scholar]
- Mackerell Jr., A.D., Bashford, D., Bellot, M., Dunbrack Jr., R.L., Evanseck, J.D., Field, M.J., Fischer, S., Gao, J., Guo, H., Ha, S., et al. 1998. All-atom empirical potential for molecular modeling and dynamics studies of proteins. J. Phys. Chem. B 102 3586–3616. [DOI] [PubMed] [Google Scholar]
- Martin, E.L., Rens-Domiano, S., Schatz, P.J., and Hamm, H.E. 1996. Potent peptide analogues of a G protein receptor-binding region obtained with a combinatorial library. J. Biol. Chem. 271 361–366. [DOI] [PubMed] [Google Scholar]
- Mielke, T., Alexiev, U., Glaesel, M., Otto, H., and Heyn, M.P. 2002. Light-induced changes in the structure of the cytoplasmic loops of rhodopsin in the activated MII state. Biochemistry 41 7875–7884. [DOI] [PubMed] [Google Scholar]
- Morris, G.E., Sedgwick, S.G., Ellis, J.M., Pereboev, A., Chamberlain, J.S., and Nguyent, M. 1998. An epitope structure for the C-terminal domain of dystrophin and utrophin. Biochemistry 31 11117–11127. [DOI] [PubMed] [Google Scholar]
- Moshitch-Moshkovitz, S., Heldman, Y., Yayon, A., and Katchalski-Katzir, E. 2000. Sorting polyclonal antibodies into functionally distinct fractions using peptide phage display: "A library on top of a library." J. Immunol. Meth. 242 183–191. [DOI] [PubMed] [Google Scholar]
- Mumey, B.M., Bailey, B.W., and Dratz, E.A. 2002. Revealing protein structures: A new method for mapping antibody epitopes. Proceedings of the Sixth Annual International Conference on Computational Molecular Biology (RECOMB-02), pp. 233–240. ACM Press, New York.
- Mumey, B.M., Bailey, B.W., Kirkpatrick, B., Jesaitis, A.J., Angel, T., and Dratz, E.A. 2003. A new method for mapping discontinuous antibody epitopes to reveal structural features of proteins. J. Comput. Biol. 10 555–567. [DOI] [PubMed] [Google Scholar]
- Okada, T., Ernst, O.P., Palczewski, K., and Hofmann, K.P. 2001. Activation of rhodopsin: New insights from structural and biochemical studies. Trends Biochem. Sci. 26 318–324. [DOI] [PubMed] [Google Scholar]
- Orlandi, R., Formantici, C., Menard, S., Boyer, C.M., Wiener, J.R., and Colnaghi, M. 1997. A linear region of a monoclonal antibody conformational epitope mapped on p185HER2 oncoprotein. J. Biol. Chem. 378 1387–1392. [DOI] [PubMed] [Google Scholar]
- Padlan, E.A. 1996. X-ray crystallography of antibodies. Adv. Protein Chem. 49 57–133. [DOI] [PubMed] [Google Scholar]
- Palczewski, K., Kumasaka, T., Hori, T., Behnke, C.A., Motoshima, H., Fox, B.A., Le, T.I., Teller, D.C., Okada, T., Stenkamp, R.E., et al. 2000. Crystal structure of rhodopsin: A G protein–coupled receptor. Science 289 739–745. [DOI] [PubMed] [Google Scholar]
- Papermaster, D.S. 1982. Preparation of retinal rod outer segments. Meth. Enzymol. 81 48–52. [DOI] [PubMed] [Google Scholar]
- Parkes, J.H., Gibson, S.K., and Liebman, P.A. 1999. Temperature and pH dependence of the metarhodopsin I–metarhodopsin II equilibrium and the binding of metarhodopsin II to G protein in rod disk membranes. Biochemistry 38 6862–6878. [DOI] [PubMed] [Google Scholar]
- Poloni, F., Romagnoli, G., Cianfriglia, M., and Felici, F. 1995. Isolation of antigenic mimics of MDR1-P-glycoprotein by phage-displayed peptide libraries. Int. J. Cancer 61 727–731. [DOI] [PubMed] [Google Scholar]
- Pulvermüller, A., Maretzki, D., Rudnicka-Nawrot, M., Smith, W.C., Palczewski, K., and Hofmann, K.P. 1997. Functional differences in the interaction of arrestin and its splice variant, p44, with rhodopsin. Biochemistry 36 9253–9260. [DOI] [PubMed] [Google Scholar]
- Ravera, M.W., Carcamo, J., Brissette, R., Alam-Moghe, A., Dedova, O., Cheng, W., Hsiao, K.C., Klebanov, D., Shen, H., Tang, P., et al. 1998. Identification of an allosteric binding site on the transcription factor p53 using a phage-displayed peptide library. Oncogene 16 1993–1999. [DOI] [PubMed] [Google Scholar]
- Robinson, P.R., Cohen, G.B., Zhukovsky, E.A., and Oprian, D.D. 1992. Constitutively active mutants of rhodopsin. Neuron 9 719–725. [DOI] [PubMed] [Google Scholar]
- Sachs, K., Maretzki, D., Meyer, C.K., and Hofmann, K.P. 2000. Diffusible ligand all-trans-retinal activates opsin via a palmitoylation-dependent mechanism. J. Biol. Chem. 275 6189–6194. [DOI] [PubMed] [Google Scholar]
- Sakmar, T.P. 1998. Rhodopsin: A prototypical G protein–coupled receptor. Prog. Nucleic Acid Res. Mol. Biol. 59 1–34. [DOI] [PubMed] [Google Scholar]
- Scott, J.K. and Smith, G.P. 1990. Searching for peptide ligands with an epitope library. Science 249 386–390. [DOI] [PubMed] [Google Scholar]
- Sidhu, S.S. 2000. Phage display in pharmaceutical biotechnology. Curr. Opin. Biotechnol. 11 610–616. [DOI] [PubMed] [Google Scholar]
- Smith, G.P. and Scott, J.K. 1993. Libraries of peptides and proteins displayed on filamentous phage. Methods Enzymol. 217 228–257. [DOI] [PubMed] [Google Scholar]
- Sundberg, E.J., Urrutia, M., Braden, B.C., Isern, J., Tsuchiya, D., Fields, B.A., Malchiodi, E.L., Tormo, J., Schwarz, F.P., and Mariuzza, R.A. 2000. Estimation of the hydrophobic effect in an antigen-antibody protein–protein interface. Biochemistry 39 15375–15387. [DOI] [PubMed] [Google Scholar]
- Szundi, I., Mah, T.L., Lewis, J.W., Jager, S., Ernst, O.P., Hofmann, K.P., and Kliger, D.S. 1998. Proton transfer reactions linked to rhodopsin activation. Biochemistry 37 14237–14244. [DOI] [PubMed] [Google Scholar]
- Teller, D.C., Okada, T., Behnke, C.A., Palczewski, K., and Stenkamp, R.E. 2001. Advances in determination of a high-resolution three-dimensional structure of rhodopsin, a model of g-protein–coupled receptors (GPCRs). Biochemistry 40 7761–7772. [DOI] [PMC free article] [PubMed] [Google Scholar]
- Vogel, R. and Siebert, F. 2001. Conformations of the active and inactive states of opsin. J. Biol. Chem. 276 38487–38493. [DOI] [PubMed] [Google Scholar]
- Wald, G. 1968. The molecular basis of visual excitation. Nature 219 800–807. [DOI] [PubMed] [Google Scholar]
- Wess, J. ed. 1999. Structure–function analysis of G protein–coupled receptors. Wiley-Liss, New York.
- Williams, S.C., Badley, R.A., Davis, P.J., Puijk, W.C., and Meloen, R.H. 1998. Identification of epitopes within β lactoglobulin recognised by polyclonal antibodies using phage display and PEPSCAN. J. Immunol. Meth. 213 1–17. [DOI] [PubMed] [Google Scholar]
- Yip, Y.L. and Ward, R.L. 1999. Epitope discovery using monoclonal antibodies and phage peptide libraries. Comb. Chem. High Throughput Screen 2 125–138. [PubMed] [Google Scholar]