Abstract
We present MASS (Multiple Alignment by Secondary Structures), a novel highly efficient method for structural alignment of multiple protein molecules and detection of common structural motifs. MASS is based on a two-level alignment, using both secondary structure and atomic representation. Utilizing secondary structure information aids in filtering out noisy solutions and achieves efficiency and robustness. Currently, only a few methods are available for addressing the multiple structural alignment task. In addition to using secondary structure information, the advantage of MASS as compared to these methods is that it is a combination of several important characteristics: (1) While most existing methods are based on series of pairwise comparisons, and thus might miss optimal global solutions, MASS is truly multiple, considering all the molecules simultaneously; (2) MASS is sequence order-independent and thus capable of detecting nontopological structural motifs; (3) MASS is able to detect not only structural motifs, shared by all input molecules, but also motifs shared only by subsets of the molecules. Here, we show the application of MASS to various protein ensembles. We demonstrate its ability to handle a large number (order of tens) of molecules, to detect nontopological motifs and to find biologically meaningful alignments within nonpredefined subsets of the input. In particular, we show how by using conserved structural motifs, one can guide protein–protein docking, which is a notoriously difficult problem. MASS is freely available at http://bioinfo3d.cs.tau.ac.il/MASS/.
Keywords: Multiple structural comparison, nonsequential alignment, nontopological motif, supersecondary structural motif, docking, protein structure classification, large-scale structure comparison
The motivation for enhanced efficient structural alignment methods is quite obvious. It is well established that the function of a protein may be inferred from its 3D structure (Branden and Tooze 1999). Thus, structural homology may imply a similar function. This observation gave rise to the development of structural alignment tools, which are becoming increasingly useful upon the acceleration of protein structure determination and the Structural Genomics project. Structural alignment is a key tool for protein classification, evolutionary relationship studies, and structure prediction using homology modeling or threading.
Many methods have been developed to address the pairwise structural alignment task (for reviews, see Brown et al. 1996; Lemmen and Lengauer 2000; Eidhammer et al. 2001.) In contrast, only a few methods are available for aligning multiple structures. However, it is clear that multiple alignment carries significantly more information, and thus is a much more powerful tool.
Most of the currently available methods for multiple structural alignment are pairwise-based. They find common substructures through a series of comparisons between pairs of molecules. These methods combine a pairwise structural alignment and a heuristic to merge pairwise alignments into a multiple alignment, for example, the center-star and the progressive tree approaches that are widely used in multiple-sequence alignment (Gusfield 1993). A representative example is the method of Gerstein and Levitt (1996). In this approach a central structure is defined as the structure that, on average, is closest to all other structures. Then, a multiple alignment is constructed based on aligning the remaining structures to the central structure. Other well-known methods of this type are SSAPm (Taylor et al. 1994), PrISM (Yang and Honig 2000b), STAMP (Russell and Barton 1992); Sali and Blundell (1990); Ding et al. (1994); May and Johnson (1995); Akutsu and Sim (1999); Guda et al. (2001).
The pairwise-based methods have the limitation that in each pairwise alignment the only available information is about the two molecules involved. Thus, alignments optimal for the whole input set might be missed, if they are not also optimal for every pair (Eidhammer et al. 2001). Our method, MASS, is truly multiple. It considers all the given structures simultaneously, rather than initiating from pairwise alignments. Three other truly multiple methods are Escalier (1988), MUSTA (Leibowitz et al. 2001a,b) and MultiProt (Shatsky et al. 2002). The algorithm of Escalier et al. recursively finds common substructures of increasing size. It combines two common sets of k atoms to build a common set of k + 1 atoms. MUSTA employs Geometric Hashing (Lamdan and Wolfson 1988; Nussinov and Wolfson 1991) to find sets of k atoms, common to the all input molecules, and then extends them into global common substructures. MultiProt is based on short polypeptide fragment alignments. It detects structurally similar common pieces, which are then extended to compute global alignments.
MASS is based on a two-level alignment, using both secondary structure and atomic representation. The rationale behind this approach is that proteins are inherently composed of secondary structure elements (SSEs). These are the regions within a protein that provide its stabilizing scaffold, onto which the functional sites are grafted. Consequently, SSEs are evolutionarily highly conserved while mutations frequently occur at flexible loops, which are more difficult to align. Indeed, SSE representation has been successfully used in several algorithms for pairwise alignment and database searching (Mitchel et al. 1989; Grindley et al. 1993; Holm and Sander 1995; Alesker et al. 1996; Alexandrov and Fischer 1996; Koch et al. 1996; Lu 2000; Yang and Honig 2000a).
Structural description at the secondary structure level conveys both efficiency and accuracy:
Efficiency—the average number of SSEs in a globular protein (∼15) is smaller by 10-fold compared to the average number of residues (∼300). Representing proteins by their SSEs introduces great savings in structural description, compared to residue or atomic representation. As a result, protein structures can be treated more easily and significant improvement in computation can be achieved, especially when many structures are analyzed.
Accuracy and noise filtering—due to the high atom density in protein molecules, any random pair of proteins can be superimposed so that many of their atoms are aligned. However, such an alignment is most probably biologically irrelevant. An SSE-based method avoids this problem and is more likely to detect a motif of biological value, like a fold fingerprint or a common binding site.
The majority of the methods for multiple structure alignment use dynamic programming (Needleman and Wunsch 1970). As a result, they have the disadvantage of being dependent on the sequence order of the polypeptide chain. MASS is a sequence-order independent method. (In the first stage, MASS disregards the order of the SSEs along the polypeptide chain. In the second stage, the backbone order of all Cα atoms is ignored.) Thus, it can find nontopological alignments. Such a capability is essential for detecting common structural motifs that exist due to convergent evolution, but with no fold homology. In certain cases, where order dependency is preferred, there is also an option in MASS to consider the order of the protein amino acids. This option can be used to cluster topologically similar proteins or to obtain a structure-based sequence alignment.
Another important feature of MASS is the ability to detect subset alignments. In addition to finding structural motifs shared by the whole given set of molecules, MASS detects motifs shared by nonpredefined subsets. This capability prevents the loss of good alignments due to structural outliers, and is highly useful in protein classification of heterogenous ensembles.
Here we describe the application of MASS to several types of protein ensembles. We demonstrate that MASS successfully handles difficult cases of multiple structural alignment. These include aligning large-scale protein ensembles (on the order of tens of proteins), detection of nontopological structural motifs, and detection of subset alignments, which is very useful for protein structural classification. We further show how focusing on structurally conserved motifs significantly improves the performance of protein–protein docking, suggesting such an approach as a viable strategy in this extremely difficult problem.
Algorithm
Our goal is to detect structural motifs that are common to a group of proteins. This requirement is more complicated than it appears at first sight. We would like the algorithm to address the following questions: (1) Does the whole input set of proteins share any structural similarity? If so, what is the largest common substructure? (2) Are there additional significant common motifs, apart from the largest one? (3) Are there structural motifs that are shared by only a subset of the input proteins?
Below we will give a more formal statement of the problem, followed by a description of the MASS algorithm. A more detailed technical description followed by a comprehensive runtime complexity analysis can be found in (Dror et al. 2003).
Problem statement
If we represent a protein structure as a set of points in 3D space, where each point is the center of a Cα atom, then the problem can be thought of as a variant of the largest common point set (LCP) problem. In this problem we are given a collection of m sets of 3D points and the task is to detect the largest point set of which a congruent copy appears in each of the input sets. Unfortunately, this problem is known to be NP-hard (Akutsu and Halldorsson 2000).
The LCP formulation above is not suitable for practical applications. It assumes that the positions of all atoms are known precisely and searches for an exact alignment between common substructures. However, for molecular structures, atom positions are not known exactly, and an exact alignment may be impossible to find. Therefore, it is more practical to detect the largest point set of which an almost-congruent copy appears in each of the input sets. Two point sets are said to be almost congruent if the distance between them is below a predefined threshold. One of the most commonly used distance functions is the Root Mean Square Deviation (RMSD; Kaindl and Steipe 1997).
We actually wish to address an even more complicated task. A biologically meaningful motif might not be the largest common substructure. Thus, one will be interested to find smaller common substructures as well. However, in practice, there is no need to detect all possible common substructures. A better approach is to detect the r largest ones, or all common substructures above a certain size.
The task is further complicated by the requirement to detect not only substructures common to the whole given set of molecules, but also substructures shared by nonpredefined subsets of the input molecules (subset alignments). This requirement complicates the problem because the number of subsets is exponential in the number of the input molecules. In addition, the goal should be redefined. It may be impractical to supply the end-user all common substructures for each possible subset of the input molecules. Even outputting just the largest common substructure for each subset may be infeasible. It is better to rank the solutions according to some scoring function and to output the highest scoring ones. However, no one specific scoring function fits all. The reason is that several tradeoffs exist; for example, (1) number of aligned molecules versus core size, and (2) core size versus the size of the smallest participating molecule. An explanation of how these tradeoffs are addressed in MASS is given below.
Below we propose a heuristic algorithm for solving this hard problem. The algorithm runs in polynomial time and yields good results.
Algorithm outline
As was discussed earlier, the problem that we are trying to solve is NP-hard. Therefore, to reduce the run-time complexity we exploit the fact that the structures to be compared are not mere point sets in 3D space, but protein structures. Protein structures are composed of SSEs. The number of SSEs in a protein is smaller by 10-fold compared to the number of residues. Thus, structural description at the secondary structure level is significantly reduced compared to the Cα-atomic level, and can lead to considerable savings in computation, especially when many structures are analyzed.
The algorithm is based on a two-level alignment, using both secondary structure and atomic representation (see Fig. 1 ▶). In the first stage, the protein structures are represented by their SSEs. We assume that a structural alignment is biologically interesting only if its core consists of at least two SSEs. This assumption is based on the definition of a structural motif (Lehninger et al. 1993). According to this assumption, pairs of SSEs that are conserved in at least two proteins are detected, and initial local alignments are obtained. In the second stage, we use the Cα atomic coordinates of the protein structures to refine and extend the initial alignments, and so to obtain global atomic superpositions.
Figure 1.
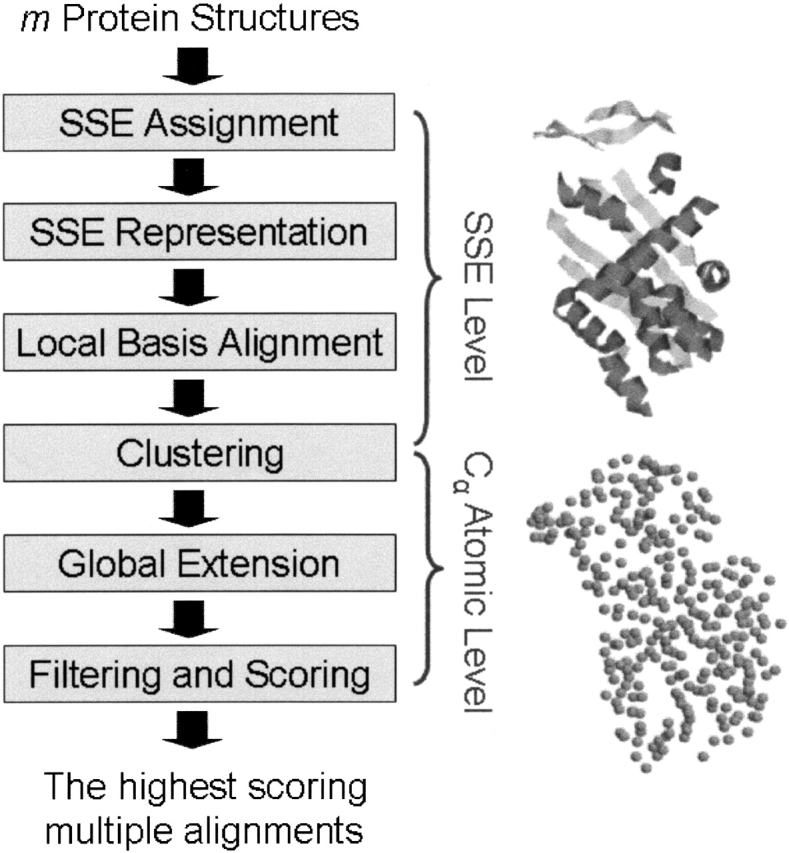
The flow of the MASS algorithm. MASS is based on a two-level alignment, using both secondary structure and atomic representation. In the first stage, the protein structures are represented by their SSEs, and initial local alignments are obtained based on this coarse representation. In the second stage, we use the Cα atomic coordinates of the protein structures to refine and extend the initial alignments and so to obtain global atomic superpositions. However, note that when atomic information is not available, there is an option in MASS to obtain alignments based only on secondary structures. In this mode, the local base alignment, clustering, and filtering steps are performed at the SSE level.
Input. The input for the method is a collection of m proteins: P1, P2, . . ., Pm. For each protein two inputs are given: (1) the 3D coordinates of its atoms in PDB format (Berman et al. 2000), and (2) the assignment of SSE types to its residues. In the current implementation of MASS, three types of SSE assignment are supported: PDB (Berman et al. 2000), DSSP (Kabsch and Sander 1983), and DSSPcont (Andersen et al. 2002).
-
Representing SSEs. The SSEs that we base our alignments on are helices and strands, where all types of helices (e.g., α, π, 3–10) are grouped together in one category.
We represent each SSE by its axis (see Fig. 2 ▶). The axis of an SSE is a directed 3D line segment, defined as follows: (1) It is located on the least squares line of all the α-carbon atoms of the SSE, that is, the line that minimizes the sum of squares of the perpendicular distances from the α-carbon atoms to the line; (2) its length is the distance between the two projection points of the terminal α-carbon atoms of the SSE; and (3) its direction is along the polypeptide chain.
-
Detecting multiple base alignments. A basis is defined as an ordered pair of SSEs. Based on the assumption that the core of an interesting alignment consists of at least two SSEs, our purpose in this stage is to find almost-congruent bases that appear in several proteins (in at least two by default). To find such bases in an efficient manner, we employ the Geometric Hashing paradigm (Nussinov and Wolfson 1991). Specifically, we represent each basis by a 5D vector, termed fingerprint. The fingerprint is invariant to a 3D rotation and translation and composed of the following five components (see Fig. 3A ▶): (1) the type of the first SSE, (2) the type of the second SSE, (3) the angle between their axial vectors, (4) the midpoint-to-midpoint distance between their axes, and (5) their line distance, that is, the closest distance in space between their (infinite) least-squares lines.
We store the bases of all proteins in a 5D grid addressed by their fingerprint. Congruent bases have the same fingerprint, and thus are stored in the same grid bin. Almost-congruent bases have similar fingerprints, and thus reside close to each other in the grid, but not necessarily in the same bin. The resolution of the grid is determined by the tolerance that we allow between the fingerprints of bases we consider as almost congruent. By default, two bases are considered to be almost congruent if: (1) the types of their SSEs are the same, (2) the difference between their midpoint-to-midpoint and line distances is up to 1.5 Å, and (3) the difference between their angles is up to 0.3 radians. These values have been determined empirically.
We then iterate over the grid bins. For each bin, we extract all the bases of the bin and of adjacent bins and group them together in the same base bucket (see Fig. 3B ▶). A base bucket is simply a container that stores bases in columns according to the protein they belong to. Bases derived from the same protein are stored in the same column.
Almost-congruent bases are stored in the same base bucket. A collection of almost-congruent bases, each belonging to a different column (i.e., protein) of a base bucket, induces a local multiple alignment between the respective proteins, whose core consists of at least two SSEs. Specifically, one basis is selected as a pivot and the rest of the bases are superimposed on it. The obtained vector of pairwise alignments defines a local multiple alignment between the respective proteins and is termed multiple base alignment. The core of this alignment consists of at least two SSEs, but can be extended into a larger substructure. Note that the selection of the pivot may influence the alignment. Thus, so as not to be influenced, there is an option in MASS to iteratively choose each basis to be a pivot.
A multiple alignment is defined by an underlying set of pairwise alignments. Thus, as a first step in evaluating the possible multiple base alignments, we compute their pairwise alignment components. Specifically, for each base bucket we compute all the alignments between two bases, taken from two different columns.
Two ways for aligning a pair of bases are supported. In the first approach we represent each SSE by the list of its Cα atoms. Then, we find the transformation between the two bases that aligns the maximal number of atoms with the minimal RMSD. In the second approach we uniquely define a cartesian reference frame for each basis. Then, we superimpose the two reference frames one onto another. This approach is less accurate than the former. However, it is useful in cases in which the atomic coordinates of the proteins are not known and the only available data are about their secondary structure, for instance information extracted from models or EM density maps (Chiu et al. 2002).
Clustering. Assume we have a pair of proteins whose largest common substructure consists of more than two SSEs. For such a pair, we may get several local base alignments (one alignment for each basis in their common substructure). These alignments have almost the same transformation, but a different local SSE core. Our aim at this stage is to cluster all the local base alignments to find the ones with similar transformations and merge them into a new global alignment. The match list of the new global alignment is the union of the original local match lists and its transformation is the one that aligns the SSEs of the new match list with minimum RMSD (computed by the Least-Squares Fitting method; Kabsch 1978).
Global extension. After the clustering, the core of each pairwise alignment is a set of SSEs. In this stage, we extend the cores of these alignments by detecting corresponding Cα atoms, which do not necessarily belong to SSEs. Each pairwise alignment is associated with a transformation. This transformation takes two sets of SSEs, one from each protein, and superimposes the second set onto the first set (i.e., the one from the pivot protein). We apply this transformation on the second protein, so that it is fully superimposed onto the pivot protein. We then detect in linear time pairs of Cα atoms, one atom from each protein, whose positions are close enough (Bachar et al. 1993). These atom pairs are added to the alignment’s match list. The transformation of the alignment is then refined by employing the Least-Squares Fitting method (Kabsch 1978).
Computing the best global multiple alignments. What are the best global multiple alignments? There is no absolute answer to this question. As was mentioned above, there are several tradeoffs; for example, (1) number of aligned molecules versus core size, and (2) core size versus the size of the smallest participating molecule. The tradeoffs are derived from the fact that we compare subset alignments with different participating molecules. Two approaches for addressing the first tradeoff have been implemented: (1) the score of an alignment is defined as a function of the number of participating molecules (k) and the core size (l): F(k, l) = l • (k2); (2) providing the alignments with the largest cores for each possible number of aligned molecules. The second tradeoff is addressed by using a relative scoring function, which rewards alignments with a high ratio between the core size and the size of the smallest participating molecule. The choice of the scoring function depends on the input and thus is a user-defined parameter.
Figure 2.
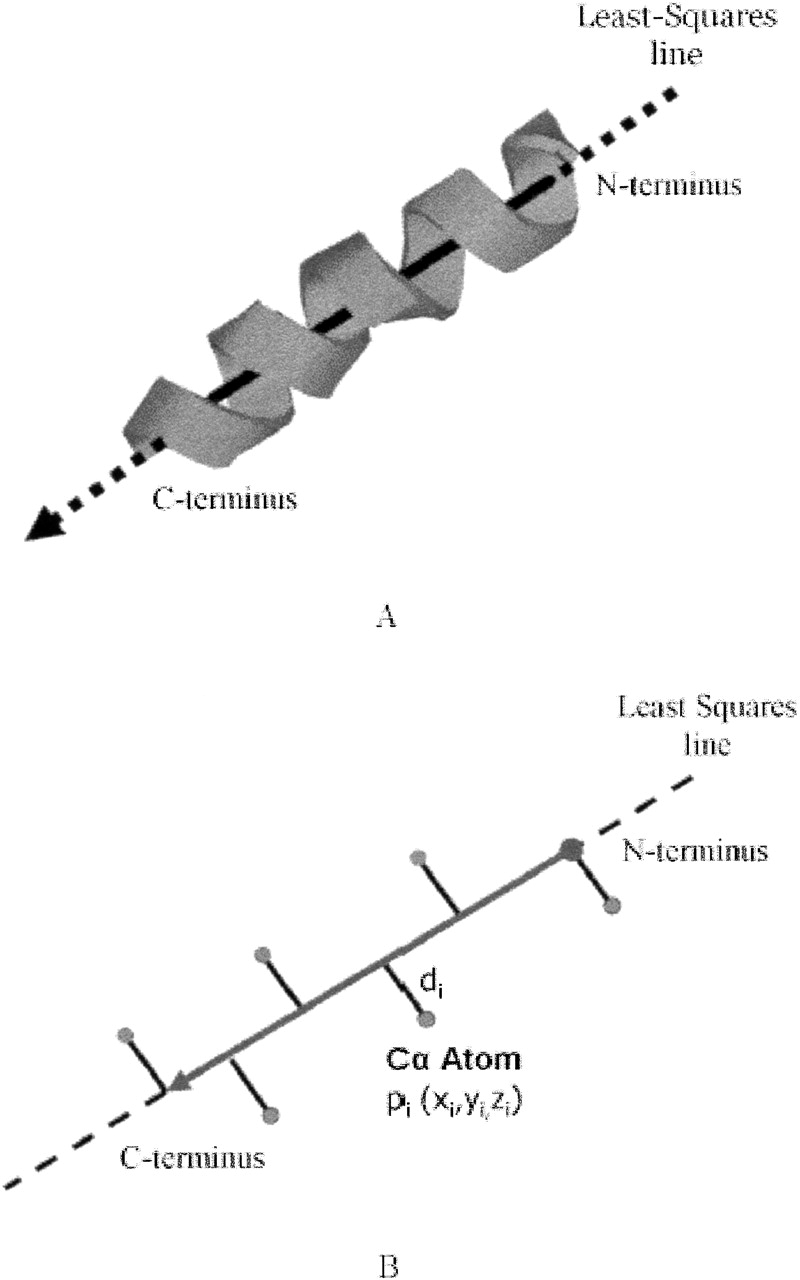
SSE representation. (A) Representing a helix as a 3D directed line segment. (B) The line segment that represents an SSE is defined as follows: (1) Its line is the least square line of all the Cα atoms of the SSE, that is, the line that minimizes ΣCαɛSSEdi2; (2) its length is determined by the projection of the two terminal Cα atoms of the SSE; and (3) its direction is from the N-terminus to the C-terminus.
Figure 3.
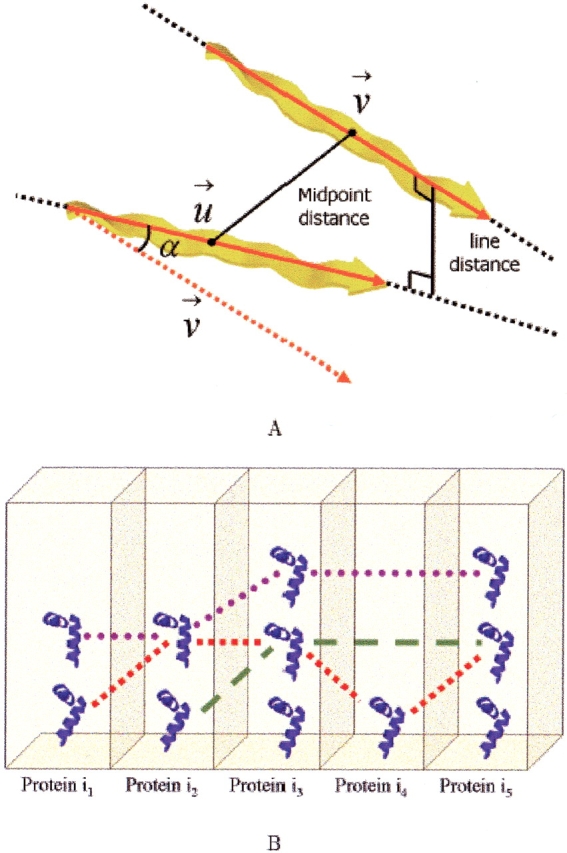
Base fingerprint and base bucket. (A) The fingerprint of a base is defined as a 5D vector composed of the types of the two SSEs, the angle (α) between their axial vectors, the midpoint-to-midpoint distance between their axes and their line distance. (B) A base bucket stores almost-congruent bases. The bases are stored in columns according to the protein they belong to. The paths shown in red, green, and magenta are examples for possible multiple base alignments.
As was discussed before, the number of possible multiple alignments defined by the base buckets is exponential in the number of input molecules. Our aim at this stage is not to compute all of them, but to suggest a heuristic solution for choosing and computing only the best ones. For each base bucket we compute the set of best multiple alignments over its columns. We select each basis as a pivot and choose at most one basis from each of the remaining columns in an iterative manner. The chosen bases are the ones that yield the best global alignment. The core of the resulting multiple alignment is the intersection of the cores of the underlying pairwise alignments. Because we construct only one multiple alignment for each basis, the number of alignments is polynomial in the number of bases.
Complexity
The overall run-time complexity of the algorithm is bounded by O(m2s4[s4 log s + n]) where m is the number of input proteins and s and n are the maximum number of SSEs and residues found in each protein respectively (Dror et al. 2003). (Note that in a typical globular protein s ∼ 15 and n ∼ 300.) This is the worst case complexity, when all the bases of all proteins are stored in one base bucket. The actual number of bases of a bucket is influenced by two factors: (1) the number of recurring motifs in each protein, and (2) the structural variance among the input proteins. The former influences the number of bases of a protein that will reside in the same base bucket. The latter influences the number of occupied bucket’s columns. Because not all the bases of a protein are almost congruent, there will be less bases in each bucket’s column. Furthermore, when the input proteins are less structurally similar, less bases of them will be in the same base buckets, so there will be less than m occupied columns. To estimate the "practical" run-time complexity, we have conducted a set of experiments. The behavior of the complexity in these tests was quadratic in both the number of molecules (m) and SSEs (s). This is much lower than the theoretical complexity.
Results and Discussion
We have conducted numerous experiments with the MASS program. Here we describe some of these, demonstrating the capability of MASS to address challenging cases of multiple structural alignment. These cases include: (1) detection of subset alignments and their use for structural classification, (2) detection of nontopological alignments, (3) detection of more than one common substructure for a given set of molecules, and (4) alignments of large-scale ensembles. Finally, we demonstrate how by utilizing structural conservation information, we are able to improve protein–protein docking. Additional examples for multiple alignments obtained by MASS can be found in Dror et al. (2003).
All experiments were performed on a standard PC workstation (Pentium 4 1800 MHz processor with 1 GB internal memory). Secondary structure assignment in all experiments was determined by the DSSP program (Kabsch and Sander 1983). The PDB codes of the discussed ensembles are listed in Table 4.
Table 4.
Data set
| Ensemble name | PDB codes |
| CL-GL | 1f7s, 1ak6, 1cfyB, 1cnu, 1d0nA:27–152, 1d0nA:153–262, 1d0nA:263–383, 1d0nA:384–532, 1d0nA:533–628, 1d0nA:629–755, 1svy, 2vik |
| DNA binding | 1a1i, 1bhi, 1rmd, 1tf3, 1ubd, 1yuj, 5znf, 1hq3C, 1hq3D, 1eqzB, 1perL, 2cro, 1adr, 1cw0A, 1fokA, 3bamA, 1ddnA, 1cgpA |
| TRAF immunoglobulin | 1czyA, 1kzzA, 1lb4, 1k2fA, 1bmg, 1frtB, 1igtA, 1k8iA |
| Two domains | 1a02N, 1iknA, 1nfiA, 1imhA, 1a3qA |
| Serine proteinases | 1sgt, 1ton, 2alp, 2pkaAB, 2sga, 3est, 3rp2A, 3sgbE, 4chaA, 2ptn |
| TIM barrels | 6xia, 1dxiA, 2gyiA, 1xyaA, 1xylA, 1xymA, 1xybA, 1xycA, 4xis, 1xis, 1gw9A, 3xis, 1xib, 1xic, 1xif, 1xii, 1xij, 1xih, 1xid, 1xig, 1xie, 9xia, 8xia, 1qt1A, 1clkA, 4xiaA, 1xlmA, 1dieA, 1xlaA, 1xlcA, 1xldA, 1xlfA, 1xlhA, 1xliA, 5xiaA, 1didA, 1xlgA, 1xljA, 1xlbA, 1xllA, 1xlkA, 1xleA, 1ximA, 3ximA, 5xinA, 4ximA, 3xinA, 2xinA, 2ximA, 7ximA, 9ximA, 8ximA, 1xinA, 6ximA, 5ximA, 1bhwA, 1a0cA, 1a0dA, 1a0eA, 1bxcA, 1bxbA |
| Microbial ribonucleases | 1i0vA, 9rnt, 1loyA, 1lovA, 1rga, 4gsp, 1i0xA, 8rnt, 2rnt, 3rnt, 1i3iA, 4bir, 1rgk, 2aae, 5bu4A, 1hyfA, 2gsp, 6rnt, 1fzuA, 1rn4, 5gsp, 1i2gA, 3gsp, 1i2eA, 2hohA, 4bu4A, 1g02A, 3bu4A, 3hohA, 1birA, 1bviA, 1rhlA, 1det, 1bu4, 1i2fA, 5hohA, 1rls, 1rgl, 7gspA, 1fysA, 5birA, 2aadA, 1lra, 1rgcA, 7rnt, 2bu4A, 1rnt, 1lowA, 1gsp, 1b2mA, 4hohA, 1rn1A, 6gsp, 4rnt, 1trqA, 1i3fA, 1ch0A, 3bir, 2birA, 1trpA, 5rnt, 1ygw, 1hz1A |
| Subtilisin | 1cseE, 2secE, 1selA, 1sbc, 1scjA, 1bh6A, 1avt, 1sca, 1scnE, 1vsb, 1c3lA, 1scd, 1be8, 1be6, 1bfu, 1bfk, 3vsb, 1av7, 1af4, 1scb, 1svn, 1gci, 1st3, 1jea, 1c9nA, 1c9mA, 1c9jA, 1lw6E, 1sup, 1a2q, 1s01, 1aqn, 1sub, 2st1, 1au9, 1ak9, 1yjb, 1sbh, 1sue, 1suc, 2sicE, 1s02, 1gnvA, 3sicE, 1yjc, 1sud, 1yja, 1gnsA, 1st2, 2sniE, 1duiA, 1spbS, 1suaA, 1sbi, 1sbnE, 1ubnA, 5sicE, 1sibE, 1sbt, 2sbt |
| Unrelated proteins | 1ah7, 1aorA:211–605, 1bkdS, 1bqv, 1csh, 1dnpA:201–469, 1dz4A, 1ewqA:267–541, 1f0jA, 1f5nA:284–583, 1g9lA, 1hbnA:270–549, 1i7wA, 1jswA, 1lla110–379, 1air, 1aol, 1arb, 1at0, 1gof151–537, 1hcb, 1ijaA, 1k8hA, 1knb, 1l7kA, 1lxa, 1nls, 1ospO, 1p35A, 1qexA, 1ad3A, 1cjyA:142–721, 1cm5A, 1dhs, 1ds9A, 1eu1A:4–625, 1fehA:210–574, 1gr8A, 1jetA, 1jixA, 1k30A, 1qpg, 1tml, 1ttqB, 1xaa, 1ag2, 1c8zA, 1cby, 1cfe, 1cnsA, 1d8iA, 1dy5A, 1ji8A, 1kyfA:825–938, 1kypA, 1mut, 1nox, 1qndA, 1qqqA, 1sryA:111–421 |
The first four letters of a protein name are the PDB code, followed by chain id, and the residue numbers for the first and the last residue.
Detection of subset alignments for structural classification
Here we show that MASS is capable of detecting not only structural motifs common to the whole given set of molecules, but also motifs shared only by a subset of molecules. We further show that such a capability may be very useful for structural classification.
-
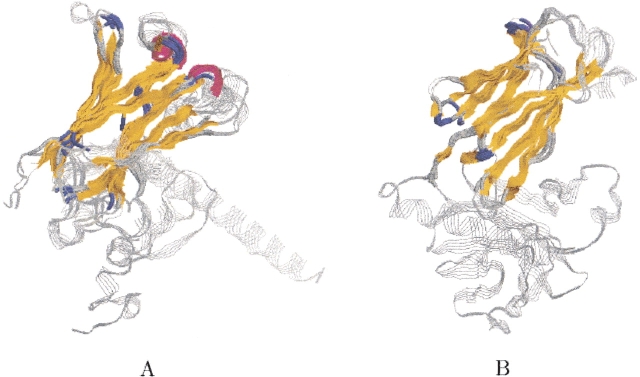
CL–GL ensemble. We have used MASS to align a set of 12 sequentially nonredundant structures taken from the "Actin depolymerizing proteins" fold of the SCOP database (Murzin et al. 1995). This fold contains only two families: the Cofilin-like (CL) and the Gelsolin-like (GL) families. The two families share a central five-stranded β-sheet of the form BACDE that is flanked between two α-helices: one long helix between strands D and E (α1), and one short helix in the C terminus (α2). The CL family has two additional α-helices: an N terminal helix, and a short helix between strands B and C. The two families are related structurally but not sequentially (Hatanaka et al. 1996; Benyamini et al. 2003). The 12-molecule ensemble contains four CL structures (PDB: 1f7s, 1ak6, 1cfyB, and 1cnu) and eight GL (PDB: 1d0nA: 27–152, 1d0nA: 153–262, 1d0nA: 263–383, 1d0nA: 384–532, 1d0nA: 533–628, 1d0nA: 629–755, 1svy, and 2vik).
The running time of MASS on this ensemble was 36 sec. Figure 4A ▶ presents the structural alignment of all 12 proteins. The common core consists of 28 residues with an RMSD of 1.9 Å. Strands A, C, D, E, and helix α1 are structurally conserved. Strand B is only partially conserved due to a slight twist. Helix α2 is not conserved, because its coordinates are missing in Arabidopsis thaliana cofilin protein (PDB: 1f7s).
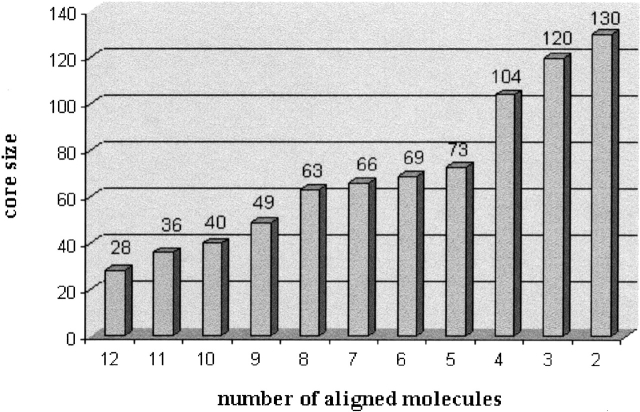
MASS also detected meaningful subset alignments. The graph in Figure 5 ▶ presents the maximal core size for every number of aligned molecules. As expected, the maximal core size decreases as the number of aligned molecules increases. However, the dependence is not linear—a significant decrease in the maximal core size is observed in the following three cases: (1) a decrease of 17 residues between three to four molecules, (2) a decrease of 32 residues between four to five molecules, and (3) a decrease of 15 residues between eight to nine molecules. The decrease in these cases indicates that the best subset alignments among eight, four, and three molecules may be the most interesting ones. Indeed, the best alignment among eight molecules consists solely of the GL family members. Their common core consists of 63 residues with an RMSD of 1.5 Å. It contains all the fold’s SSEs, including strand B and helix α2 (see Fig. 4B ▶). In addition, the best alignment among four molecules consists solely of the CL family members. Their core consists of 104 residues with an RMSD of 1.2 Å. It contains the fold’s SSEs, except for helix α2 (which is missing in protein PDB:1f7s), the two additional CL helices and a small β-strand (see Fig. 4C ▶). For three molecules, there are two good alignments. The first alignment is between three out of the four CL structures. The outlier protein is PDB:1f7s, which lacks the C-terminal α-helix (α2). The core of this alignment consists of 120 residues with an RMSD of 1.3 Å. It is similar to the core of all four CL structures, except that it contains also helix α2 (see Fig. 4D ▶). The second good alignment of three molecules is between the three X-ray solved CL structures (PDB: 1f7s, 1cfyB, and 1cnu) where the outlier is an NMR structure (PDB: 1ak6). Additionally, the three structurally similar proteins are classified as cofilin domains, while PDB:1ak6 is classified as destrin based on sequence similarity. The core of this alignment consists of 114 residues with an RMSD of 0.9 Å. It is similar to the core of all four CL structures.
This example demonstrates an application of MASS for the exploration of protein ensembles that are structurally homologous at different levels (e.g., family or fold). Multiple structural alignments of such ensembles are capable of addressing questions regarding the structural profile of a family and of a fold, and the structural characteristics that distinguish between different families within the same fold.
-
DNA binding ensemble. We find this ensemble interesting because the common denominator of the participating molecules is function and not fold (in contrast to the CL–GL ensemble). In such a case, one knows in advance that the ensemble may be structurally diverse, that is, it may contain different protein folds and thus poses a classification challenge.
The ensemble consists of 18 DNA-binding proteins, which can be classified into five structural groups (see Table 1). The proteins in each group belong to different domains of the same SCOP family or to different families of the same superfamily. The running time of MASS on this ensemble was 15 sec. All five groups were detected as subset alignments (see Table 2 and Fig. 6 ▶). The alignment of the classic zinc finger family captures a β-hairpin and an α-helix, together with the zinc atoms of the DNA–protein complexes. The alignment of the nucleosome core histones shows that they achieve a contact with DNA via their assembly. Their conserved structural core consists of three α-helices. The alignment of the phage repressor family shows the conservation of the helix-turn-helix DNA binding site scaffold. The alignment of members from the "restriction endonuclease like" superfamily has a core of a β-sheet and two α-helices. Here, the members are more remotely related, and thus the structural core does not contain the DNA binding site. Finally, the alignment of the winged helix superfamily members has a structurally conserved core that contains a central two-stranded β-sheet and three α-helices. In this case, the binding site is included in the alignment. Note that PDB:1fokA has two different domains that are differently classified in the SCOP database into the "Restriction endonuclease-like" and the "Winged helix DNA-binding domain" superfamilies. MASS detected the structural similarity within both input subsets.
The automatic detection, without any a priori knowledge of subset alignments of the different DNA binding molecules suggests that MASS is a powerful tool for structural classification of protein ensembles.
Figure 4.
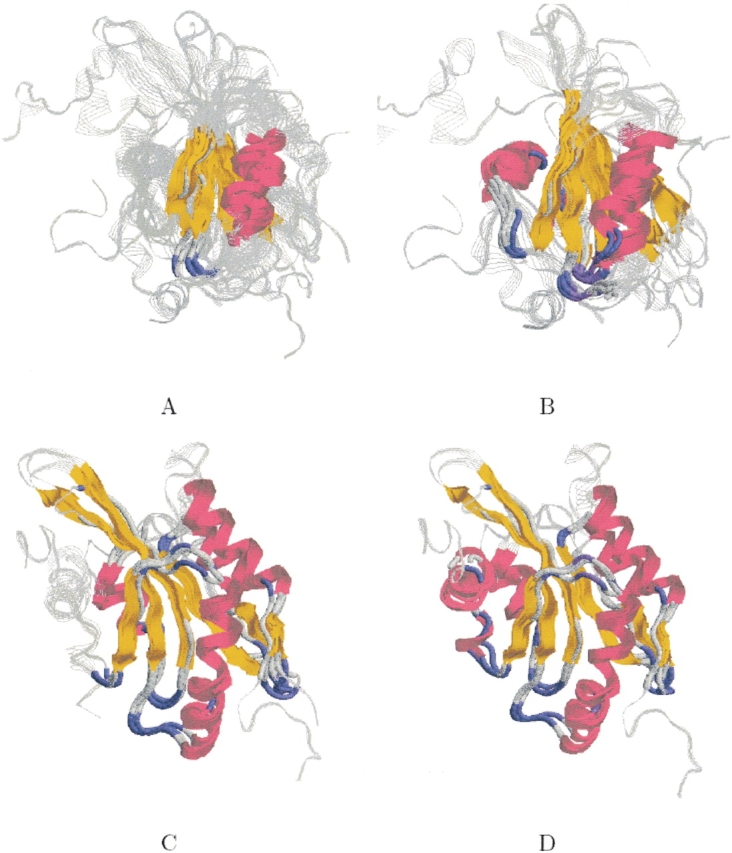
CL–GL ensemble. The figure shows four different subset alignments. The backbone of the proteins is displayed in RasMol strands representation (Sayle and Milner-White 1995) and is colored gray. The structurally conserved core detected by MASS is colored by secondary structure (helices are colored magenta, strands are colored yellow, turns are colored blue, and all other residues are colored light gray). (A) The structural alignment of all 12 proteins of the ensemble. (B) A subset alignment between only the eight GL proteins. (C) A subset alignment between only the four CL structures. (D) A subset alignment between only three out of the four CL structures. The outlier is PDB:1f7s, which lacks the C-terminal α-helix.
Figure 5.
CL–GL ensemble. The graph presents the maximal core size for every number of aligned molecules, taken from the CL–GL ensemble.
Table 1.
DNA-binding ensemble
| SCOP classification | PDB codes |
| Classic zinc finger (C2H2) family | 1a1i, 1bhi, 1rmd, 1tf3, 1ubd, 1yuj, 5znf |
| Nucleosome core histones family | 1hq3C, 1hq3D, 1eqzB |
| Phage repressors family | 1perL, 2cro, 1adr |
| Restriction endonuclease-like superfamily | 1cw0A, 1fokA, 3bamA |
| Winged helix DNA-binding domain superfamily | 1fokA, 1ddnA, 1cgpA |
Classification of the DNA-binding proteins into five different structural subgroups according to the SCOP database (Murzin et al. 1995).
Table 2.
DNA-binding ensemble
| SCOP classification | Core size | RMSD | Core description |
| Classic size finger (C2H2) family | 20 | 1.2 | β-hairpin followed by an α-helix |
| Nucleosome core histones family | 65 | 1.4 | a bundle of three helices |
| Phage repressors family | 60 | 0.9 | five helices |
| Restriction endonuclease-like superfamily | 55 | 1.9 | β-sheet of five strands and two helices |
| Winged helix DNA-binding domain superfamily | 46 | 1.7 | a bundle of three helices and a small β-sheet (wing) |
The structural core detected by MASS for each of the five different structural subgroups listed in Table 1.
Figure 6.
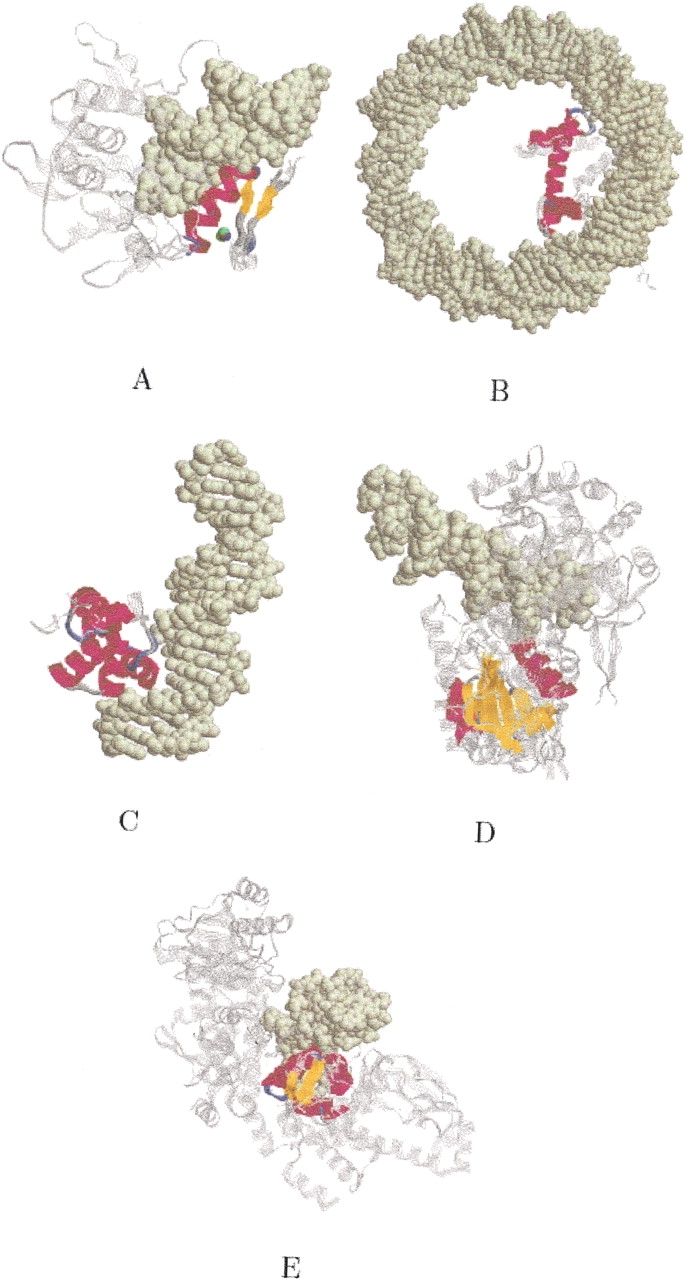
DNA binding ensemble. Subset alignments that captured the five structural subgroups of the ensemble: classic zinc finger, nucleosome core histones, phage repressors, restriction endonuclease, and winged helix (see Table 1). The backbone of the proteins is displayed in RasMol strands representation (Sayle and Milner-White 1995) and colored in gray. The conserved regions of the proteins are colored by secondary structure. The DNA is shown in spacefill representation and colored in light yellow. (A) The alignment of all seven structures of the "Classic zinc finger (C2H2)" family. Four of the structures are DNA complexes. Only the DNA from PDB:1yuj is shown. The Zinc atoms of all four DNA complexes are displayed by assigning a different color to each complex. As one can see, the four Zinc atoms are strictly superimposed. (B) The alignment of all three structures of the "Nucleosome core histones" family. The DNA is from PDB:1eqzB. (C) The alignment of all three structures of the "Phage repressors" family. The displayed DNA is of PDB:1perL. (D) The alignment of all three structures of the "Restriction endonuclease-like" superfamily. The displayed DNA is from PDB:1fokA. (E) The alignment of all three structures of the "Winged helix DNA-binding domain" superfamily. The displayed DNA is from PDB:1cgpA.
Detection of nontopological motifs
The following example shows that MASS is capable of finding nontopological structural alignments, that is, alignments in which the spatial configuration of the corresponding SSEs is conserved while their order and direction along the polypeptide chains are not conserved. Such alignments demonstrate that even when the sequences and topologies of proteins are totally different, their 3D structures may be surprisingly similar. In addition, such alignments may aid in elucidating the role of secondary structure packing preferences in protein folding. Here we give only one example for nontopological alignment. Other examples, obtained by MASS, can be found in Dror et al. (2003).
-
TRAF–immunoglobulin ensemble. The eight proteins of this ensemble belong to two different folds of the all-β class in the SCOP database (Murzin et al. 1995): (1) four of these (PDB: 1czyA, 1kzzA, 1lb4, and 1k2fA) belong to the "TRAF (TNF Receptor Associated Factor) domain-like" fold. There is only one superfamily in this fold, and it consists of two families: "TRAF domain," and SIAH ("Seven in Absentia Homolog"). Proteins PDB:1czyA, 1kzzA, and 1lb4 were taken from the three domains of the TRAF family, where PDB:1k2fA was taken from the only domain of the SIAH family; (2) The other proteins (PDB: 1bmg, 1frtB, 1igtA, and 1k8iA) belong to four different domains of the "C1 set domains" family of the "Immunoglobulin-like beta-sandwich" fold.
The running time of MASS on this ensemble was 21 sec. Figure 7A ▶ presents their structural alignment. The core of the alignment consists of 31 residues with an RMSD of 1.6 Å. It forms a sandwich of six β-strands. Figure 7 ▶, B and C, shows that the alignment is nonsequential, and that the structurally conserved core appears in the various proteins via different topologies.
Figure 7.
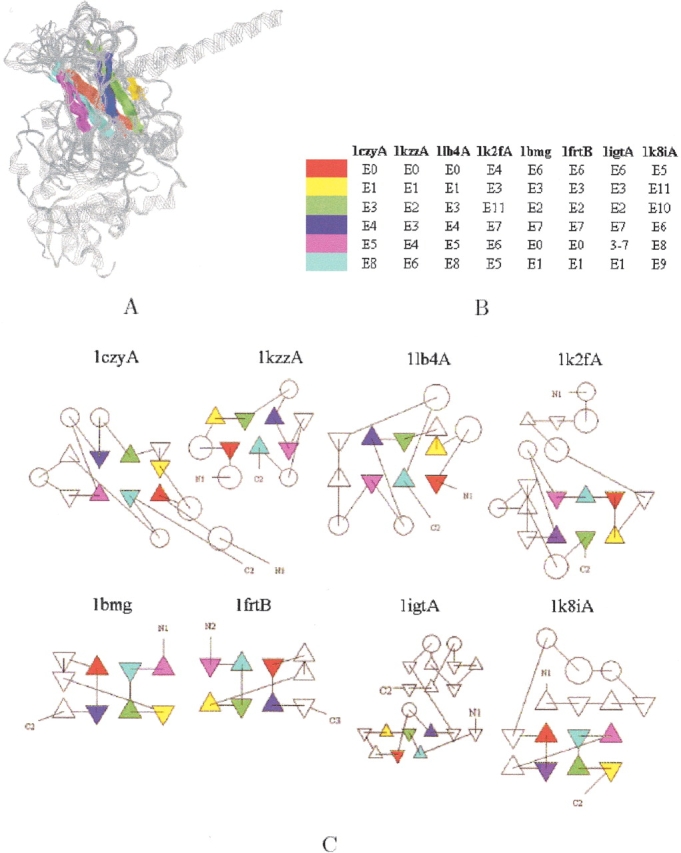
TRAF–immunoglobulin ensemble. (A) The structural alignment of all eight proteins of the ensemble. The backbone of the proteins is displayed in RasMol strands representation (Sayle and Milner-White 1995) and is colored in gray. Their common core is displayed by assigning a different color to each of the six conserved β-strands. (B) The match between the conserved β-strands (E stands for a β-strand, and it is followed by the strand number along the polypeptide chain). Note that a strand was not assigned to residues 3–7 of protein PDB:1igtA by the DSSP program (Kabsch and Sander 1983). But, according to the PDB assignment, residues 4–7 form a strand. (C) The TOPS diagrams of the proteins (=Flores et al. 1994). Triangles represent strands and circles helices as assigned by the DSSP program (Kabsch and Sander 1983). Corresponding strands are drawn in the same color. As one can see, the alignment is nontopological, and its core is a β-sandwich.
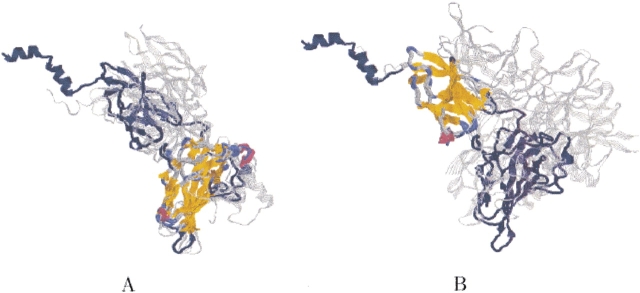
MASS also detected subset alignments. As expected, the highest scoring ones between four proteins are: (1) an alignment between all proteins of the "TRAF domain-like" fold. The common core consists of 82 residues with an RMSD of 1.5 Å. It forms a sandwich of eight β-strands (see Fig. 8A ▶); (2) an alignment between all proteins of the "Immunoglobulin-like beta-sandwich" fold. The core consists of 76 residues with an RMSD of 1.1 Å, and it forms a sandwich of seven β-strands (see Fig. 8B ▶). Interestingly, these two subset alignments are sequential, although in the alignment between all the eight proteins, the four members of each fold are aligned in a nonsequential manner. Specifically, proteins PDB:1k2fA and PDB:1k8iA are nonsequentially aligned with respect to the other three members of their fold (see Fig. 7B ▶). This demonstrates that an alignment, which is optimal for the whole set, is not always optimal for every subset.
Figure 8.
TRAF–immunoglobulin ensemble. The figure shows that MASS has managed to distinguish between the "TRAF domain-like" and the "Immunoglobulin-like beta-sandwich" proteins. The backbone of the proteins is displayed in RasMol strands representation (Sayle and Milner-White 1995) and colored in gray. The conserved regions of the proteins are colored by secondary structure (helices are colored magenta, strands are colored yellow, turns are colored blue, and all other residues are colored light gray). (A) A subset alignment between only the four proteins of the "TRAF domain-like" fold. (B) A subset alignment between only the four proteins of the "immunoglobulin-like beta-sandwich" fold.
The example demonstrates the ability of MASS to detect structural similarity among proteins that belong to different folds. Such structural similarity cannot be detected by sequence alignment methods and not even by structural alignment methods, which are sequence-order dependent (e.g., methods that based on dynamic programming).
Detection of several different common substructures
This section shows the ability of MASS to detect more than one common substructure (domain or motif) for a given set of molecules.
Detection of two common domains. We have used MASS to align five protein structures that have two common domains: "p53-like transcription factors" and "E set domains" (PDB codes: 1a02N, 1iknA, 1nfiA, 1imhA, and 1a3qA). The running time was 19 sec. MASS detected two different common substructures, one for each domain. The first common substructure is part of the "p53-like transcription factors" domain. It consists of 114 residues with an RMSD of 1.4 Å, and it forms a sandwich of nine β-strands (see Fig. 9A ▶). The second common substructure is part of the "E set domains" domain. It consists of 87 residues with an RMSD of 1.2 Å, and it forms a sandwich of seven β-strands (see Fig. 9B ▶). The two common substructures may indicate a possible hinge motion between the two domains, that is, there is no 3D rigid transformation that simultaneously aligns the two domains. In future work we intend to extend MASS to handle hinge motions.
Detection of two common motifs. When we applied MASS to the DNA-binding ensemble (see earlier), we obtained two good subset alignments for the three winged-helix proteins (PDB: 1fokA, 1ddnA, and 1cgpA). The first alignment is the one that is described earlier. Its core consists of a bundle of three helices and a small β-sheet (46 residues with an RMSD of 1.7 Å). Although the core of the second alignment also forms a motif of a 3-helix bundle and a small β-sheet (45 residues with an RMSD of 1.6 Å), the two alignments are different. Figure 10, A and B ▶, shows the two alignments, respectively. As one can see, the transformation that superimposes PDB:1ddnA onto PDB:1cgpA (the pivot structure) is similar in the two alignments, but the transformation that superimposes PDB:1fokA onto PDB:1cgpA is completely different. This indicates that the winged-helix motif appears twice in PDB:1fokA. Figure 10C ▶ shows that two detected motifs of PDB:1fokA are involved in DNA binding.
Figure 9.
Two-domains ensemble. The figure shows the two different structural conserved cores of the ensemble. The backbone of protein 1nfiA is shown in navy. The backbone of the other proteins is colored gray. The two structurally conserved cores detected by MASS are colored by secondary structure. (A) The first detected conserved core (part of the "p53-like transcription factors" domain). (B) The second detected conserved core (part of the "E set domains" domain).
Figure 10.
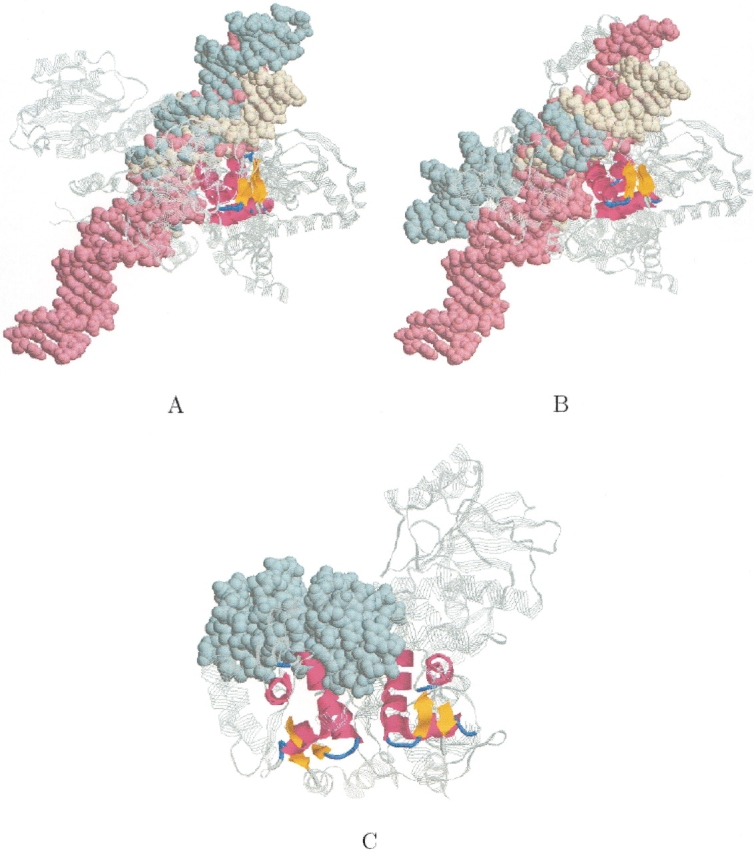
Winged helix DNA binding domain. The figure shows the two different subset alignments that were obtained for the three winged helix DNA binding proteins (PDB: 1cgpA, 1fokA, 1ddnA) when we applied MASS to the DNA binding ensemble. The backbone of the proteins is colored gray. The cores of the alignments are colored by secondary structure. The DNA of PDB:1cgpA, 1fokA, and 1ddnA are colored in light yellow, light blue, and light pink, respectively. (A) The first detected subset alignment (also shown in Fig. 6E ▶). The DNAs of all the three complexes are well aligned. The core of the alignment is a winged-helix motif (three helices and a small β-sheet). (B) The second detected subset alignment. Only the DNAs of PDB:1cgpA and PDB:1ddnA are well aligned. The core of this alignment is also a winged-helix motif. (C) The figure shows that the two detected winged-helix motifs of PDB:1fokA are involved in DNA binding.
The above examples demonstrate that the largest common substructure is not the only biologically interesting solution, and emphasize the need to examine a list of high-scoring solutions, rather than only the highest one.
Large-scale structural alignments
Here we demonstrate MASS’s capability of aligning tens of protein structures in practical running times on a standard PC. For this purpose, we have applied MASS to the following four SCOP ensembles (Murzin et al. 1995): (1) TIM barrels—all of the 62 structures, which belong to the Xylose isomerase family of the TIM beta/alpha-barrel fold (the family consists of only one domain); (2) Microbial ribonucleases—all 63 structures belonging to the RNase T1 domain of the Microbial ribonucleases family; (3) Subtilisin—all 60 structures belonging to the Subtilisin domain of the Subtilases family; and (4) unrelated proteins—a compiled set of 60 unrelated protein structures. Each structure was taken from a different fold of the four major SCOP classes: all-α, all-β, α + β, and α/β.
Table 3 summarizes the performance of MASS on the four ensembles as a function of: (1) the number of molecules, (2) the average molecular size, (3) the average number of SSEs in a molecule, and (4) the structural similarity among the molecules. All four parameters increase the running time as they grow. Both our complexity analysis and results demonstrate such a behavior. For instance, although the Microbial ribonucleases and the TIM-barrel ensembles consist of almost the same number of proteins taken from the same SCOP domain (63 and 62, respectively), the running time of MASS on the Microbial ribonucleases ensemble (28 sec) is much shorter than on the TIM-barrel ensemble (47 min: 59 sec). This difference in the running times is mainly due to the difference in the average molecular size and the average number of SSEs (103 and 3 versus 391 and 14, respectively). Another factor that has influenced the running time is the difference in the number of self-recurring motifs. The TIM-barrel proteins have more self recurring motifs due to their symmetric structures. As a result, more bases were stored in a bucket’s column and the run time was increased. Comparing the performance of MASS on the Subtilisin ensemble and on the compiled set of unrelated proteins shows how structural variance among the input proteins influences the running time: The more structurally variable the ensemble, the shorter the running time. Both ensembles consist of 60 molecules; their average number of SSEs is 14, and their average molecule size is almost the same (273 and 297), even though the running time of MASS on the compiled set of unrelated proteins (9 min: 42 sec) is shorter than on the Subtilisin ensemble (23 min: 10 sec). We attribute this difference in the running times mainly to the difference in the structural variance within each ensemble: The Subtilisin ensemble consists of structurally homogeneous proteins (i.e., proteins from the same SCOP domain) where the other ensemble consists of structurally unrelated proteins (i.e., each protein belongs to a different SCOP fold).
Table 3.
Run times of MASS on large-scale protein ensembles
| Ensemble name | No. of mol. | Avg. mol. size | Avg. no. of SSEs | SCOP classification | Run time (h:mm:ss) |
| TIM barrels | 62 | 391 | 14 | same domain | 00:47:59 |
| Microbial ribonucleases | 63 | 103 | 3 | same domain | 00:00:28 |
| Subtilisin | 60 | 273 | 14 | same domain | 00:23:10 |
| Unrelated proteins | 60 | 297 | 14 | unrelated | 00:09:42 |
The performance of MASS as a function of: (1) the number of molecules; (2) the average molecular size; (3) the average number of SSEs in a molecule; and (4) the structural similarity among the molecules. All four parameters increase the running time as they grow.
Application of MASS for docking improvements
The problem of predicting the correct binding mode of protein–protein interaction is extremely difficult. A major problem is that of "false positives". In the state-of-the-art docking algorithms, often a correct solution (within 5 Å RMSD from the native complex) is detected among the best few hundreds; alas, it is ranked too low to be analyzed by a subsequent visual inspection (Halperin et al. 2002). This problem is especially acute for large protein molecules, where there are alternative binding interfaces with better complementarity. Therefore, an a priori knowledge of the binding site is likely to critically aid in detecting the correct docking. Sometimes the binding site is known in advance due to direct biochemical data. In the absence of such knowledge, one may need to utilize alternative means. Here, we show how an efficient multiple structure comparison routine, such as MASS, can be helpful in guiding protein–protein docking.
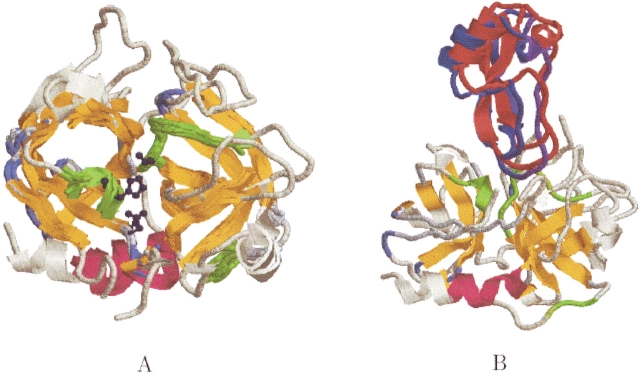
The serine proteinases have been a standard benchmark for evaluating multiple structural alignment methods (Sali and Blundell 1990; Russell and Barton 1992; Yang and Honig 2000b). In particular, the 10 serine proteinases listed in Table 4 are known to be difficult to align using sequence information alone (Russell and Barton 1992). Figure 11A ▶ shows the structural alignment of all 10 proteins as obtained by MASS (runtime 39 sec). A structural core of 123 residues is detected with an RMSD of 1.5 Å. It contains the two six-stranded antiparallel β-barrels that form the fold and the three residues of the catalytic triad (HIS-57, ASP-102, SER-195). MASS further detected three conserved loops: residues 55–59 (contains a small 3–10 helix), 128–130, and 189–197. Two of these contain residues that belong to the catalytic triad (His-57, Ser-195).
Figure 11.
Serine proteases. (A) The structural alignment of 10 serine proteinases. PDB:2pkaAB is shown completely in light yellow. The core of the alignment is colored by secondary structure and the three conserved loops are colored in green. The catalytic triad is also conserved (the triad of PDB:2pkaAB is depicted as ball and sticks and colored dark blue). Two of the conserved loops (55–59 and 189–197) are located in the active site. (B) The unbound docking, as obtained by PatchDock (Duhovny et al. 2002), between a serine protease kallikrein A (PDB:2pkaAB) and its bovine pancreatic trypsin inhibitor (PDB:6pti). The receptor PDB:2pkaAB is depicted as in A. The docked inhibitor, colored in red, is superimposed on the inhibitor of the crystal complex (PDB:2kaiI), colored blue.
Secondary structures serve as the scaffold of proteins, and thus are usually conserved for stability purposes. In contrast, conservation of connecting loops may indicate a potential functional site. A docking of kallikrein A (PDB:2pkaAB) and a bovine pancreatic trypsin inhibitor (PDB:6pti) was performed using PatchDock (Duhovny et al. 2002). We applied the docking procedure twice: (1) without any assumption on the binding site; (2) a guided docking, defining the structurally conserved loops detected by MASS as the region that contains the binding site. Strikingly, the rank of the correct docking solution was improved from 49 to 1 (see Fig. 11B ▶).
Conclusions
Here we have described a novel method, named MASS, for aligning multiple protein structures and detecting their common structural motifs. MASS simultaneously compares the input proteins, both at the secondary structure and the Cα atomic levels. The usage of SSEs at the first stage aids in filtering out noisy solutions and in making the method highly efficient and robust.
The results have demonstrated the performance of MASS on some challenging cases of multiple structural alignment. We have shown that: (1) MASS is capable of aligning tens of protein structures in practical running time; (2) As MASS disregards the sequence order of SSEs, it is able to detect nontopological structural motifs; and (3) MASS can successfully detect biologically meaningful substructures common to nonpredefined subsets of the input ensemble. It automatically classifies the given ensemble to its constituent structural and functional subsets. For example, it distinguished between different families of DNA binding proteins. We have further shown a new application of multiple structure alignment: exploiting the detected structurally conserved motifs for considerably improving the results of a docking procedure.
These features of MASS suggest that it is a useful tool for homology modeling, protein classification, and structure–function studies. We further suggest the SSE-only mode of MASS as a potential future application. Compared to the full (SSE and atomic) mode, the SSE-only mode is far more efficient with lower running times. It may be useful for two types of cases:
large scale ensembles. Currently, MASS exhibits practical running times on ensembles on the order of tens of proteins. Using the SSE-only mode is likely to enable the running of MASS on larger ensembles.
Ensembles that contain proteins for which only SSE information exists. Examples include theoretical models obtained by structure prediction methods, or suggested SSE arrangements inferred from cryo-electron microscopy (Chiu et al. 2002).
Acknowledgments
We thank Dina Schneidman-Duhovny for contributing the docking result of the serine proteinase. This research has been supported in part by the "Center of Excellence in Geometric Computing and its Applications" funded by the Israel Science Foundation (administered by the Israel Academy of Sciences). The research of H.J.W. and O.D. is partially supported by the Hermann Minkowski-Minerva Center for Geometry at Tel Aviv University. The research of R.N. has been funded in whole or in part with Federal funds from the National Cancer Institute, National Institutes of Health, under contract number NO1-CO-12400. The content of this publication does not necessarily reflect the view or policies of the Department of Health and Human Services, nor does mention of trade names, commercial products, or organization imply endorsement by the U.S. Government. The publisher or recipient acknowledges right of the U.S. Government to retain a nonexclusive, royalty-free license in and to any copyright covering the article. MASS is freely available on http://bioinfo3d.cs.tau.ac.il/MASS.
The publication costs of this article were defrayed in part by payment of page charges. This article must therefore be hereby marked "advertisement" in accordance with 18 USC section 1734 solely to indicate this fact.
Article and publication are at http://www.proteinscience.org/cgi/doi/10.1110/ps.03200603.
References
- Akutsu, T. and Halldorsson, M.M. 2000. On the approximation of largest common subtrees and largest common point sets. Theor. Comput. Sci. 233 33–50. [Google Scholar]
- Akutsu, T. and Sim, K.L. 1999. Protein threading based on multiple protein structure alignment. Genome Informatics 10 23–29. [PubMed] [Google Scholar]
- Alesker, V., Nussinov, R., and Wolfson, H. 1996. Detection of non-topological motifs in protein structures. Protein Eng. 9 1103–1119. [DOI] [PubMed] [Google Scholar]
- Alexandrov, N. and Fischer, D. 1996. Analysis of topological and nontopological structural similarities in the PDB: New examples with old structures. Proteins 25 354–365. [DOI] [PubMed] [Google Scholar]
- Andersen, C., Palmer, A., Brunak, S., and Rost, B. 2002. Continuum secondary structure captures protein flexibility. Structure 10 175–185. [DOI] [PubMed] [Google Scholar]
- Bachar, O., Fischer, D., Nussinov, R., and Wolfson, H. 1993. A computer vision based technique for 3-D sequence independent structural comparison. Protein Eng. 6 279–288. [DOI] [PubMed] [Google Scholar]
- Benyamini, H., Gunasekaran, K., Wolfson, H., and Nussinov, R. 2003. Conservation and amyloid formation: A study of the gelsolin-like family. Proteins 51 266–281. [DOI] [PubMed] [Google Scholar]
- Berman, H., Westbrook, J., Feng, Z., Gilliland, G., Bhat, T., Weissig, H., Shindyalov, I., and Bourne, P. 2000. The protein data bank. Nucleic Acids Res. 28 235–242. [DOI] [PMC free article] [PubMed] [Google Scholar]
- Branden, C. and Tooze, J. 1999. Introduction to protein structure, 2nd ed. Garland Publishing, Inc., New York.
- Brown, N.P., Orengo, C.A., and Taylor, W.R. 1996. A protein structure comparison methodology. Comput. Chem. 20 359–380. [Google Scholar]
- Chiu, W., Baker, M., Jiang, W., and Zhou, Z. 2002. Deriving folds of macromolecular complexes through electron cryomicroscopy and bioinformatics approaches. Curr. Opin. Struct. Biol. 12 263–269. [DOI] [PubMed] [Google Scholar]
- Ding, D., Qian, J., and Feng, Z. 1994. A differential geometric treatment of protein structure comparison. Bull. Math. Biol. 56 923–943. [DOI] [PubMed] [Google Scholar]
- Dror, O., Benyamini, H., Nussinov, R., and Wolfson, H. 2003. MASS: Multiple structural alignment by secondary structures. Bioinformatics 19 (Suppl. 1) i95–i104. [DOI] [PubMed] [Google Scholar]
- Duhovny, D., Nussinov, R., and Wolfson, H. 2002. Efficient unbound docking of rigid molecules. In Workshop on algorithms in bioinformatics. Lecture notes in computer science 2452 (eds. R. Guigo and D. Gusfield), pp. 185–200. Springer Verlag, Rome.
- Eidhammer, I., Jonassen, I., and Taylor, W. 2001. Structure comparison and structure patterns. J. Comp. Biol. 7 685–716. [DOI] [PubMed] [Google Scholar]
- Escalier, V., Pothier, J., Soldano, H., and Viari, A. 1988. Pairwise and multiple identification of three-dimensional common substructures in proteins. J. Comp. Biol. 5 41–56. [DOI] [PubMed] [Google Scholar]
- Flores, T., Moss, D., and Thornton, J. 1994. An algorithm for automatically generating protein topology cartoons. Protein Eng. 7 31–37. [DOI] [PubMed] [Google Scholar]
- Gerstein, M. and Levitt, M. 1996. Using iterative dynamic programming to obtain accurate pairwise and multiple alignments of protein structures. In Proceedings of the Fourth International Conference on Intelligent Systems for Molecular Biology (eds. D. States et al.), pp. 59–67. The AAAI Press, Menlo Park, CA. [PubMed]
- Grindley, H., Artymiuk, P., Rice, D., and Willett, P. 1993. Identification of tertiary structure resemblance in proteins using a maximal common subgraph isomorphism algorithm. J. Mol. Biol. 229 707–721. [DOI] [PubMed] [Google Scholar]
- Guda, C., Scheeff, E., Bourne, P., and Shindyalov, I. 2001. A new algorithm for the alignment of multiple protein structures using Monte Carlo optimization. In Proceedings of the Pacific Symposium on Biocomputing (eds. R. Altman et al.), pp. 275–286. World Scientific, Singapore. [DOI] [PubMed]
- Gusfield, D. 1993. Efficient methods for multiple sequence alignment with guaranteed error bounds. Bull. Math. Biol. 55 141–154. [DOI] [PubMed] [Google Scholar]
- Halperin, I., Ma, B., Wolfson, H., and Nussinov, R. 2002. Principles of docking: An overview of search algorithms and a guide to scoring functions. Proteins 47 409–443. [DOI] [PubMed] [Google Scholar]
- Hatanaka, H., Ogura, K., Moriyama, M., Ichikawa, S., Yahara, I., and Inagaki, F. 1996. Tertiary structure of destrin and structural similarity between two actin-regulating protein families. Cell 85 1047–1055. [DOI] [PubMed] [Google Scholar]
- Holm, L. and Sander, C. 1995. 3-D lookup: Fast protein structure database searches at 90% reliability. In The Third International Conference on Intelligent Systems for Molecular Biology, (eds. C. Rawlings et al.), pp. 179–187. The AAAI Press, Menlo Park, CA. [PubMed]
- Kabsch, W. 1978. A discussion of the solution for the best rotation to relate two sets of vectors. Acta. Crystallogr. A 34 827–828. [Google Scholar]
- Kabsch, W. and Sander, C. 1983. Dictionary of protein secondary structure: Pattern recognition of hydrogen-bonded and geometrical features. Biopolymers 22 2577–2637. [DOI] [PubMed] [Google Scholar]
- Kaindl, K. and Steipe, B. 1997. Metric properties of the root-mean-square deviation of vector sets. Acta. Crystallogr. A 53 809. [Google Scholar]
- Koch, I., Lengauer, T., and Wanke, E. 1996. An algorithm for finding maximal common subtopologies in a set of proteins. J. Comp. Biol. 3 289–306. [DOI] [PubMed] [Google Scholar]
- Lamdan, Y. and Wolfson, H. 1988. Geometric hashing: A general and efficient model-based recognition scheme. In Proceedings of the IEEE International Conference on Computer Vision, pp. 238–249. IEEE Computer Society Press, Tampa, FL.
- Lehninger, A.L., Nelson, D.L., and Cox, M.M. 1993. Principles of biochemistry, 2nd ed. Worth Publishers, New York.
- Leibowitz, N., Fligelman, Z., Nussinov, R., and Wolfson, H. 2001a. Automated multiple structure alignment and detection of a common motif. Proteins 43 235–245. [DOI] [PubMed] [Google Scholar]
- Leibowitz, N., Nussinov, R., and Wolfson, H. 2001b. MUSTA—A general efficient, automated method for multiple structure alignment and detection of common motifs: Application to proteins. J. Comp. Biol. 8 93–121. [DOI] [PubMed] [Google Scholar]
- Lemmen, C. and Lengauer, T. 2000. Computational methods for the structural alignment of molecules. J. Comput. Aided Mol. Des. 14 215–232. [DOI] [PubMed] [Google Scholar]
- Lu, G. 2000. TOP: A new method for protein structure comparisons and similarity searches. J. Appl. Crystallogr. 33 176–183. [Google Scholar]
- May, A. and Johnson, M. 1995. Improved genetic algorithm-based protein structure comparisons: Pairwise and multiple superpositions. Protein Eng. 8 873–882. [DOI] [PubMed] [Google Scholar]
- Mitchel, E., Artymiuk, P., Rice, D., and Willet, P. 1989. Use of techniques derived from graph theory to compare secondary structure motifs in proteins. J. Mol. Biol. 212 151–166. [DOI] [PubMed] [Google Scholar]
- Murzin, A., Brenner, S., Hubbard, T., and Chothia, C. 1995. SCOP: A structural classification of proteins database for the investigation of sequences and structures. J. Mol. Biol. 247 536–540. [DOI] [PubMed] [Google Scholar]
- Needleman, S. and Wunsch, C. 1970. A general method applicable to the search for similarities in amino acid sequence of two proteins. J. Mol. Biol. 48 443–453. [DOI] [PubMed] [Google Scholar]
- Nussinov, R. and Wolfson, H. 1991. Efficient detection of three-dimensional structural motifs in biological macromolecules by computer vision techniques. Proc. Natl. Acad. Sci. 88 10495–10499. [DOI] [PMC free article] [PubMed] [Google Scholar]
- Russell, R. and Barton, G. 1992. Multiple protein sequence alignment from tertiary structure comparison: Assignment of global and residue confidence levels. Proteins 14 309–323. [DOI] [PubMed] [Google Scholar]
- Sali, A. and Blundell, T. 1990. Definition of general topological equivalence in protein structures. A procedure involving comparison of properties and relationships through simulated annealing and dynamic programming. J. Mol. Biol. 212 403–428. [DOI] [PubMed] [Google Scholar]
- Sayle, R. and Milner-White, E. 1995. RasMol: Biomolecular graphics for all. Trends Biochem. Sci. 20 374–376. [DOI] [PubMed] [Google Scholar]
- Shatsky, M., Nussinov, R., and Wolfson, H. 2002. MultiProt—A multiple protein structural alignment algorithm. In Workshop on algorithms in bioinformatics. Lecture notes in computer science 2452 (eds. R. Guigo and D. Gusfield), pp. 235–250. Springer Verlag, Rome.
- Taylor, W.R., Flores, T., and Orengo, C. 1994. Multiple protein structure alignment. Protein Sci. 3 1858–1870. [DOI] [PMC free article] [PubMed] [Google Scholar]
- Yang, A.S. and Honig, B. 2000a. An integrated approach to the analysis and modeling of protein sequences and structures. I. Protein structural alignment and a quantitative measure for protein structural distance. J. Mol. Biol. 301 665–678. [DOI] [PubMed] [Google Scholar]
- ———. 2000b. An integrated approach to the analysis and modeling of protein sequences and structures. III. A comparative study of sequence conservation in protein structural families using multiple structural alignments. J. Mol. Biol. 301 691–711. [DOI] [PubMed] [Google Scholar]


