

Abstract
We analyze packing imperfections in globular proteins as reflected in deviations of torsion angles from the equilibrium values for the isolated side chains. The distribution of conformations of methionine and lysine residues in a database of high-resolution structures is compared with energies of model compounds calculated with high-level quantum-mechanics. The distribution of the C–C and C–S torsion angles (χ3) correlates well with the Boltzmann factor of the torsion energy, exp(−βE) of the model compounds C2H5—C2H5 and C2H5—S—CH3. An exponential relation was again found between the relative occurrence of g+, g− and t conformations for Cα—Cβ bonds in long side chains and the energy differences of rotamers of α-amino n-butyric acid, when dependence on backbone conformation was taken into account. The distribution of all 27 rotamers of methionine was correlated with the energy differences between the model’s rotamers, corrected for clashes with nearby residues, the correlation being good for a set with backbone in the β-conformation, but less clear for backbone α-conformation. In all correlations, the value of the coefficient β corresponds to a temperature of circa 300 K. These results can be interpreted with a model that considers the structure of a folded protein as resulting from packing imperfectly complementary parts, with a requirement of an overall low energy. Compromises are required to optimize the fit of nonbonded contacts with surrounding groups, and side chains assume conformations away from the energy minimum. An exponential distribution is a most probable distribution, and this can be established easily under conditions other than thermal equilibrium.
Keywords: Torsion angle distribution, relation between distribution and energy, Boltzmann-type distribution, exponential distribution, methionine side chains, small molecules as models
The structure of globular proteins must meet a general requirement that the free energy of the folded state is lower than that of the unfolded ensemble. Favorable contributions to the internal energy are made by the short-range dispersion forces, and the somewhat longer-range Coulomb forces; both are sensitive to the details of how the interior is packed. The structure of folded proteins is highly ordered: A high packing density and an absence of holes are dominant features (Richards 1977; Richards and Lim 1994), and, with very few exceptions, internal polar groups form hydrogen bonds. Interactions with solvent make large contributions to the free energy of folding, but are less sensitive to packing details.
The folded structures are stable globally, but also locally the structures are close to optimal. Overall energy will be low if components of the structure have low-energy conformation; local deviations from minimum energy conformation, that may be thought of as structural imperfections, should be small. However, the structure of a folded protein contains a limited variety of structural elements that do not all fit perfectly, even with a highly optimized amino acid sequence, and packing imperfections appear unavoidable.
Structural elements that are sensitive to conformational details include internal coordinates (bond lengths, bond angles, and torsion angles), contact distances between nonbonded atoms, and hydrogen bond geometry, any of which might be chosen to assess the extent of imperfections. When the geometry of a structural element is not optimal, then the element is strained by exterior forces. Strained elements of different types are coupled: For example, if a side chain is strained to improve a nonbonded contact, then that nonbonded contact is strained in turn. Accordingly, by evaluating strain of one type, one may draw inferences about strain of other types. Here, strain is evaluated in terms of deviations of torsion angles from minimum-energy values.
The conformations of side chains in proteins of known structure, when characterized in terms of torsion angles, distribute into mostly well-separated clusters, called rotamers (Ponder and Richards 1987; Dunbrack and Karplus 1993), that correspond to expected low-energy conformations. The internal energies of the different rotamers are not the same; the conformer with lowest internal energy is preferred; conformers with higher internal energy do occur, but with lower frequency.
This study focuses on the frequency of deviations from minimum-energy conformations and on the relative population of different rotamers, and asks how these correlate with energies of representative model molecules.
We have relied on a recently developed and updated database of residues in high-resolution X-ray structures (Lovell et al. 2000, 2003). Elsewhere, we have shown that the inherent variation of single-bond torsion angles is found by considering only atoms with atomic B-factors below 20 Å2, which effectively eliminates the effects of statistical error and positional uncertainty (G. Butterfoss, J. Richardson, and J. Hermans, in prep.). The model molecules selected for calculations of the energy are small, so that structures can be carefully optimized with accurate energy functions based on high-level quantum mechanics.
To compare the statistics of the database with model energies, one typically assumes an exponential relation between the density of instances in the database, P and the energy, E
 |
(1) |
where β is a constant. The form of equation 1 is that of a Boltzmann distribution; its application to distributions in native protein structures was first proposed by Pohl (1971). A Boltzmann distribution applies in an ensemble at thermal equilibrium, in which case β has its usual form
 |
(2) |
where kB is Boltzmann’s constant, and T the absolute temperature.
Pohl proposed an exponential relation of the form of equation 1 for side-chain torsion angles χ1 of residues with aromatic side chains (Pohl 1971), and such relations have subsequently been proposed for distribution of ion pairs in proteins (Bryant and Lawrence 1991), for occurrence of residues in secondary structures (Chou and Fasman 1978; O’Neil and DeGrado 1990; Chakrabartty et al. 1994), for buried-exposed distributions of side chains (Finkelstein et al. 1995), and for size distribution of cavities (Rashin et al. 1997). The present article benefits from a number of circumstances: the availability of a growing data base of high-resolution crystal structures, the elimination of effects of experimental error and positional uncertainty by use of atoms with low B-factors (G. Butterfoss, J. Richardson, and J. Hermans, in prep.), and the possibility of computing accurate energies of simple models that reproduce components of proteins in isolation. As a result, we have been able to establish instances in which the distributions closely follow the exponential of the energy of the isolated models. In one instance in which this is not true, the deviations can be reconciled by considering effects from parts of the protein outside the simple model.
Being apolar, methionine side chains are predominantly part of the cores of proteins, where they tend to be surrounded by nonpolar side chains, and where the structure is most closely defined. The methione side chain has two C—C and one C—S single bonds, and can assume 27 conformations of locally minimum energy. In isolation, each conformation has a preferred geometry, but when a residue’s side chain is fit into a particular protein structure, its conformation may change by internal rotation to achieve whatever balance between packing and torsional forces is required to minimize the energy. Analysis of statistics of lysine side chains is included for comparison.
Studies with high-level QM of models of structural features that occur in proteins are not uncommon. For example, these calculations include studies of diethyl disulfide, CH3—CH2—S—S—CH2—CH3, as a model of the disulfide bridge (Qian and Krimm 1993; Görbitz 1994), models of hydrogen bonding by and to aromatic rings in proteins (Scheiner et al. 2002), a study of geometry of hydrogen bonding between NH and CO groups (Lipsitz et al. 2002), a study of preferred geometry for interactions between S and O atoms (Iwaoka et al. 2002), and calculations of the energy of the benzene dimer (Sinnokrot et al. 2002; Tsuzuki et al. 2002) that indicate as the most stable forms the T-shaped dimer, which is similar to a common mode of packing of phenylalanine side chains inside proteins (Burley and Petsko 1985), and the parallel-displaced dimer, which is uncommon in proteins. A recent study cataloged the low-energy geometries of the common amino acids computed at the Hartree-Fock level (Matta and Bader 2002).
In most of these papers, only a qualitative connection between database and energetics is sought. Sometimes this is understandable because the available databases were small and not restricted to well-defined residues; in other cases, the energy difference between alternative structures is large, and the frequency of the high-energy form, if it occurs at all in the database, cannot be determined with sufficient precision (“forbidden conformations”; Ramachandran and Sasisekharan 1968). In contrast, the work described below has made extensive use of a recently updated database of high-resolution protein structures, and has sought to establish form and extent of correlations between database and energetics including instances in which the energy differences are relatively small.
Results
CC–SC and CC–CC torsion in C2H5—S—CH3 (EMS) and butane, and the distributions of χ3 of methionine and lysine
The computed potential energies for rotation about the CC—SC bond of EMS are shown in Figure 1 ▶. (Because of symmetry, only half the curve is shown.) According to all methods the minima lie within half a kcal/mole. However, whereas B3LYP, HF, and SCCDFTB predict the energy of the gauche conformation to be nearly equal to or greater than trans, MP2 predicts the gauche minima to be of lower energy by 0.39 kcal/mole, the barrier between the gauche and trans conformation to be 1.8 kcal/mole, and that between the two gauche conformations, 4.60 kcal/mole.
Figure 1.
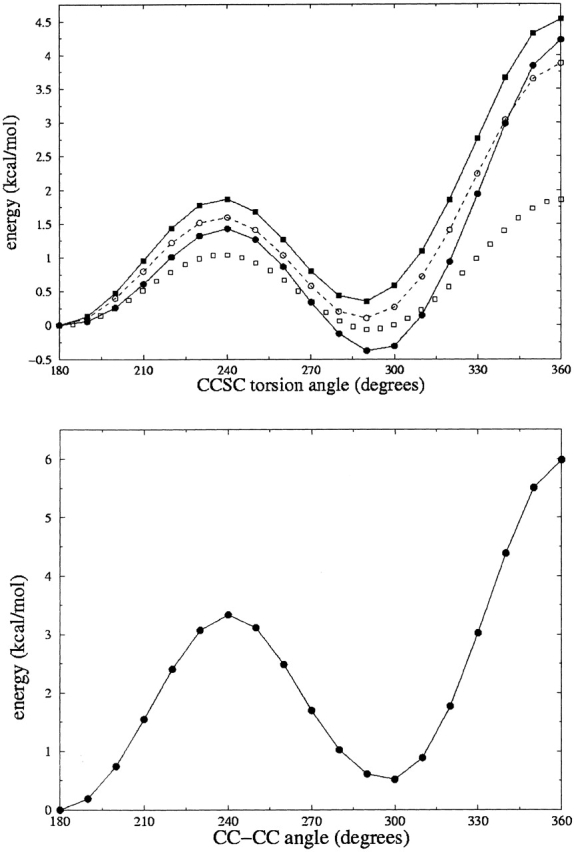
(Top) Energy of C2H5—S—CH3 (EMS) as a function of the torsion angle for the CC—SC bond. (Filled circles) Optimized with MP2, (filled squares) HF energies for MP2-optimized geometry, (open circles) B3LYP optimized geometry, (open squares) SCCDFTB. (Bottom) Energy of butane as a function of the torsion angle for the CC—CC bond (optimized with MP2).
The theoretical results agree with those of previous studies that demonstrate that electron correlation effects lower the relative energy of the EMS gauche conformation. Estimates based on experimental data for EMS in the liquid and in the vapor state as well indicate that the difference between the energies of the local minima is very small. Several studies suggest that the gauche and trans conformers of EMS are nearly equal in energy (Hayashi et al. 1957; Sakakibara et al. 1977), while two other studies indicate that the gauche conformation is slightly more favorable (by circa 0.15 kcal/mole; Nogami et al. 1975; Oyanagi and Kuchitsu 1978), and one study concludes that the trans conformation is more stable by 0.4 kcal/mole (Durig et al. 1991). The gauche conformation has been shown to be the sole geometry in the annealed solid state (Durig et al. 1991). Durig et al. (1979, 1991) have attempted to determine the barrier heights for rotation of the C—S bond of EMS on the basis of fitting a potential function to IR and Raman data, with results that compare poorly with the theoretical values.
Tsuzuki et al. (1996) studied the effects of electron correlation methods on the energies of the EMS stationary point structures and found that, in general, the skew and eclipsed barrier heights tend to decrease with increasing consideration of electron correlation. This is consistent with a systematic study of butane indicating that electron correlation effects are more significant in the eclipsed and skew conformations than in the other geometries (Allinger et al. 1997). In agreement, here MP2 predicts lower barrier heights for both transitions than HF. SCCDFTB predicts much lower energy barriers than the ab initio calculations, a feature that seems rather systematic to SCCDFTB (G.L. Butterfoss, unpubl.).
The energy profile for internal rotation of butane has been computed by Allinger et al. (1997) at a very high level of theory with a very large basis set. The trans conformation is more stable than the gauche conformation by 0.62 kcal/mole; the barrier between gauche and trans is 3.31 kcal/mole, and that between the two gauche conformations, 5.51 kcal/mole. Very similar values are obtained at the MP2 level of theory with a smaller basis set, the most different being the value of 5.98 for the barrier between the gauche conformations.
For comparison with the distribution in the database, the MP2 energies for torsion about the C—S bond in EMS and C—C bond in butane have been converted to probability distributions according to equations 1 and 2 (for T = 300 K; Fig. 2 ▶). (The distribution was generated as follows: A relative probability was calculated for each energy, E; the resulting curve was integrated using the trapezoid rule, and the probability was normalized by dividing each value by the integral.) These figures also contain plots of the distribution of χ3 for, respectively, well-ordered methionine and well-ordered lysine residues in the database.
Figure 2.
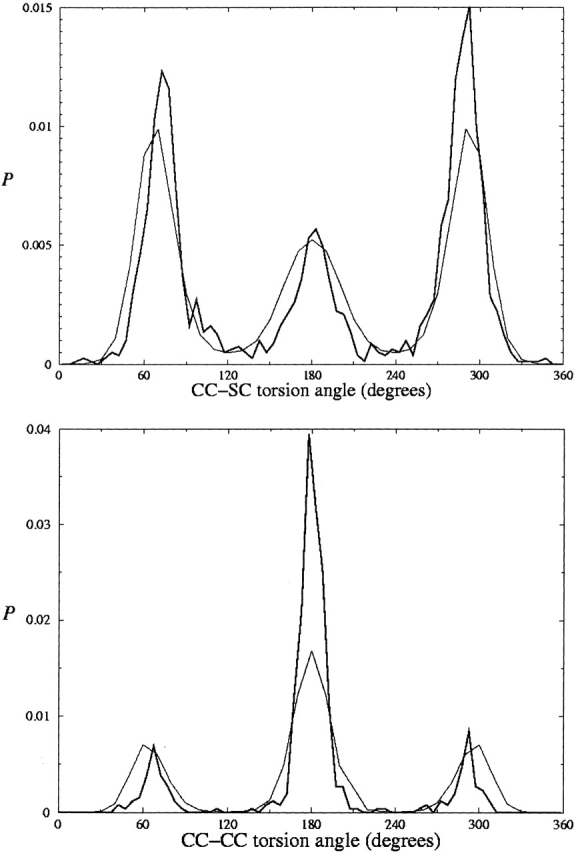
(Top) Exponential distributions for the computed energy (MP2) of C2H5—S—CH3 (EMS; thin line) and the distribution of χ3 of well-ordered methionine residues in the database (heavy line). (Bottom) The same for, respectively, butane and lysine residues.
The agreement between experimental and theoretical distributions is striking. The curves agree within a factor of two on the populations near the maxima but also agree near the minima: For methionine, the population of skew conformers (χ near ±120°), is low but not zero. On the other hand, the population of eclipsed conformers of methionine (χ near 0°), is negligible, as is true for lysine near all three minima. Predicted peak widths are close to the experimental values for the gauche conformations of methionine and slightly narrower for the trans conformation of methionine and all conformations of lysine. Use of a value of T smaller than 300 K to compute the theoretical distributions in equation 2 tends to raise high values relatively more than low values, and render the peaks narrower, and this would improve the fit in Figure 2 ▶.
For EMS, the trans conformation is somewhat underrepresented in the database, relative to the distribution based on the model’s energies. Also, there appear to be “deficits” in the database distribution for χ near 50° and for χ between 150° and 180°. Finally, the spike in the database distribution near 100° is due to the presence of the mmp rotamer, which has a mean value of χ3 in this range, due to interactions with the protein backbone (Word et al. 1999). (Following Lovell et al. [2000], we designated rotamers of methionine with three-letter acronyms, the first letter representing torsion about the Cα—Cβ bond, the second torsion about the Cβ—Cγ bond, and the third torsion about the Cγ—Cδ bond, with the letter m standing for gauche−, the letter t for trans, and the letter p for gauche+.) Clearly, the symmetry of the model is not perfectly reflected in the database. The asymmetry of the latter must be due to the asymmetry of attachment of the side chain to the backbone and the resulting asymmetry also of preferred regular secondary structure. Even though several steps removed from the backbone, the side-chain torsion angle, χ3 of methionine is influenced by the asymmetry of its environment. No significant asymmetry is noticeable for the distribution of χ3 of lysine, but this may be due also to the omission of side chains with gauche conformation at χ2.
As determined from solvent-accessible surface area (Connolly 1983a,b), methionine and lysine side chains with low atomic B-factors are, on average, the least exposed. For any range of B-factors, the lysine side chains have greater exposed surface area: Considering only the Cβ, Cγ, Cδ, or Sδ, and Cɛ atoms, the average surface area is three times larger for lysine than for methionine for atoms with B-factors below 20 Å3. The solvent-accessible surface area of the lysine side chains with high B is slightly over twice that of the set with largest B, while for methionine the ratio is near 7. Clearly, as expected, methionine side chains are predominantly part of the protein cores, while this is rarely the case for a lysine side chain. On the other hand, those lysines with low B-factors are screened from solvent by protein side chains and backbone, although not often completely.
Distribution of χ1 rotamers of Aba
When analyzing the distribution over different rotameric states, it is important to take into account a correlation between preferred side chain and backbone conformation that was first established by Dunbrack and coworkers (Dunbrack and Karplus 1993, 1994; Dunbrack and Cohen 1997), who were able to rationalize the dependence of rotamer preference on backbone conformation in terms of a qualitative conformational analysis (Dunbrack and Karplus 1994). Here, these preferences are reanalyzed in terms of the energies of the dipeptide of α-amino n-butyric acid, Ace-Aba-Nme, which has a single C–C torsion in the side chain.
Contour plots of the conformational prevalence of each of the three rotamers are shown as Ramachandran plots (Fig. 3A–C ▶). Figure 3D ▶ shows which rotamer has highest density, and indicates the points selected for comparison of experimental data and energies. In most of the “allowed” regions, m is the most favorable conformation. The t conformation is the most favorable rotamer in the “ideal” αR region and in a roughly hourglass-shaped strip across the β-sheet region with ψ < 150°. The p rotamer is most favorable in a small slice near the upper left-hand corner of the Ramachandran plot and in two other small patches.
Figure 3.
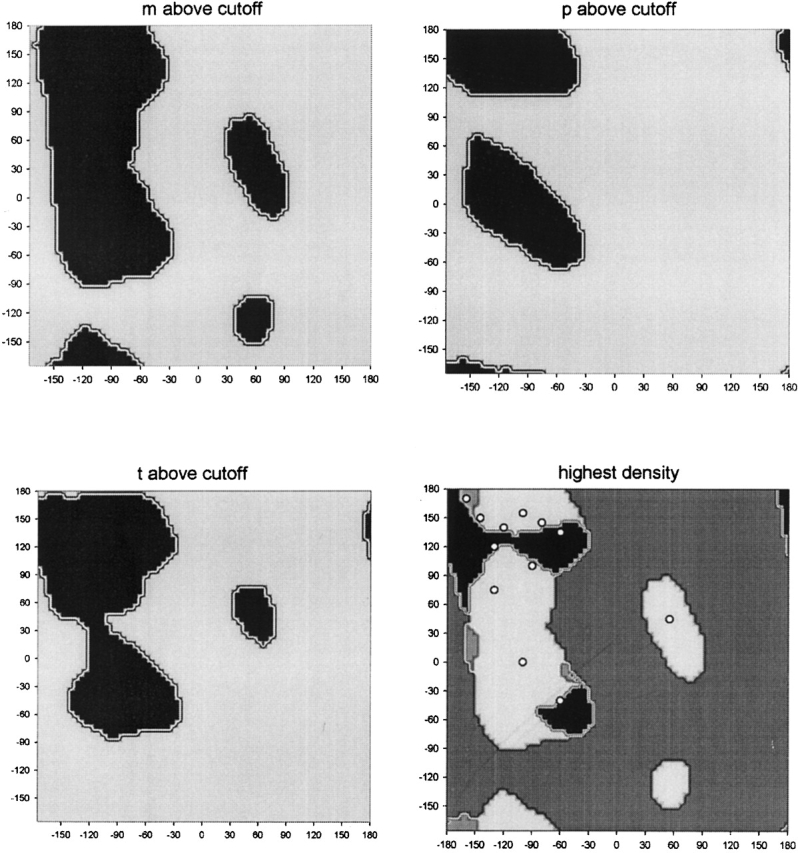
Three panels show for what backbone conformations each rotameric state for χ1 is significantly populated. Points in the fourth panel indicate conformations selected for comparison with energies of Ace-Aba-Nme. Shades of gray indicate where a particular conformation dominate: (darkest) t, (lightest) m, (medium) p. (Data for Met, Glu, Gln, Arg and Lys side chains.)
The geometry of the model, Ace-Aba-Nme has been optimized at the Hartree-Fock level, and the energy recalculated at the MP2 level, for a number of backbone conformations for which at least two of the rotamers are significantly populated. The differences in population in the database have been plotted as a function of the energy differences in Figure 4 ▶, as log likelihood −(1/β) ln (Pi/Pj) where the subscripts i and j refer to two of the three conformations, m (g−), p (g+), and t. These values have been calculated for backbone conformations at which both conformations are prevalent, for a sample of all side chains with CH2 groups at both Cβ and Cγ (Met, Glu, Gln, Arg, Lys). Excellent correlations with slopes close to unity are obtained when β is given by equation 2 with T = 300 K.
Figure 4.
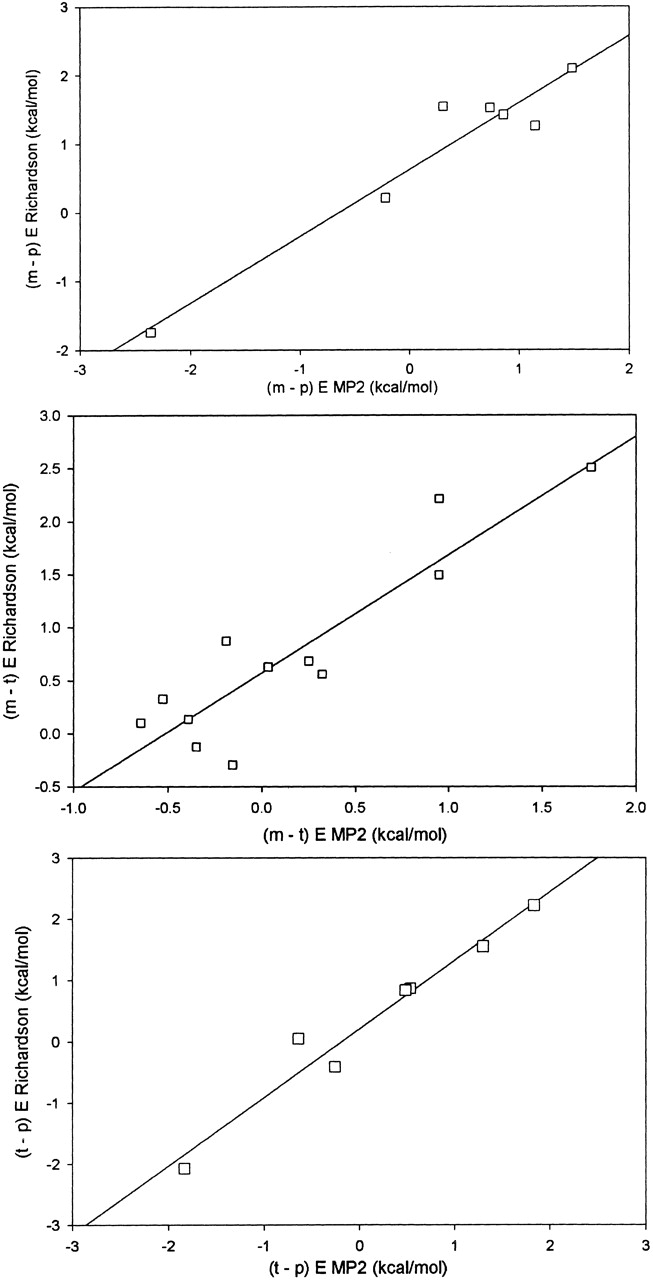
Correlation of ratios of densities of rotameric states for χ1 of Met, Glu, Gln, Lys, Arg in the database with the energy difference for the corresponding minimum-energy conformation of the Aba dipeptide (Ace-Aba-Nme; density ratio is plotted on a logarithmic scale).
The t–m plot has the most points but covers the smallest range (~2.5 kcal/mole along both dimensions). The t–p and m–p plots cover a range of 4 kcal/mole. The regressions are as follows:
 |
(3) |
where y stands for −(1/β) ln (Pi/Pj) and x for the energy difference, Ei − Ej.
Methionine dipeptide
We have attempted also to optimize the geometry of all 27 possible methionine rotamers with two different fixed backbone conformations: α-helix and β-sheet, chosen to represent the approximate average of the φ and ψ values in these sets in the database. Probably because of severe atomic overlaps, the optimization failed in the case of a very few conformers; these conformers are not represented in the corresponding database sets.
Figures 5 ▶ and 6 ▶ show plots of the populations of the rotamers in the data set as a function of the MP2 energies of the dipeptide structures; the data are tabulated in Table 1. Each of these figures contains an exponential distribution in the computed energy, E of the form Aexp(−E/kBT), equation 1, with A chosen to produce an acceptable fit, and T = 300 K.
Figure 5.

Fraction of each methionine side-chain conformer in the β-sheet set of the database as a function of the energy of the conformer in the dipeptide with β-sheet backbone geometry. The curve is an exponential distribution in the energy.
Figure 6.

Fraction of each methionine side-chain conformer in the α-helix set of the database as a function of the energy of the conformer in the dipeptide with α-helical backbone geometry. Open circles refer to conformers for which the side chain clashes with other residues in an α-helical peptide. The curve is an exponential distribution in the energy.
Table 1.
Energies of side chain rotamers of Ace-Met-Nme in β-sheet and α-helix backbone conformations, and the fraction of rotamers in the corresponding sets of the database
| β-Sheet rotamers | α-Helix rotamers | All 2145 rotamers | ||||
| Rotamer | Energy | % | Rotamer | Energy | % | % |
| mmm | 2.16 | 12.1 | mmm | 1.04 | 20.0 | 19.0 |
| mmp/mmt | 1.30 | 3.7 | mmp | 2.46 | 3.7 | 3.1 |
| mmt | 2.68 | 2.9 | 3.4 | |||
| mpm | — | 0 | mpma | 0.75 | 0.0 | 0.14 |
| mpp | 4.15 | 0.9 | mppa | 0.00 | 0.1 | 0.75 |
| mpt | 4.02 | 0.5 | mpta | 0.61 | 0.0 | 0.37 |
| mtm | 2.78 | 14.4 | mtm | 2.36 | 12.6 | 11.2 |
| mtp | 2.90 | 15.7 | mtp | 1.79 | 19.3 | 16.3 |
| mtt | 3.25 | 10.1 | mtt | 2.65 | 11.3 | 9.3 |
| pmm | 3.88 | 0.2 | pmma | 0.37 | 0.0 | 0.14 |
| pmp | — | 0 | pmpa | — | 0.0 | 0 |
| pmt | 3.94 | 0 | pmta | 1.04 | 0.0 | 0.14 |
| ppm | — | 0 | ppma | — | 0.0 | 0.05 |
| ppp | 4.50 | 0.7 | pppa | 4.10 | 0.0 | 0.37 |
| ppt | 4.05 | 0.2 | ppta | 5.49 | 0.0 | 0.14 |
| ptm | 3.77 | 3.7 | ptma | 1.84 | 0.4 | 2.9 |
| ptp | 3.58 | 3.2 | ptpa | 2.45 | 0.1 | 2.2 |
| ptt | 4.09 | 3.4 | ptta | 2.54 | 0.4 | 2.1 |
| tmm | 3.93 | 1.8 | tmm | 3.28 | 1.77 | 1.3 |
| tmp | — | 0 | tmpa | — | 0.0 | 0 |
| tmt | — | 0.5 | tmt | 2.73 | 0.0 | 0.28 |
| tpm | 4.82 | 0.5 | tpm | 0.53 | 1.18 | 0.75 |
| tpp | 0.00 | 3.9 | tpp | 1.58 | 8.2 | 6.4 |
| tpt | 1.55 | 1.4 | tpt | 1.68 | 2.2 | 2.0 |
| ttm | 3.51 | 10.5 | ttm | 1.41 | 5.1 | 7.5 |
| ttp | 3.38 | 8.5 | ttp | 1.24 | 7.8 | 6.8 |
| ttt | 4.05 | 3.9 | ttt | 1.57 | 2.6 | 3.3 |
Energies in kcal/mole.
a Clash in (Ala)9-Met-(Ala)11 α-helix.
β-Sheet rotamers
There appears to be no correlation between energy and population for the entire set of β-sheet rotamers. In particular, several rotamers that have low energy in the dipeptide models are quite uncommon in β-sheets in folded proteins (tpp, tpt, mmp/mmt). (During optimization, the structures starting in the mmp and mmt conformations optimized to the same geometry in both [φ = −120, ψ = 140] and [φ = −130, ψ = 120] β-sheet conformations, with χ3 = 131.2 and 138.7, respectively. These two conformations have both been termed mmt/mmp, and their energies have been compared to the sum of the mmp and mmt fractions in the database.) Qualitatively, these instances can largely be explained by considering interactions that are expected within the context of the folded protein. The tpp rotamer is most favorable in the β-sheet backbone conformation. In this rotamer, the sulfur sits in a pocket formed by Hα and the carbonyl oxygen atoms of the (same) residue. With such a geometry, the sulfur atom, with its large van der Waals radius, interferes with hydrogen bonding of polar groups to the carbonyl oxygen (Fig. 7 ▶). Thus, we propose that the tpp rotamer is uncommon in proteins because the low energy of the conformation does not compensate for the loss of a hydrogen bond in the β-sheet structure. The same argument can be made for the tpt rotamer, which is also lower in energy than would be expected by the population data (the sulfur atom occupies nearly the same position as in tpp). The mmt/mmp rotamer also has anomalously low potential energy in the β-sheet conformation. In this structure the side chain is in a position to block hydrogen bonding to the NH group (see Fig. 7 ▶).
Figure 7.

Models showing interference of side chain with backbone or other residues for compact conformations of methionine. (Top left) tpp Rotamer with β-sheet backbone; (bottom left) mmt/mmp rotamer with β-sheet backbone; (right) tpm rotamer in α-helix (only atoms Cγ through Cɛ of the side chain and Cβ of residues i+3 and i+4 with attached hydrogen atoms are shown explicitly).
In seeking a more quantitative basis for singling out these conformers as special cases in which the dipeptide model performs poorly, we have considered the solvation free energy computed with a continuum dielectric model, and the solvent-accessible surface of the conformers as indications of accessibility to hydrogen bonding partners. The computed solvent-polarization free energies of the anomalous conformers turned out to be only slightly higher (less favorable) than those of the other conformers, and thus appear not relevant to the problem. The solvent-accessible surfaces (as defined by Connolly 1983a,b) of two of the low-energy/low prevalence conformers give significant indication of hindrance: The oxygen atom of the acetyl blocking group of the mmp/mmt conformer has the lowest solvent-accessible surface of any beta conformer, and the same is true of the NH group of the N-methyl blocking group of the tpp conformer.
Excluding these low-energy anomalies, the energies follow an exponential distribution rather well. A likely source of scatter is that rather strong nonbonded interactions of, especially, the sulfur atom with other atoms of the dipeptide favor compact conformations of the model, while inside a folded protein nonbonded contacts with other side chains will favor more extended conformations.
α-Helix rotamers
In the case of methionine side chains in residues in α-helices, the regular structure of the surrounding α-helix precludes some side-chain conformations that would otherwise be allowed in the dipeptide. We accounted for such clashes by using the Reduce program (Word et al. 1999) to test for atomic overlaps in an (Ala)9-Met-(Ala)11 α-helix with each of the energy-minimized methionine side-chain geometries. Several conformations that are apparently energetically favorable in the dipeptide produce clear clashes in the α-helical structure, and these rotamers are essentially absent in the experimental database. An exception is the tpm rotamer, which has rather low energy but forms no internal clashes in the model helix. In this conformation the side chain sits in a space between the Cβ of following residues (i+3 and i+4; Fig. 7 ▶). It is likely that any residues larger than alanine in these positions would cause a clash. Once the obviously clashing rotamers and the tpm rotamer have been excluded, the remaining conformers contain no anomalously low-energy rotamers; however, the correlation is less clear than for the set having the backbone in a β-conformation.
Discussion
The results presented above indicate good agreement between observed conformations and statistics of side chains in proteins and the energy of small molecules that are models for all or part of the residue, treated in isolation. As shown elsewhere, there is good correlation between the mean values of observed side-chain dihedral angles and the values for minimum energy conformations of the model (G. Butterfoss, J. Richardson, and J. Hermans, in prep.). There are very good correlations between the distribution of the Cγ–Sδ torsion angle of methionine and the Cγ–Cδ torsion angle of lysine (χ3) and the energetics of the respective models, EMS and butane (Fig. 2 ▶). There is also a good correlation between the ratio of population of isomeric states of the first side-chain torsion angle, χ1 and the energy difference between rotational isomers of the model, the Aba dipeptide (Ace-Aba-Nme; Fig. 4 ▶). In each case, an exponential relationship between population and energy, equation 1 provides a good fit of the results. Finally, there is a less striking correlation between the frequency of the (27) rotamers of the entire methionine side chain in the database and the energies of the rotamers in the dipeptide model (Figs. 5 ▶,6 ▶), when side-chain interference with parts of the protein that are not represented in the model is taken into account.
The correlations are clear instances illustrating the relation between the conformation of parts of proteins and local energetics. Also, the results (Fig. 2 ▶) establish the validity of the “Boltzmann hypothesis” (Shortle 2003), according to which imperfections in protein structure follow an exponential distribution in the energy, exp (−βE), equation 1 with a factor β, equation 2 for a temperature not very different from 300 K. The distribution is one over many different environments, that are individually well determined. The observation that the distribution over many instances approaches an exponential in the energy of the isolated part is evidence that, on average, the environment neither favors nor disfavors particular instances. In actual fact, the environment is not isotropic, because every instance of a given type of structural element in a protein is bonded in identical manner to the rest of the protein, and the constant part of the environment may have a strong influence on the element’s conformational preferences.
It requires some effort to find structural elements whose distributions are not systematically skewed. The Cγ—Cδ bond in lysine and the Cγ—Sδ bond in methionine, both in linear side chains, are two bonds removed from the branch point at Cα, and for that reason are good candidates for this study. On closer inspection, the agreement between distribution and energy is imperfect even for χ3 of methionine, as the symmetry of the model C2H5—S—CH3 is nearly, but not exactly, reproduced in the distribution (Fig. 2 ▶). For the Cα–Cβ torsion angle, it was possible to reconcile distribution and energy by only considering also backbone geometry.
The sharp maxima in the distribution of χ3 of lysine and the absence of instances in the database of values at the energy maxima for butane at ±120° are characteristic of most aliphatic side-chain C—C bonds in proteins (Lovell et al. 2000) and the distribution of the Cγ–Cδ torsion angle in lysine is, therefore, quite representative. Apparent exceptions in leucine and valine can convincingly be attributed to misinterpretation of the electron density with models having reversed geometry (Lovell et al. 2000), and, otherwise, only the few instances of the mp rotamer of isoleucine suggest a distribution that is spread over a somewhat broader range. The C—S bond in methionine is special among side chains in allowing a small, but significant fraction of instances at intermediate values of χ. Torsion angles for bonds connecting sp2 and sp3 carbon atoms have very different distributions. The Cβ—Cγ bond in Asp and Asn and the Cγ—Cδ bond in Glu and Gln distribute very broadly about a value of 0° (or 180°), while those for the Cβ—Cγ bond in phenylalanine and other residues with aromatic and heterocyclic side chains distribute broadly about ±90°. Although this is qualitatively as expected from the energy profile of models (data not shown), the presence of long-range interactions between the polar side chain of the first set, and the proximity of the two δ-atoms to the backbone of the second set have led us to exclude these from consideration at this stage of our study.
We briefly mention two effects that could bias the distribution of torsion angle deviations. In the first place, side chains located on the protein surface, because of an absence of packing restraints tending to force the conformation away from the energy minimum, will tend to have more narrow distributions. However, as we have shown above, side chains exposed to solvent have higher B-values, and these are not considered in obtaining the distributions of Figure 2 ▶. In the second place, the (common) application of torsional restraints during crystallographic refinement procedures will tend to restrict the distributions to canonical values of ±60 and 180° and also to shift the mean of each of the peaks of these distributions towards its canonical value. Results presented elsewhere show that deviations of the mean values from canonical as large as 15° are reproduced by deviations from canonical values in conformations of models at the energy minima, which indicates that the effect of torsional restraints imposed during refinement is not large, at least not for well-defined atoms (G. Butterfoss, J. Richardson, and J. Hermans, in prep.).
The exponential form corresponds to a most probable distribution of the energy, and this is also the form of a Boltzmann distribution. However, the ensemble of folded proteins cannot be considered as constituting a thermal equilibrium ensemble. In an ensemble at thermal equilibrium, the Boltzmann distribution describes deviations from a mean equilibrium value, while every geometric parameter observed in any one folded protein is an equilibrium value (Bryant and Lawrence 1991; Thomas and Dill 1996; Finkelstein and Ptitsyn 2002). (An opposing view has been expressed as well [Sippl 1993].) Bürgi and Dunitz have made an analogous statement concerning geometric deviations in crystal structures of small molecules (Bürgi and Dunitz 1988), while Finkelstein et al. (1995; Finkelstein and Ptitsyn 2002) have presented one plausible rationalization of why such distributions follow an exponential dependence on the energy. A shortcoming of this particular model is that it does not permit an evaluation of the factor β in equations 1 and 2, required to fit exponentials to the observed distributions; the fact that this factor corresponds to a value of T of 300 K (which in any case is not established precisely by these results) is, at present, unexplained.
A satisfactory argument relating distributions and energy can be made on the basis of the premise that all observed folded proteins are in a conformation that is stable relative to the unfolded state, which means that the free energy of each is lower than that of the ensemble of all other conformations. The free energy of a stable folded protein structure must be below an upper bound, or else the protein remains unfolded; this requirement is met by combining a specific backbone fold with a particularly suited set of side chains. At each position some choice(s) of side chain and of rotameric state will give a lower overall free energy than others. The packing of imperfectly complementary side chains to produce the protein interior is accompanied by small adjustments of the parts that raise the internal energy of the side chain, but are globally favorable because they lower the nonbonded energy more. If the global energy cost of making all the necessary choices may not exceed a set limit, then relatively many solutions are possible that require many small adjustments, while solutions that require a few large and, consequently, many very small adjustments are rare. Qualitatively, small imperfections are more probable. An exponential distribution results if a set amount of energy is divided over an ensemble of many independent members; this is true of the Boltzmann distribution, for which the average energy determines the temperature. For the above-drawn picture of the ensemble of folded proteins, the total energy is not set, but has an upper bound. Nevertheless, an exponential distribution is a good approximation because the distribution is dominated by structures that just meet the upper bound (Taverna and Goldstein 2002). This model implies an assumption that the actually observed protein folds and their amino acid sequences are a representative sample of all possible stable globular proteins. Ramifications of the model are discussed in Finkelstein and Ptitsyn (2002).
For an exponential distribution according to equation 1, the mean energy is of the order of 1/β and with β given by equation 2 and T = 300 K, of the order of 0.6 kcal/mole. (The exact value depends on the distribution of states of different energy.) Assuming that deviations from canonical values of the torsion angles about the single bonds in a protein are independent, the overall strain energy is simply this amount times the number of C—C and C—S single bonds in side chains that are subject to packing constraints. The estimate is of the order of many kcal/mole for even a small protein, more than the net stability as characterized by the free energy of unfolding. The strain energy stored in torsion of side chains is actually only one part of the story, because, presumably, nonbonded contacts provide the forces that hold the side chains in their particular conformations, and thus the nonbonded energy is also not as low as it could be if the contact distances were optimal.
The extent of the imperfections will vary from one side chain to the next. The internal energy of a methionine or lysine side chain can vary considerably due to different amounts of strain of torsion angles and different choice of rotamer, and this will constitute one source of uncertainty in, for example, the outcome of experiments in which individual residues are replaced with alanine.
Structural details that in isolation have much higher energy than the minimum are correspondingly rare. A relation between energy and frequency of occurrence, such as derived in this study, provides a rational approach to questioning the accuracy of uncommon structural details introduced as part of structure determination, and seeking alternatives of lower energy or detecting additional interactions that stabilize the rare high-energy detail. An example of the former is provided by two side-chain conformers of leucine, denoted tt* and mp*. Analysis of structural detail indicates that these are “imposter” conformations, erroneously assigned in the model-building stage in place of the actual tp and mp conformations (Lovell et al. 2000). In agreement with that conclusion, we have found the tt* and mp* conformers of leucine to have high calculated conformational energies and also to not cluster about minima of the energy, as is the case for other observed conformers (results not shown).
Methods used in protein design and sequence-based protein structure prediction frequently make use of statistical properties of known proteins as a basis for structure optimization. This is often cast in terms of optimization of a (free) energy function obtained by inverting equation 1, expressed in terms of statistical properties, P of the ensemble of proteins of known structure (Sippl 1993). In these cases, minimization of −kBT ln P in fact amounts to maximizing a log likelihood representing the “resemblance” of the target structure with known protein structures, and the correspondence between the used free energy function and physical energetics (and the choice of value of the factor kBT) is unimportant. The situation is very different if a hybrid energy function is used, which consists in part of physical energy terms and in part of terms related to data base statistics, which must now be expressed in common units on a common scale. The results presented here provide a good basis for converting statistical distributions of side-chain conformation to corresponding energies that can be combined with other energy terms to produce a global energy function for structure optimization or protein design (Desjarlais and Handel 1995; Simons et al. 1999). (When combining such disparate energy terms, care must be taken to avoid including the same effect in more than one contribution.) Side-chain distributions for well-defined residues (atomic B-factors below 20; G. Butterfoss, J. Richardson, and J. Hermans, in prep.) in high-resolution protein structures (Lovell et al. 2000) can be converted to reliable potentials that may be useful in these applications.
Materials and methods
Energy function
We have used an accurate ab initio quantum mechanics-based method (MP2) to calculate the energies reported in this article. In addition, faster but less accurate methods were used in preliminary studies, and some of these results are reported for comparison. The ab initio calculations were done at the HF/6-31G(d) and MP2/6-311+G(d,p) levels of theory and density functional theory calculations were done at the B3LYP/6-311+G(2d,p) level of theory, with use of Gaussian 94 and Gaussian 98 (Frisch et al. 1998). The MP2 (full) option was specified and all calculations used the tight self-consistent field option. Some calculations were done with a fast semiempirical method, SCCDFTB (Porezag et al. 1995; Elstner et al. 1998; Frauenheim et al. 2000) incorporated in the Sigma molecular dynamics program (Mann et al. 2002; Hu et al. 2003).
Hartree-Fock (HF)
This is an ab initio self-consistent field method. Each electron sees the other electrons as net wave functions without consideration of correlations. Each wave function is iteratively adjusted in terms of the other electrons’ wave functions (hence, the term “self-consistent”). The wave functions are linear combinations of a basis set of Gaussian functions, the complexity of which is indicated by “6-311+G(d,p).” This is interpreted as follows: Each atom’s nonvalence electrons are represented in terms of a function (“contraction”), which itself is a linear combination of six Gaussians (6); valence electrons are represented in terms of a linear combination of a three-Gaussian and two one-Gaussian functions (311); a diffuse Gaussian is added for nonhydrogen atoms (+); to account for polarization, a d-orbital shaped term is added for nonhydrogens and a p-orbital shaped term is added for hydrogens (G[d,p]).
MP2
This method is similar to HF, but in addition includes electron correlation through second-order perturbation theory. It is the only method used here that includes long-range van der Waals attraction (dispersion) energy. This method also requires by far the longest computations. As the length of the calculations scales as the third or higher power of the number of electrons, it was possible to perform geometry optimizations with MP2 for the smaller models (butane and C2H5—S—CH3), while for the larger models (Ace-Met-Nme and Ace-Aba-Nme) geometry optimizations were done with HF, and the energy of the optimized models was then recalculated with MP2.
B3LYP
This method uses a hybrid exchange-correlation functional in density functional theory, which generally gives energies and geometries of similar accuracy as MP2, despite an absence of long-range dispersion terms, and of greater accuracy than HF with the indicated basis set, while calculation time is comparable to that for HF.
SCCDFTB
This is a very fast density-functional theory-based approximate method, and is among the highest level of quantum theory that can be reasonably applied to molecular dynamic simulations of small molecules at present (Elstner et al. 1998, 2000). We have here used this method to calibrate its results by comparison with the energies obtained with more accurate methods.
SCCDFTB has recently been used to model crambin in a 350-psec simulation and reproduced conformational details of the 0.83 Å resolution crystal structure better than similar simulations using popular molecular mechanics (MM) force fields (Liu et al. 2001). This method was also used in QM/MM simulations of short peptide helices (Cui et al. 2001) and of alanine and glycine dipeptides (Hu et al. 2003).
Model molecules
Four model structures were used: butane; ethyl methyl sulfide (EMS); the methionine dipeptide, Ace-Met-Nme; and the dipeptide of α-amino n-butyric acid, Ace-Aba-Nme. The EMS molecule is a model of the end of the methionine side chain, and its principal degree of freedom, torsion about the C—S bond, corresponds to the torsion about the C—S bond in methione (torsion angle χ3), that is, rotation about the bond farthest removed from the polypeptide backbone (ignoring torsion angles whose value depends on hydrogen coordinates), while Ace-Aba-Nme is a model of the part of the side chain closest to the backbone. The butane molecule models the energy for torsion about single C—C bonds, in the absence of substituents.
The backbone has two principal degrees of freedom. It is well known that dipeptides modeled in isolation assume preferred conformations with an internal hydrogen bond between the two peptide groups (Tobias and Brooks 1992). This C7eq conformation is not common in folded proteins, where the peptide groups generally make hydrogen bonds with peptides of residues farther removed along the chain, or with solvent molecules. To study the dipeptides, the backbone torsion angles φ and ψ were kept fixed while the side-chain conformation was varied, and this was done with several different backbone conformations typical of residues in folded proteins, as described below.
Potential energy surface of butane and C2H5—S—CH3 (EMS)
We determined the minimum potential energy surface for varying the CCSC torsion angle of EMS at various levels of theory. The HF energies are reported as part of the optimization at the MP2 level, and accordingly are for HF/6-311+G(d,p), rather than HF/6-31G(d). For SCCDFTB, a harmonic restraint of the form
 |
(4) |
with Kf equal to 600 kcal/(mole • rad2) was applied to the torsion angle, χ. The value of χo was changed in 5° increments. After each change of χo, the energy of the structure was optimized with seven cycles each of 20 steps of conjugate gradient minimization. After the minimization process, the value of χ differed from that of χo by less than 1° in all cases. The SCCDFTB calculations used a self-consistent field tolerance of 2×10⁻⁹, and the gradient of the energy was estimated with a 0.0002 Å shift in the atomic coordinates.
For the higher level methods, the geometry was optimized at 10° intervals of the CC–SC torsion angle, with the torsion angle held fixed. The defaults of the Gaussian program were used as convergence criteria for all optimizations.
Calculations for butane were done only at the MP2 level. The resulting energies at minima and maxima were very similar to those obtained by Allinger et al. (1997) with a very large basis set.
Rotameric states of methionine
Torsion about any one of the single Cα—Cβ, Cβ—Cγ, and Cγ—Sδ bonds in methionine produces three local energy minima. Thus, there are 27 distinct side-chain rotamers to consider. For each torsion angle, the minima are near −60°, 180°, and 60°, designated as, respectively, gauche− (m), trans (t), and gauche+ (p) conformations, the single-letter abbreviations having been adopted by Lovell et al. (2000). The energies of the 27 rotamers of the methionine dipeptide (Ace-Met-Nme) were calculated at the B3LYP and MP2 levels of theory as described above. These calculations were done for two different fixed backbone conformations, α-helical (φ = −60°, ψ = −40°), and β sheet (φ = −120°, ψ = 140°). Prior to optimization, initial coordinates of the dipeptide were prepared with the Sigma program using standard molecular mechanics geometry with “ideal” side-chain torsion angles of ±60° or 180°.
The results of calculations with SCCDFTB are not reported because we noted that currently available integral and spline tables for SCCDFTB produced an anomalously large attraction between the S and N atoms of the methionine dipeptide.
Rotameric states of Aba
The dipeptide of α-amino-butyric acid (Ace-Aba-Nme) was selected as the model structure for computing the energies of rotameric states about χ1. At each backbone conformation (φ,ψ) the energy of the model structure was minimized in each of three side-chain conformations (m, p, and t) with fixed values of φ and ψ at the HF level of theory, and the energy of the minimized structure was then calculated at the MP2 level (see above).
This calculation was done for backbone conformations for which at least two rotamer density surfaces were highly populated in the database; for a given backbone conformation the energies were computed only given adequate densities of at least two rotameric states, as indicated by the red areas in the first three panels of Figure 3 ▶. The selected backbone conformations are indicated in the fourth panel of this figure. In several regions in which m and t are common, the p density surface is below the cutoff: The p conformation is uncommon in the area between the α-helical and β-sheet regions, and is sterically excluded in the majority of both right- and left-handed α-helical structures. Energy differences have been computed for (φ,ψ) = (−160,170), (−120,140), (−145,150), (−130,120), (−100,155), (−60,135), (−80,145), (−130,75)*, (−90,100)*, (−100,0)*, (−60,−40)*, and (55,45)*; however, energy differences for p versus m or t have not been computed for the conformations marked with *.
Database of well-ordered residues in high-resolution structures
The database of Lovell et al. (2000, 2003) was used to extract statistics of side-chain conformation in folded proteins. This is based on 500 protein structures of 1.8 Å or better resolution; sets of well-ordered residues are extracted by restricting the atoms’ B-factors to below 20 Å2 (G. Butterfoss, J. Richardson, and J. Hermans, in prep.).
Methionine is a fairly uncommon residue; thanks to a rapidly growing number of high-resolution crystal structures, the number of methionine residues in the database used here is 2145, of which 998 remain when only those containing atoms with B-factors below 20 Å2 are included.
Two sets of methionine residues with specific backbone structure were selected from the entire database. A set of 680 α-helix rotamers was obtained by selecting all residues listed as having an “α-helix” or “α-helix ext” secondary structure as assigned by the DSSP program (Kabsch and Sander 1983) and for which −80 > φ > −40 and −60 > ψ > −20. A set of 562 β-sheet rotamers was obtained by selecting all residues that had backbone conformations within 40° of (φ,ψ) = (−120,140). (DSSP secondary structure assignments were not considered in this selection).
The database was used to extract a set containing lysine residues with atomic B-factors below 20 Å2 and of these a subset containing those for which the conformation about the Cβ–Cγ and Cδ—Cɛ bonds is trans (522 residues).
The database was also used to extract a set containing all well-defined Met, Glu, Gln, Arg, and Lys (23,620 residues).
Surface exposure of methionine and lysine
Surface exposure of individual side chains was determined from the size of solvent-accessible surface area determined with the MS program (Connolly 1983a,b). A small probe of radius 0.2 Å was used, and contact points for each of the four atoms defining the torsion angle (Cβ, Cγ, Sδ, Cɛ for methionine and Cβ, Cγ, Cδ, Cɛ for lysine) were counted and the numbers added. This was done for all residues in the database; the results were sorted according to atomic B-factors, and averages were calculated for successive ranges of B.
Density surfaces for χ1
The experimental data set consisted of the side-chain conformations of amino acids having methylene β and γ carbons (Met, Glu, Gln, Arg, Lys) in the library of high-resolution protein structures (Lovell et al. 2003). Each individual rotamer was assigned to one of three subsets, depending on its value of χ1, and this produced three sets of, respectively, 13,971 m conformations, 2009 p conformations, and 7640 t conformations. For each of these subsets, a smooth density surface over Ramachandran space was calculated with a previously described density-dependent smoothing algorithm (Lovell et al. 2003). Briefly, an initial density surface is generated as a sum of identical locally restricted cosine “masks” centered on each conformation in the set,
 |
with γ a normalization factor, and in a second round of iteration the width of each mask is adjusted, depending on the local density calculated in the first round. The final density surface was calculated on a 5 × 5° grid.
Acknowledgments
We thank Jane and David Richardson and Bryan Arendall for supplying extracts of the database of high-resolution proteins. We thank Jane Richardson for comments on the manuscript. This work was supported by a research grant from the National Center for Research Resources, NIH (RR08012).
The publication costs of this article were defrayed in part by payment of page charges. This article must therefore be hereby marked “advertisement” in accordance with 18 USC section 1734 solely to indicate this fact.
Article and publication are at http://www.proteinscience.org/cgi/doi/10.1110/ps.03273303.
References
- Allinger, N.L., Fermann, J.T., Allen, W.D., and Schaefer III, H.F. 1997. The torsional conformations of butane: Definitive energetics from ab initio methods. J. Chem. Phys. 106 5143–5150. [Google Scholar]
- Bryant, S.H. and Lawrence, C.E. 1991. The frequency of ion-pair substructures in proteins is quantitatively related to electrostatic potential: A statistical model for nonbonded interactions. Proteins 9 108–119. [DOI] [PubMed] [Google Scholar]
- Bürgi, H.B. and Dunitz, J.D. 1988. Can statistical analysis of structural parameters from different crystal environments lead to quantitative energy relationships? Acta Crystallogr. B 44 445–448. [Google Scholar]
- Burley, S.K. and Petsko, G.A. 1985. Aromatic–aromatic interaction: A mechanism of protein structure stabilization. Science 229 23–28. [DOI] [PubMed] [Google Scholar]
- Chakrabartty, A., Kortemme, T., and Baldwin, R.L. 1994. Helix propensities of the amino acids measured in alanine-based peptides without helix-stabilizing side-chain interactions. Protein Sci. 3 843–852. [DOI] [PMC free article] [PubMed] [Google Scholar]
- Chou, P.Y. and Fasman, G.D. 1978. Prediction of the secondary structure of proteins from their amino acid sequence. Adv. Enzymol. 47 45–148. [DOI] [PubMed] [Google Scholar]
- Connolly, M.L. 1983a. Analytical molecular surface calculation. J. Appl. Crystallogr. 16 548–558. [Google Scholar]
- ———. 1983b. Solvent-accessible surfaces of proteins and nucleic acids. Science 221 709–713. [DOI] [PubMed] [Google Scholar]
- Cui, Q., Elstner, M., Kaxiras, E., Frauenheim, T., and Karplus, M. 2001. A QM/MM implementation of the self-consistent-charge density functional tight binding (SCC-DFTB) method. J. Phys. Chem. B 105 569–585. [DOI] [PubMed] [Google Scholar]
- Desjarlais, J.R. and Handel, T.M. 1995. De novo design of the hydrophobic cores of proteins. Protein Sci. 4 2006–2018. [DOI] [PMC free article] [PubMed] [Google Scholar]
- Dunbrack, R.L. and Cohen, F.E. 1997. Bayesian statistical analysis of protein side chain rotamers in proteins. Protein Sci. 6 1661–1681. [DOI] [PMC free article] [PubMed] [Google Scholar]
- Dunbrack, R.L. and Karplus, M. 1993. Backbone-dependent rotamer library for proteins: Application to side chain prediction. J. Mol. Biol. 230 543–571. [DOI] [PubMed] [Google Scholar]
- ———. 1994. Conformational analysis of the backbone-dependent rotamer preference of protein side chains. Nat. Struct. Biol. 1 334–340. [DOI] [PubMed] [Google Scholar]
- Durig, J.R., Compton, D.A.C., and Jailian, M.R. 1979. Analysis of torsional spectra of molecules with two internal C3v rotors. 11. Low frequency vibrational spectra, methyl torsional potential functions, and internal rotation of ethyl methyl sulfide. J. Phys. Chem. 83 511–515. [Google Scholar]
- Durig, J.R., Rollins, M.S., and Phan, H.V. 1991. Conformational stability, barriers to internal rotation, ab initio calculations and vibrational assignment of ethyl methyl sulfide. J. Mol. Struct. 263 95–122. [Google Scholar]
- Elstner, M., Porezag, D., Jungnickel, G., Elsner, J., Haugk, M., Frauenheim, T., Suhai, S., and Seifert, G. 1998. Self-consistent charge density functional tight-binding method for simulation of complex material properties. Phys. Rev. B 58 7260–7268. [Google Scholar]
- Elstner, M., Frauenheim, T., Kaxiras, E., Seifert, G., and Suhai, S. 2000. A self-consistent charge density-functional based tight-binding scheme for large biomolecules. Phys. Status Solidi B 217 357–376. [Google Scholar]
- Finkelstein, A.V. and Ptitsyn, O.B. 2002. Lecture 16. In Protein physics, pp. 189–203. Academic Press-Elsevier Science, Amsterdam.
- Finkelstein, A.V., Batretdinov, A.Y., and Gutin, A.M. 1995. Why do protein architectures have Boltzmann-like statistics? Proteins 23 142–150. [DOI] [PubMed] [Google Scholar]
- Frauenheim, T., Seifert, G., Elstner, M., Hajnal, Z., Jungnickel, G., Porezag, D., Suhai, S., and Scholz, R. 2000. A self-consistent charge density-functional based tight-binding method for predictive materials simulations in physics, chemistry and biology. Phys. Status Solidi B 217 41–62. [Google Scholar]
- Frisch, M.J., Trucks, G.W., Schlegel, H.B., Scuseria, G.E., Robb, M.A., Cheeseman, J.R., Zakrzewski, V.G., Montgomery, J.A., Stratmann, R.E., Burant, J.C., et al. 1998. Gaussian 98. Gaussian, Inc., Pittsburgh, PA.
- Görbitz, C.H. 1994. Conformational properties of disulphide bridges. 2. Rotational potentials of diethyl disulphide. J. Phys. Org. Chem. 7 259–267. [Google Scholar]
- Hayashi, H., Shimanuchi, T., and Mizushima, S. 1957. Raman and infrared spectra of 2-thiabutane. J. Chem. Phys. 26 608–612. [Google Scholar]
- Hu, H., Elstner, M., and Hermans, J. 2003. Comparison of a QM/MM force field and molecular mechanics force fields in simulations of alanine and glycine “dipeptides” (Ace-Ala-Nme and Ace-Gly-Nme) in water in relation to the problem of modeling the unfolded peptide backbone in solution. Proteins 50 451–463. [DOI] [PubMed] [Google Scholar]
- Iwaoka, M., Takemoto, S., and Tomoda, S. 2002. Statistical and theoretical investigations on the directionality of nonbonded S•••O interactions. Implications for molecular design and protein engineering. J. Am. Chem. Soc. 43 10613–10620. [DOI] [PubMed] [Google Scholar]
- Kabsch, W. and Sander, C. 1983. Dictionary of protein structure: Pattern recognition of hydrogen-bonded and geometrical features. Biopolymers 22 2577–2637. [DOI] [PubMed] [Google Scholar]
- Lipsitz, R.S., Sharma, Y., Brooks, B.R., and Tjandra, N. 2002. Hydrogen bonding in high-resolution protein structures: A new method to assess NMR protein geometry. J. Am. Chem. Soc. 43 10621–10626. [DOI] [PubMed] [Google Scholar]
- Liu, H., Elstner, M., Kaxiras, E., Frauenheim, T., Hermans, J., and Yang, W. 2001. Quantum mechanics simulation of protein dynamics on long time scale. Proteins 44 484–489. [DOI] [PubMed] [Google Scholar]
- Lovell, S.C., Word, J.M., Richardson, J.S., and Richardson, D.C. 2000. The penultimate rotamer library. Proteins 40 389–408. [PubMed] [Google Scholar]
- Lovell, S.C., Davis, I.W., Arendall, W.B., de Bakker, P.I.W., Word, J.M., Prisant, M.G., Richardson, J.S., and Richardson, D.C. 2003. Structure validation by Cα geometry: φ, ψ and Cβ deviation. Proteins 50 437–450. [DOI] [PubMed] [Google Scholar]
- Mann, G., Yun, R.H., Nyland, L., Prins, J., Board, J., and Hermans, J. 2002. The Sigma MD program and a generic interface applicable to multi-functional programs with complex, hierarchical command structure. In Computational methods for macromolecules: Challenges and applications—Proceedings of the 3rd International Workshop on Algorithms for Macromolecular Modelling, New York, October 12–14, 2000 (eds. T. Schlick and H.H. Gan), pp. 129–145. Springer-Verlag, Berlin.
- Matta, C.F. and Bader, R.F.W. 2002. Atoms-in-molecules study of the genetically encoded amino acids. II. Computational study of molecular geometries. Proteins 48 519–538. [DOI] [PubMed] [Google Scholar]
- Nogami, N., Sugeta, H., and Miyazawa, T. 1975. Vibrational spectra and molecular structure of ethyl methyl sulfide. Bull. Chem. Soc. Jpn. 48 3573–3575. [Google Scholar]
- O’Neil, K.T. and DeGrado, W.F. 1990. A thermodynamic scale for the helix-forming tendencies of the commonly-occurring amino-acids. Science 250 646–656. [DOI] [PubMed] [Google Scholar]
- Oyanagi, K. and Kuchitsu, K. 1978. Molecular structure and conformation of ethyl methyl sulfide as studied by gas electron diffraction. Bull. Chem. Soc. Jpn. 51 2243–2248. [Google Scholar]
- Pohl, F.M. 1971. Empirical protein energy maps. Nat. New Biol. 234 277–279. [DOI] [PubMed] [Google Scholar]
- Ponder, J.W. and Richards, F.M. 1987. Tertiary templates for proteins, use of packing criteria in the enumeration of allowed sequences for different structural classes. J. Mol. Biol. 193 775–791. [DOI] [PubMed] [Google Scholar]
- Porezag, D., Frauenheim, T., and Köhler, T. 1995. Construction of tight-binding-like potentials on the basis of density-functional theory: Application to carbon. Phys. Rev. B 51 12947–12957. [DOI] [PubMed] [Google Scholar]
- Qian, W. and Krimm, S. 1993. Energetics of the disulfide bridge: An ab initio study. Biopolymers 33 1591–1603. [Google Scholar]
- Ramachandran, G.N. and Sasisekharan, V. 1968. Conformation of polypeptides and proteins. Adv. Protein Chem. 23 283–438. [DOI] [PubMed] [Google Scholar]
- Rashin, A.A., Rashin, B.H., Rashin, A., and Abagyan, R. 1997. Evaluating the energetics of empty cavities and internal mutations in proteins. Protein Sci. 6 2143–2158. [DOI] [PMC free article] [PubMed] [Google Scholar]
- Richards, F.M. 1977. Areas, volumes, packing and protein structure. Annu. Rev. Biophys. Bioeng. 6 151–176. [DOI] [PubMed] [Google Scholar]
- Richards, F.M. and Lim, W.A. 1994. An analysis of packing in the protein folding problem. Q. Rev. Biophys. 26 423–498. [DOI] [PubMed] [Google Scholar]
- Sakakibara, M., Matsurra, H., Harada, I., and Shimanouchi, T. 1977. Vibration spectra and rotational isomerism of chain molecules. III. Ethyl methyl sulfide deuterium compounds. Bull. Chem. Soc. Jpn. 50 111–115. [Google Scholar]
- Scheiner, S., Kar, T., and Pattanayak, J. 2002. Comparison of various types of hydrogen bonds involving aromatic amino acids. J. Am. Chem. Soc. 124 13257–13264. [DOI] [PubMed] [Google Scholar]
- Shortle, D. 2003. Propensities, probabilities and the Boltzmann hypothesis. Protein Sci. 12 1298–1302. [DOI] [PMC free article] [PubMed] [Google Scholar]
- Simons, K.T., Bonneau, R., Ruczinski, I., and Baker, D. 1999. Ab initio protein structure prediction of CASP III targets using ROSETTA. Proteins 37(Suppl 3) 171–176. [DOI] [PubMed] [Google Scholar]
- Sinnokrot, M.O., Valeev, E.F., and Sherrill, C.D. 2002. Estimates of the ab initio limit for π–π interactions: The benzene dimer. J. Am. Chem. Soc. 124 10887–10893. [DOI] [PubMed] [Google Scholar]
- Sippl, M.J. 1993. Boltzmann’s principle, knowledge-based mean fields, and protein folding. An approach to the computational determination of protein structures. J. Comput. Aided Mol. Des. 7 473–501. [DOI] [PubMed] [Google Scholar]
- Taverna, D.M., and Goldstein, R.A. 2002. Why are proteins marginally stable? Proteins 46 105–109. [DOI] [PubMed] [Google Scholar]
- Thomas, P.D. and Dill, K.A. 1996. Statistical potentials extracted from protein structures: How accurate are they? J. Mol. Biol. 257 457–469. [DOI] [PubMed] [Google Scholar]
- Tobias, D.J. and Brooks, C.L. 1992. Conformational equilibrium in the alanine dipeptide in the gas phase and aqueous solution—A comparison of theoretical results. J. Phys. Chem. 96 3864–3870. [Google Scholar]
- Tsuzuki, S., Uchimaru, T., and Tanabe, K. 1996. Conformational energy profiles of n-butane, ethyl methyl ether and ethyl methyl sulfide. Comparison of electron correlation procedures. J. Mol. Struct. 336 89–96. [Google Scholar]
- Tsuzuki, S., Honda, K., Uchimaru, T., Mikami, M., and Tanabe, K. 2002. Origin of attraction and directionality of the π/π interaction: Model chemistry calculations of benzene dimer interaction. J. Am. Chem. Soc. 124 104–112. [DOI] [PubMed] [Google Scholar]
- Word, J.M., Lovell, S.C., LaBean, T.H., Taylor, H.C., Zalis, M.E., Presley, P.K., Richardson, J.S., and Richardson, D.C. 1999. Visualizing and quantifying molecular goodness-of-fit: Small-probe contact dots with explicit hydrogen atoms. J. Mol. Biol. 285 1711–1733. [DOI] [PubMed] [Google Scholar]