Abstract
Introduction
T-wave alternans (TWA) is characterized by beat to beat alteration in the amplitude, polarity and/or morphology of the electrocardiographic T wave. TWA has been reported in patients with the Brugada syndrome (BS) and is thought to be associated with an increased risk for development of VT/VF. The cellular mechanisms involved are not well-defined and are the subject of this investigation.
Methods
In an experimental model of BS composed of an arterially perfused canine right ventricular wedge preparation pretreated with verapamil (1–7 μM), an agent with sodium and calcium channel blocking activity, we simultaneously recorded transmembrane action potentials from two epicardial and one endocardial site, together with a pseudo-ECG. At select frequencies, verapamil induced alternans of both the T-wave amplitude and QT interval. The alternans resulted from either loss of the epicardial action potential dome on alternate beats or concealed phase 2 reentry within the epicardium on alternate beats. Loss of the epicardial action potential dome significantly increased transmural dispersion of repolarization (TDR) when compared with control (18.0 ± 7.8 ms vs. 82.1 ± 16.8 ms, P < 0.001, n = 8). During alternans, TDR was greater in beats displaying a more negative T wave (55.1 ± 45.2 ms vs. 89.8 ± 39.3 ms, P < 0.001, n = 22 data points from 8 preparations).
Conclusions
Our data indicate that TWA in an experimental model of the Brugada syndrome is due to alternating loss of the epicardial AP dome and/or concealed phase 2 reentry, both serving to increase TDR and create the substrate for the development VT/VF.
Keywords: arrhythmia, sudden cardiac death, T wave, alternans, electrocardiogram
Introduction
The Brugada syndrome is an autosomal dominant inherited disease with incomplete penetrance associated with sudden cardiac death occurring in otherwise healthy individuals. Over 100 mutations in SCN5A, the gene encoding for the alpha subunit of the cardiac sodium channel, have been described to date (for review, see Refs. 1–5); however, the genetic basis of approximately 80% of Brugada syndrome patients remains unknown.6 Electrocardiographically, the syndrome is most often characterized by ST segment elevation in the right precordial leads, which is often concealed.
There is mounting clinical and experimental evidence demonstrating the arrhythmogenic mechanism of the syndrome related to the transient outward current (Ito)-mediated action potential notch, which is most prominent in the right ventricular epicardium and largely absent in the endocardium.7–12 Any disruption leading to a negative shift in the balance of currents active at the end of phase 1 of the epicardial action potential can result in an all-or-none repolarization at the end of phase 1 in some epicardial sites but not others. The resulting voltage gradient between the abnormally abbreviated epicardial response and the relatively normal endocardial action potential generates an ST segment elevation and the substrate for reentrant arrhythmias. Propagation of the dome from sites where it is maintained to sites where it has been lost gives rise to phase 2 reentry, thus providing the trigger that captures the vulnerable window of dispersion, giving rise to polymorphic ventricular tachycardia and fibrillation (VT/VF).
Several clinical reports describe T-wave alternans in the setting of the Brugada syndrome, particularly following exposure to sodium channel blockers.13–20 Experimental studies suggest the underlying mechanism for T-wave alternans is fluctuations in the height of the epicardial action potential dome21 and/or concealed phase 2 reentry on alternating beats;9 however, thorough investigation of this phenomenon is lacking. In the present study, we explore this mechanism in more detail and test the hypothesis that T-wave alternans can be due to both loss of the epicardial action potential dome on alternate beats or to concealed phase 2 reentry.
Methods
The detailed methods employed for isolation, perfusion, and recording of transmembrane activity from the arterially perfused canine right ventricular wedge preparation, as well as the viability and electrical stability of the preparation, have been previously reported.7,22
Briefly, transmural wedge preparations with dimensions of approximately 2 × 1 × 0.9 cm to 3.0 × 1.5 × 1.2 cm were dissected from the right ventricle of male and female random source 20–35 kg canines. The preparations were cannulated via a small (diameter approximately 100–150 μm) coronary artery (a descending branch of the right coronary artery) and perfused with cardioplegic solution (Tyrode’s containing 12 mM KCl). Unperfused tissue was carefully removed using a razor blade. The preparations were then placed in a small tissue bath and arterially-perfused with Tyrode’s solution. The temperature of the coronary perfusate was maintained at 35 ± 0.5°C. The perfusate was delivered to the artery by a roller pump (Cole Parmer Instrument Co., Niles, IL, USA). Perfusion pressure was monitored with a pressure transducer (World Precision Instruments Inc., Sarasota, FL, USA) and maintained between 40 and 50 mm Hg by adjustment of the perfusion flow rate.
The wedge preparations were equilibrated in the tissue bath until electrically stable, usually 1–2 hours. The preparations were continuously stimulated at a basal cycle length of 2,000 ms using bipolar silver electrodes insulated except at the tips and applied to the endocardial surface. A transmural electrocardiogram (ECG) was recorded using electrodes consisting of 2 AgCl half cells placed in the Tyrode’s solution bathing the preparation, 1.0–1.5 cm from the epicardial and endocardial surfaces of the preparation, along the same axis as the transmembrane recordings (Epicardium: “+” pole). Transmembrane action potentials were simultaneously recorded from two epicardial and one endocardial site using floating microelectrodes (DC resistance = 10–20 MΩ) filled with 2.7 M KCl, each connected to a high-input impedance amplifier. Impalements were obtained from the epicardial and endocardial surfaces of the preparation at positions approximating the transmural axis of the ECG recording. When two simultaneous epicardial impalements were recorded, the one with the longer APD was designated as Epi 1, while the other was designated as Epi 2. The two epicardial impalements were separated by 2–10 mm.
The Brugada syndrome phenotype was induced by administration of verapamil (1–7 μM) added directly to the coronary perfusate. This model of the Brugada syndrome was first described by our group in a previous study.11 Verapamil was initiated at the low end of the dose range and the pacing cycle length was varied between 300—2,000 ms. If loss of the epicardial dome could not be induced at any cycle length, the dose of verapamil was increased and the pacing cycle lengths were again scanned.
In four preparations, the transient outward current (Ito) was blocked using 4-aminopyrridine (4-AP, 0.5 mM) after T-wave alternans was induced using verapamil. In these experiments, 4-AP was added directly to the arterial perfusate already containing verapamil.
Data Selection
For quantitative analysis, N and N + 1 beats were selected based on the following criteria: alternans was observed under steady state conditions for at least 30 seconds, the T wave was measurable, and simultaneous impalements from two epicardial and one endocardial site were available. Two experiments were excluded from quantitative analysis because the T waves could not be accurately measured.
Statistics
All statistical analysis was performed using SigmaStat 2.03 (Access Softek, Systat Software Inc., San Jose, CA, USA). Paired data were compared using the paired or unpaired t-test or Wilcoxon Signed Rank test as appropriate, whereas regression values were generated using the linear regression function of the software. All average data is presented as mean ± SD.
Results
T-wave alternans was not observed under control conditions (Table 1). By virtue of its ability to block ICa and late INa, verapamil induced loss of the epicardial action potential dome, which at select frequencies occurred on alternate beats, creating a large beat to beat variability in epicardial action potential duration (APD) (Fig. 1B). In the face of a constant endocardial response, the alternation of epicardial APD led to the development of T-wave alternans (TWA). The ST segment, measured 50 ms after the end of the QRS, was significantly elevated during alternans, compared with control (Table 1). TWA was abolished at slower rates due to normal appearance of the dome in all beats (Fig. 1A), as well as at faster rates, due to loss of the epicardial action potential dome in all beats (Fig. 1C). Similar results were observed in 10 out of 10 experiments.
TABLE 1.
Maximum TDR and Beat to Beat Changes in APD90, T-wave Amplitude, and QT Interval
| Control | Verapamil (1–7 μM) | |
|---|---|---|
| TDR max (ms) | 18.0 ±7.8 | 82.1 ± 16.8† |
| ΔT-wave amplitude max (mV) | 0.00 ± 0.00 | 0.47 ± 0.37‡ |
| ΔQT interval max (ms) | 3.3 ± 4.5 | 66.3 ± 44.3‡ |
| ΔEpi APD90 (ms) | 2.4 ±1.6 | 112.3 ± 31.9‡ |
| ΔEndo APD90 (ms) | 0.65 ± 0.6 | 2.5 ± 3.6 |
| ST segment (mV, 50 ms after end of QRS) | −0.08 ± 0.08 | 0.06 ± 0.08† |
P < 0.01;
P < 0.001; n = 8.
TDR = transmural dispersion of repolarization; APD90 = action potential duration at 90% repolarization; Endo = endocardium; Epi = epicardium.
Figure 1.
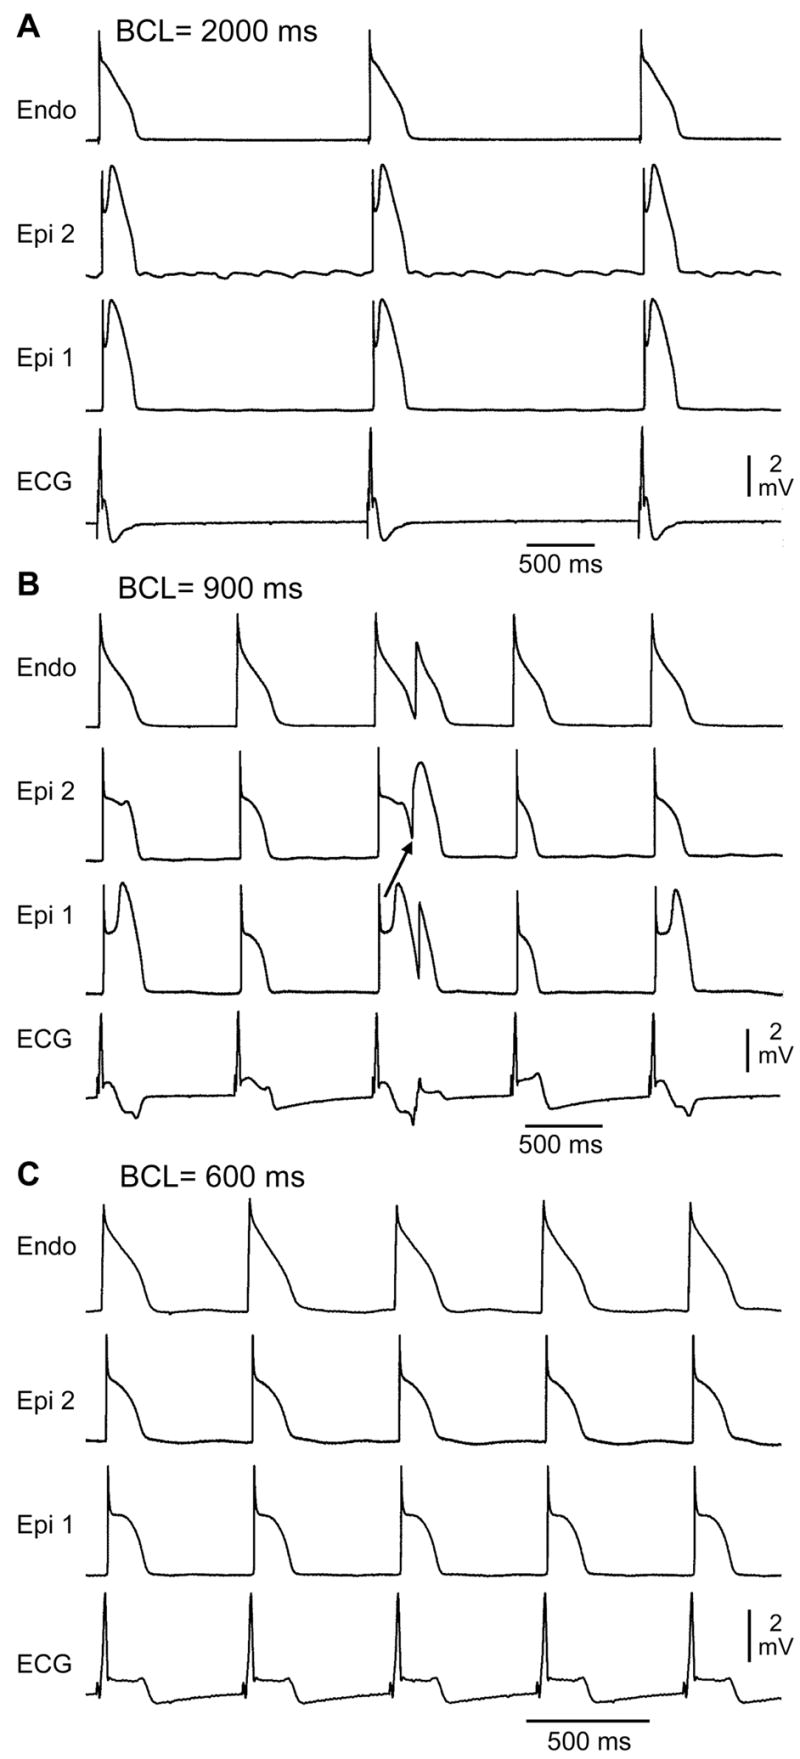
Verapamil (1 μM)-induced loss of the epicardial action potential dome in alternate beats causes T-wave alternans in a canine arterially perfused right ventricular wedge preparation. A: At a BCL of 2,000 ms, endocardial and epicardial action potentials repolarize almost simultaneously, generating little or no T wave on the ECG. B: Decreasing the cycle length to 900 ms induces heterogeneous loss of the epicardial action potential dome in alternate beats while the endocardial response remains constant, resulting in profound T-wave alternans. C: Decreasing the cycle length to 600 ms leads to homogeneous loss of the action potential dome on all beats, leading to ST segment elevation but no T-wave alternans in the ECG. Similar results were observed in 10/10 experiments.
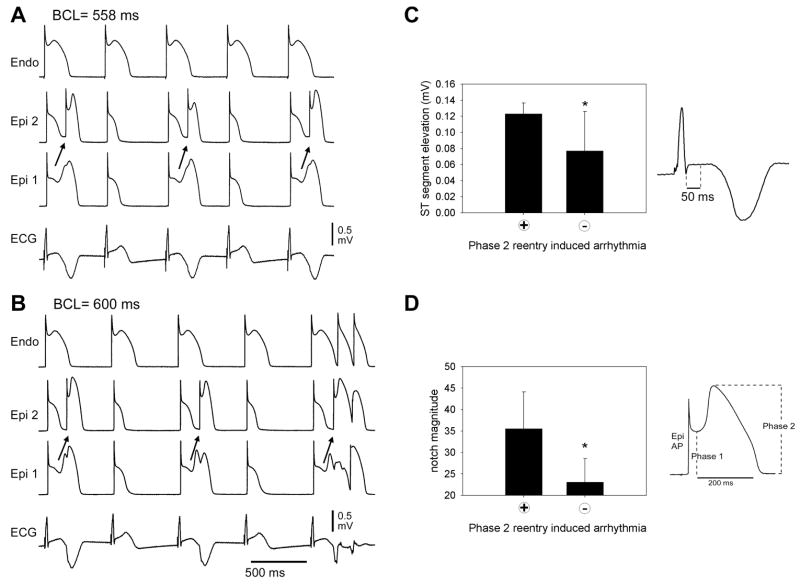
In five preparations, loss of the dome occurred heterogeneously on alternate beats, creating a local epicardial dispersion of repolarization (EDR). In these preparations, propagation of the epicardial action potential dome from regions in which it was maintained to regions in which it was lost created a reentrant beat that was confined to the epicardium and did not re-excite the rest of the myocardial preparation. As the pacing rate was altered, the phase relationship of the concealed phase 2 reentrant beat and the endocardial response shifted, allowing the phase 2 reentrant beat to propagate across the wall and generate a closely coupled extrasystole (Fig. 2). Transmural conduction succeeded when the coupling interval of the phase 2 reentrant beat prolonged enough to clear the refractory period of the cells in the M and endocardial regions of the ventricular wall. Alternans of the QT interval was observed as the repolarization gradient reversed in alternate beats, with a positive T-wave manifest when endocardium repolarized last and a negative T-wave manifest when epicardium repolarized last or in the presence of concealed phase 2 reentry. The ST segment was significantly more elevated during alternans due to concealed phase 2 reentry, compared with alternans due to alternating loss of the epicardial action potential dome (P = 0.027). The epicardial action potential notch recorded under control conditions at a BCL of 2,000 ms was significantly larger in preparations displaying concealed phase 2 reentry versus those that did not (P = 0.025).
Figure 2.
Verapamil (1 μM)-induced concealed phase 2 reentry in alternate beats leading to T-wave alternans. A: T-wave alternans occurs as a result of concealed phase 2 reentry. The dome propagates from Epi 1 to Epi 2 on alternating beats while the endocardial response remains constant. The concealed phase 2 reentry results in a negative T wave. BCL = 558 ms. B: Increasing the cycle length to 600 ms exaggerates the T-wave alternans. The phase relationship between Epi 1, Epi 2, and Endo shifts slightly, allowing the previously concealed phase 2 reentry to propagate transmurally, leading to two extrasystoles. Similar results were observed in 5/10 experiments. C: The ST segment elevation, measured 50 ms after the end of the QRS, is greater during alternans secondary to concealed phase 2 reentry, compared with alternans due to alternating loss of the epicardial action potential dome (n = 10 phase 2 reentry + and 12 phase 2 reentry – episodes, *P = 0.027) D: The size of the epicardial action potential notch magnitude (ph2 amp–ph1 amp/ph 2 amp) at BCL 2,000 ms during control was significantly smaller in preparations not displaying phase 2 reentry-induced arrhythmias versus those that did (n = 5 for each category, *P = 0.025).
When compared with control, verapamil increased the maximum observed beat to beat alternans in T-wave amplitude (0.00 ± 0.00 mV to 0.47 ± 0.37 mV, P < 0.001, n = 8), QT interval (3.3 ± 4.5 ms to 66.3 ± 44.3 ms, P < 0.001, n = 8), and epicardial APD90 (2.4 ± 1.6 ms to 112.3 ± 31.9 ms, P < 0.001, n = 8); however, endocardial APD90 was unaffected (0.65 ± 0.6 ms to 2.5 ± 3.6 ms, P = NS, n = 8). Verapamil also increased the maximum observed transmural dispersion of repolarization (TDR) from (18.0 ± 7.8 ms to 82.1 ± 16.8 ms, P < 0.01, n = 8), compared with control. (Table 1)
To assess APD, QT, and T-wave alternans, the shorter beat of the alternans (N) was compared with the longer beat (N + 1, Fig. 3, Table 2). Data for both mechanisms of T-wave alternans were combined for this analysis. In the case of alternans induced by concealed phase 2 reentry, alternans in the epicardial site not displaying the concealed phase 2 reentry was analyzed. TDR, however, was calculated as the maximal difference in repolarization time between epicardium and endocardium, thus providing a measure of the full extent of the arrhythmogenic substrate created. On the N + 1 beat, the T wave was significantly more negative than the N beat (0.01 ± 0.15 mV vs. −0.60 ± 0.21 mV, P < 0.001, n = 22 data points from 8 preparations). The epicardial APD at 90% repolarization (APD90) of N+1 was significantly longer than that of N (138.6 ± 38.5 ms vs. 263.1 ± 34.2 ms, P < 0.001, n = 22 data points from 8 preparations), whereas the APD90 of endocardium remained unchanged (208.2 ± 18.2 vs. 210.4 ± 18.1, P = NS, n = 22 data points from 8 preparations) (Table 2). The beat to beat changes in epicardial APD90 were positively correlated with both the beat to beat changes in the T-wave amplitude and the QT interval (R = 0.87 and 0.91, respectively, P < 0.001 for both, n = 22 data points from 8 preparations) (Fig. 3C and D).
Figure 3.
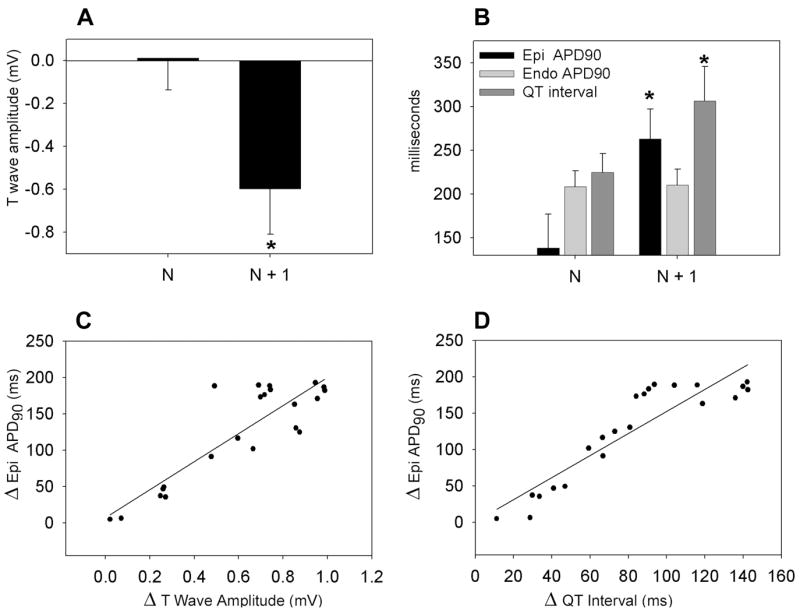
A: Verapamil-induced alternation of T-wave amplitude. B: QT interval, epicardial and endocardial action potential duration (APD90) (*P < 0.001 vs. N). C: Correlation between beat to beat variations in T-wave amplitude (ΔT-wave amplitude) and in epicardial APD90 (Δ Epi APD90, R = 0.87, P < 0.001). D: Correlation between the beat to beat variations in QT interval (ΔQT interval) and epicardial APD90 (Δ Epi APD90, R = 0.91, P < 0.001) 22 data points from 8 preparations.
TABLE 2.
APD90, TDR, QT Interval, and T-Wave Amplitude on Short (N) and Long (N+1) Action Potential Responses During Alternans Induced by Verapamil (1–7 μM)
| Verapamil (1–7 μM) | N | N + 1 |
|---|---|---|
| QT interval (ms) | 224.8 ± 21.6 | 306.3 ± 39.1‡ |
| T-wave amplitude (mV) | 0.01 ± 0.15 | −0.60 ± 0.21‡ |
| Epi APD90 (ms) | 138.6 ± 38.5 | 263.1 ± 34.2‡ |
| Endo APD90 (ms) | 208.2 ± 18.2 | 210.4 ± 18.1 |
| TDR (ms) | 55.1 ± 45.2 | 89.8 ± 39.3‡ |
P < 0.001; n = 22 data points from 8 preparations.
TDR = transmural dispersion of repolarization; APD90 = action potential duration at 90% repolarization; Endo = endocardium; Epi = epicardium.
The TDR for the N + 1 beat was significantly greater than that of the N beat (Fig. 4). In the case of N, the T wave is positive and TDR is defined by the interval between the repolarization of the shortened epicardial action potential that has lost the dome and that of the endocardial action potential. With N+1, the T wave is deeply negative and TDR is defined by the interval between repolarization of the epicardial response in which the dome is restored or the repolarization of the concealed reentrant beat within the epicardium and that of the endocardial action potential. The T peak–T end and T nadir–T end interval were closely correlated with TDR (R = 0.97, P < 0.001, n = 44 data points from 8 preparations) (Fig. 4B).
Figure 4.
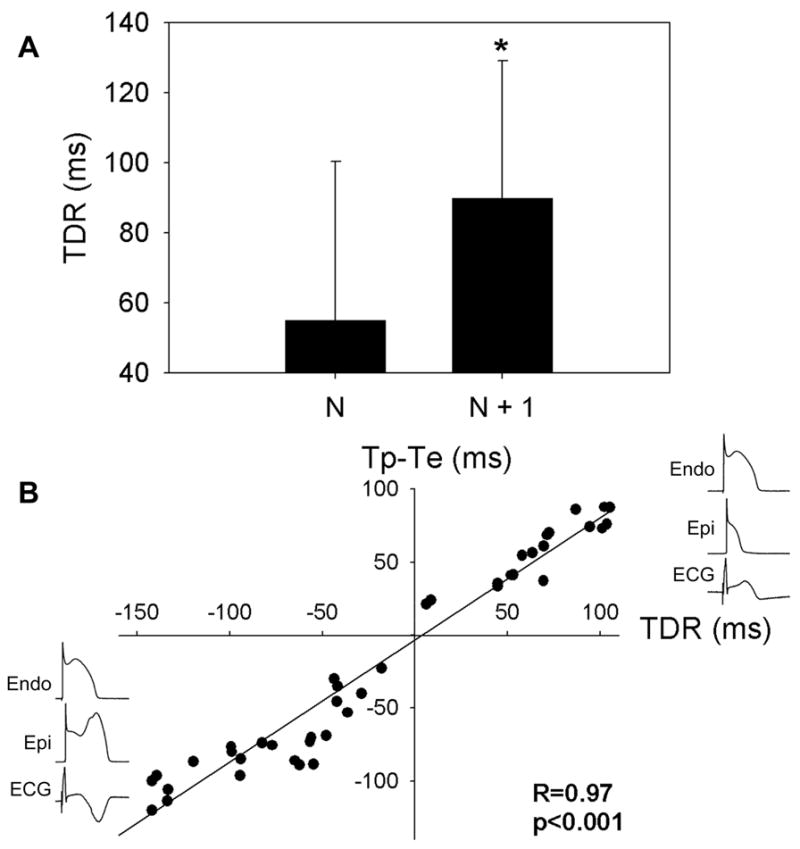
A: Transmural dispersion of repolarization (TDR), the difference in repolarization time between the briefest epicardial and endocardial response during loss of the dome or the difference in repolarization time between the endocardial and prolonged epicardial response, is significantly greater during the beat with the negative T wave (N + 1). B: Correlation between the T peak (when T wave is positive) or T nadir (when T wave is negative) to T end interval (Tp-Te) and TDR. Twenty-two data points from 8 preparations.
Pronounced alternans of T-wave amplitude and QT interval was associated with a greater propensity for the development of arrhythmia, as is illustrated in Figure 5. Progressive acceleration of the pacing rate was accompanied by the development of T-wave and QT alternans and an increase in the incidence of closely coupled phase 2 reentrant extrasystoles from 0% to 15%.
Figure 5.
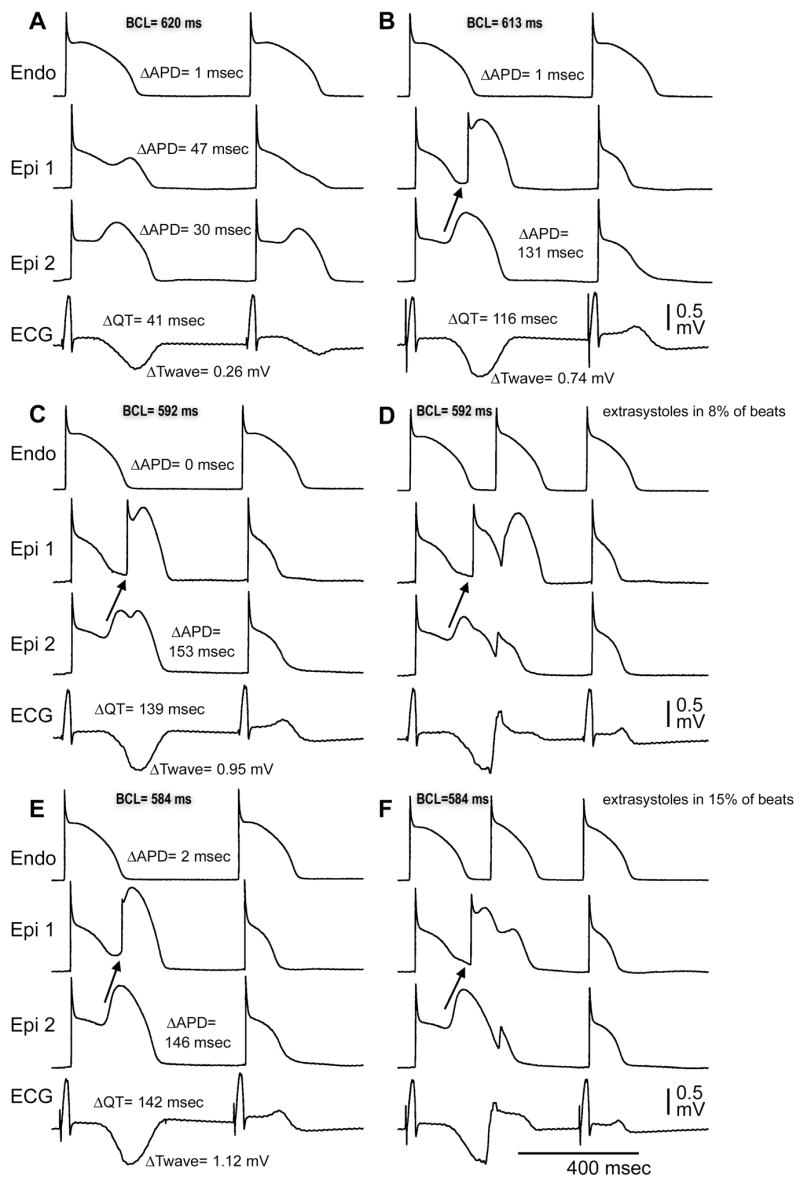
Rate-dependent accentuation of T-wave and QT alternans is associated with an increased frequency of extrasystoles. A: BCL = 620 ms. Loss of the Epi AP dome on alternate beats underlies T-wave alternans (TWA). B: BCL = 613 ms. Concealed phase 2 reentry in alternate beats further accentuates TWA. C and D: BCL = 592 ms. At this rate, phase 2 reentry gives rise to closely coupled extrasystoles at a frequency of 5/62 beats (8%) E and F. BCL = 584 ms. At this rate, extrasystoles occur at a frequency of 13/85 beats (15%).
Block of the transient outward current (Ito) with 4-aminopyrridine (4-AP, 0.5 mM) restored the epicardial action potential dome, thus eliminating T-wave alternans and the development of phase 2 reentry at all basic cycle lengths (Fig. 6). Polymorphic VT reappeared following washout of 4-AP. Similar results were observed in 4 out of 4 experiments.
Figure 6.
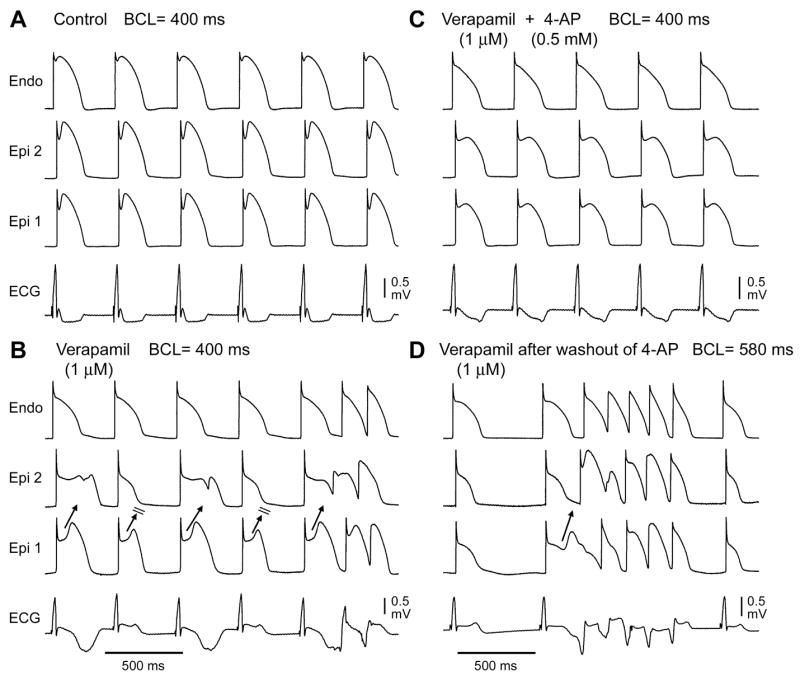
Transient outward current (Ito) block with 4-aminopyridine (4-AP) prevents loss of the epicardial action potential dome and T-wave alternans. A: Control at BCL 400 ms. B: In the presence of verapamil (1 μM) at the same pacing rate, propagation of the epicardial action potential dome from Epi 1 to Epi 2 on alternate beats leads to concealed phase 2 reentry as well as transmural reentry. C: Addition of 4-AP (0.5 mM) restores the epicardial action potential dome and prevents the development of phase 2 reentry and T-wave alternans. D: Loss of the epicardial action potential dome, concealed phase 2 reentry, and phase 2 reentry triggered VT/VF recur after washout of 4-AP. Similar results were observed in 4/4 preparations.
Discussion
Our data demonstrate two distinct mechanisms for TWA in the setting of Brugada syndrome: loss of the dome on alternate beats and concealed phase 2 reentry on alternate beats. Both T-wave morphologies are associated with an augmented TDR relative to control, but this parameter is more dramatically amplified attending the appearance of the deeply negative T wave. T peak–T end and T nadir–T end intervals, previously proposed as an electrocardiographic index of TDR, are shown to be closely correlated with TDR in this model of the Brugada syndrome. Amplification of TDR contributes to the substrate for the development of VT/VF. The large negative T waves are also associated with the development of phase 2 reentry, giving rise to closely coupled extrasystoles that serve as the trigger for precipitation of VT. Thus, both substrate and trigger are associated with the appearance of deeply negative T waves, denoting a higher level of arrhythmic risk. This finding is consistent with the clinical syndrome, where the appearance of deeply negative T wave often precedes the development of VT/VF.3,9 Also consistent with the clinical phenotype is the fact that the degree of TWA in our model is predictive of the likelihood of lethal arrhythmias.
The present study supports the findings of our earlier study using the wedge preparation9 as well as those of the recent study by Morita and colleagues.21 In these earlier studies, beat to beat changes in the morphology of the epicardial but not the endocardial action potential were responsible for T-wave alternans. The present study delineates an additional mechanism for T-wave alternans in the setting of Brugada syndrome: concealed phase 2 reentry in the epicardium on alternate beats.
The spike and dome action potential morphology is observed in both epicardial and midmyocardial tissues; however, the depth of the notch is largest in the right ventricular epicardium, and this is directly related to the density of Ito.23 The greater Ito in the right ventricle explains the right ventricular nature of the disease. The right ventricular epicardium of males has both a larger action potential notch and density of Ito than that of females,8 accounting for the greater manifestation of the Brugada syndrome phenotype in males. Any disruption in the balance of currents active at the end of epicardial action potential phase 1 resulting in a negative shift can lead to all-or-none repolarization at the end of phase 1, or loss of the dome. This occurs heterogeneously within the epicardium, generating both a local epicardial dispersion of repolarization (EDR) as well as a TDR. Propagation of the dome from regions where it is maintained to regions where it has been lost via phase 2 reentry provides the trigger that captures the vulnerable window of dispersion, precipitating polymorphic ventricular tachycardia and fibrillation. Loss of the epicardial action potential dome and phase 2 reentry has been demonstrated with sodium channel blockade,24 sodium and calcium channel blockade,7,9 activation of IK–ATP,7,25 hypercalcemia,26 hypothermia,27,28 and a combination of these factors.29 In this study, we used verapamil to inhibit both ICa and INa–late, and thus to induce loss of the dome, phase 2 reentry and VT. Agents with both sodium and calcium channel blocking actions have been shown to unmask the syndrome in patients with the Brugada syndrome.1,30 It is noteworthy that unlike the congenital syndrome, the Brugada syndrome phenotype is accentuated with acceleration of heart rate in the pharmacologic model, due to use-dependent inward current block secondary to slow dissociation of verapamil from the calcium and sodium channels.
The repolarization gradient between the briefest epicardial and endocardial or midmyocardial response contributes to inscription of the upright T wave.22 When these regions of the myocardium repolarize simultaneously, no T wave is observed (Fig. 1A). At a more physiologic heart rate, TWA occurs as loss of the epicardial action potential dome abbreviates the epicardial response when compared with that of the endocardium, resulting in a positive T wave. As the dome returns, the epicardial action potential often has a delayed second upstroke, resulting in an APD that is longer than that of the endocardium. This reversal of the transmural voltage gradient results in a negative T wave (Fig. 1B). As the pacing rate is increased, loss of the dome occurs on every beat, resulting in a positive T wave and no alternans (Fig. 1C). The TDR created by these differences in repolarization time correlates closely with either the T peak–T end or T nadir–T end interval (Fig. 4).
In some preparations, the dome was lost heterogeneously and alternans manifested as concealed phase 2 reentry on alternating beats (Fig. 2). As the pacing rate was adjusted, phase 2 reentry triggered polymorphic VT. Those preparations displaying this more malignant form of alternans had a significantly greater degree of ST segment elevation during the alternans, compared with those that did not. Moreover, preparations displaying concealed phase 2 reentry had a larger epicardial action potential notch under control conditions, suggesting that the depth of the epicardial action potential notch can serve as a predictor of arrhythmogenic risk. Such variability in the epicardial action potential notch magnitude may explain the incomplete penetrance observed in some Brugada syndrome families.
A Type 1 ST segment elevation in the ECG is considered the most malignant form, and is the only one diagnostic of the Brugada syndrome. It is characterized by a coved ST segment elevation >0.2 mV followed by a negative T wave.30 Our results indicate TDR is increased in the presence of TWA induced by loss of the epicardial AP dome (Table 1) and that the more negative T wave is associated with a larger TDR and is reflected in the ECG as a longer T nadir–T end interval (Fig. 4). Accordingly, reentrant arrhythmias were generally observed after beats displaying pronounced negative T waves (Figs. 5 and 6).
Because Ito is pivotal to the mechanism responsible for the Brugada syndrome, block of this current has been proposed as an approach to therapy (see Ref. 31 for references). As in previous studies, block of Ito is shown to suppress loss of the epicardial action potential dome, TWA, phase 2 reentry and VT induced by verapamil (Fig. 6).7,9
Recent studies employing the canine arterially perfused right ventricular wedge preparation implicated loss of the action potential dome and phase 2 reentry in ST segment elevation and the initiation of VT/VF in the setting of ischemia.32,33 Theses studies suggest that loss of the epicardial action potential dome and/or phase 2 reentry on alternate beats may provide the basis for T-wave alternans in the setting of ischemia.33
In this study, verapamil caused ST segment elevation due to loss of the epicardial action potential dome and induced phase 2 reentry and VT. In canine left ventricular myocytes, the IC50 for IKr, late INa, and ICa are 3.5 μM, 0.21 μM, and 0.31 μM, respectively (Andrew C. Zygmunt, Ph.D. and Charles Antzelevitch, Ph.D., unpublished observations). The lowest concentration of verapamil used is roughly two and a half times greater than the upper end of the therapeutic range34 and would not be expected to be encountered in the clinic with use of therapeutic levels of verapamil, but may accompany toxic levels of the drug.
Clinical Implications
Our findings suggest that TWA in the setting of Brugada syndrome should be viewed as an arrhythmogenic marker. Our findings also suggest that the severity of the alternans may be predictive of the likelihood for malignant arrhythmias, particularly in the presence of deeply negative T waves.
While T peak (or nadir) to T end interval is highly predictive of TDR in our experimental models of the Brugada syndrome, additional work is clearly needed to assess the value of this noninvasive index of electrical heterogeneity and its prognostic value in the assignment of arrhythmic risk. It is noteworthy that in the setting of long QT syndrome, evidence is mounting in support of the hypothesis that TDR rather than QT prolongation underlies the substrate responsible for the development of TdP.35
Study Limitation
As with all basic studies involving animal experimentation, we must exercise caution in extrapolating these findings to the clinic. Although inhibition of ICa and late INa by verapamil generates electrocardiographic characteristic and arrhythmic manifestations very similar to those observed clinically, the extent to which this model mimics the various forms of congenital and acquired Brugada syndrome remains to be established.
Acknowledgments
We gratefully acknowledge the technical assistance of Judy Hefferon and Robert Goodrow.
Supported by grant HL47678 from NHLBI (CA), grants from the American Heart Association (JF and CA), and NYS and Florida Grand Lodges F. & A.M.
Footnotes
Originally presented at 2004 Heart Rhythm Society Annual Scientific Sessions in San Francisco, CA.
References
- 1.Antzelevitch C, Brugada P, Brugada J, Brugada R. The Brugada Syndrome: From Bench to Bedside. Oxford: Blackwell Futura; 2005. [Google Scholar]
- 2.Priori SG, Napolitano C, Gasparini M, Pappone C, Della BP, Giordano U, Bloise R, Giustetto C, De Nardis R, Grillo M, Ronchetti E, Faggiano G, Nastoli J. Natural history of Brugada syndrome: Insights for risk stratification and management. Circulation. 2002;105:1342–1347. doi: 10.1161/hc1102.105288. [DOI] [PubMed] [Google Scholar]
- 3.Antzelevitch C. The Brugada syndrome: Ionic basis and arrhythmia mechanisms. J Cardiovasc Electrophysiol. 2001;12:268–272. doi: 10.1046/j.1540-8167.2001.00268.x. [DOI] [PubMed] [Google Scholar]
- 4.Balser JR. The cardiac sodium channel: Gating function and molecular pharmacology. J Mol Cell Cardiol. 2001;33:599–613. doi: 10.1006/jmcc.2000.1346. [DOI] [PubMed] [Google Scholar]
- 5.Tan H. Biophysical analysis of mutant sodium channels in Brugada syndrome. In: Antzelevitch C, Brugada P, Brugada J, Brugada R, editors. The Brugada Syndrome: From Bench to Bedside. Oxford: Blackwell Futura; 2004. pp. 26–41. [Google Scholar]
- 6.Brugada R. Brugada syndrome: Role of genetics in clinical practice. In: Antzelevitch C, Brugada P, Brugada J, Brugada R, editors. The Brugada Syndrome: From Bench to Bedside. Oxford: Blackwell Futura; 2004. pp. 130–139. [Google Scholar]
- 7.Yan GX, Antzelevitch C. Cellular basis for the Brugada syndrome and other mechanisms of arrhythmogenesis associated with ST segment elevation. Circulation. 1999;100:1660–1666. doi: 10.1161/01.cir.100.15.1660. [DOI] [PubMed] [Google Scholar]
- 8.Di Diego JM, Cordeiro JM, Goodrow RJ, Fish JM, Zygmunt AC, Perez GJ, Scornik FS, Antzelevitch C. Ionic and cellular basis for the predominance of the Brugada syndrome phenotype in males. Circulation. 2002;106:2004–2011. doi: 10.1161/01.cir.0000032002.22105.7a. [DOI] [PubMed] [Google Scholar]
- 9.Fish JM, Antzelevitch C. Role of sodium and calcium channel block in unmasking the Brugada syndrome. Heart Rhythm. 2004;1:210–217. doi: 10.1016/j.hrthm.2004.03.061. [DOI] [PMC free article] [PubMed] [Google Scholar]
- 10.Kurita T, Shimizu W, Inagaki M, Suyama K, Taguchi A, Satomi K, Aihara N, Kamakura S, Kobayashi J, Kosakai Y. The electrophysiologic mechanism of ST-segment elevation in Brugada syndrome. J Am Coll Cardiol. 2002;40:330–334. doi: 10.1016/s0735-1097(02)01964-2. [DOI] [PubMed] [Google Scholar]
- 11.Fish JM, Welchons D, Kim YS, Lee SH, Ho WK, Antzelevitch C. DMLSB, an extract of salvia miliorrhiza, as a potential therapy for Brugada syndrome. Circulation. 2006;113:1393–1400. doi: 10.1161/CIRCULATIONAHA.105.601690. [DOI] [PMC free article] [PubMed] [Google Scholar]
- 12.Aiba T, Shimizu W, Hidaka I, Uemura K, Noda T, Zheng C, Kamiya A, Inagaki M, Sugimachi M, Sunagawa K. Cellular basis for trigger and maintenance of ventricular fibrillation in the Brugada syndrome model: High-resolution optical mapping study. J Am Coll Cardiol. 2006;47:2074–2085. doi: 10.1016/j.jacc.2005.12.064. [DOI] [PubMed] [Google Scholar]
- 13.Nishizaki M, Fujii H, Sakurada H, Kimura A, Hiraoka M. Spontaneous T wave alternans in a patient with brugada syndrome-responses to intravenous administration of class I antiarrhythmic drug, glucose tolerance test, and atrial pacing. J Cardiovasc Electrophysiol. 2005;16:217–220. doi: 10.1046/j.1540-8167.2004.40411.x. [DOI] [PubMed] [Google Scholar]
- 14.Tada H, Nogami A, Shimizu W, Naito S, Nakatsugawa M, Oshima S, Taniguchi K. ST segment and T wave alternans in a patient with Brugada syndrome. PACE. 2000;23:413–415. doi: 10.1111/j.1540-8159.2000.tb06773.x. [DOI] [PubMed] [Google Scholar]
- 15.Chinushi M, Washizuka T, Okumura H, Aizawa Y. Intravenous administration of class I antiarrhythmic drugs induced T wave alternans in a patient with Brugada syndrome. J Cardiovasc Electrophysiol. 2001;12:493–495. doi: 10.1046/j.1540-8167.2001.00493.x. [DOI] [PubMed] [Google Scholar]
- 16.Chinushi Y, Chinushi M, Toida T, Aizawa Y. Class I antiarrhythmic drug and coronary vasospasm-induced T wave alternans and ventricular tachyarrhythmia in a patient with Brugada syndrome and vasospastic angina. J Cardiovasc Electrophysiol. 2002;13:191–194. doi: 10.1046/j.1540-8167.2002.00191.x. [DOI] [PubMed] [Google Scholar]
- 17.Takagi M, Doi A, Takeuchi K, Yoshikawa J. Pilsicanide-induced marked T wave alternans and ventricular fibrillation in a patient with Brugada syndrome. J Cardiovasc Electrophysiol. 2002;13:837. doi: 10.1046/j.1540-8167.2002.00837.x. [DOI] [PubMed] [Google Scholar]
- 18.Ohkubo K, Watanabe I, Okumura Y, Yamada T, Masaki R, Kofune T, Oshikawa N, Kasamaki Y, Saito S, Ozawa Y, Kanmatsuse K. Intravenous administration of class I antiarrhythmic drug induced T wave alternans in an asymptomatic Brugada syndrome patient. PACE. 2003;26:1900–1903. doi: 10.1046/j.1460-9592.2003.00288.x. [DOI] [PubMed] [Google Scholar]
- 19.Morita H, Morita ST, Nagase S, Banba K, Nishii N, Tani Y, Watanabe A, Nakamura K, Kusano KF, Emori T, Matsubara H, Hina K, Kita T, Ohe T. Ventricular arrhythmia induced by sodium channel blocker in patients with Brugada syndrome. J Am Coll Cardiol. 2003;42:1624–1631. doi: 10.1016/j.jacc.2003.06.004. [DOI] [PubMed] [Google Scholar]
- 20.Morita H, Nagase S, Kusano K, Ohe T. Spontaneous T wave alternans and premature ventricular contractions during febrile illness in a patient with Brugada syndrome. J Cardiovasc Electrophysiol. 2002;13:816–818. doi: 10.1046/j.1540-8167.2002.00816.x. [DOI] [PubMed] [Google Scholar]
- 21.Morita H, Zipes DP, Lopshire J, Morita ST, Wu J. T wave alternans in an in vitro canine tissue model of Brugada syndrome. Am J Physiol Heart Circ Physiol. 2006;291:H421–H428. doi: 10.1152/ajpheart.01259.2005. [DOI] [PubMed] [Google Scholar]
- 22.Yan GX, Antzelevitch C. Cellular basis for the normal T wave and the electrocardiographic manifestations of the long QT syndrome. Circulation. 1998;98:1928–1936. doi: 10.1161/01.cir.98.18.1928. [DOI] [PubMed] [Google Scholar]
- 23.Di Diego JM, Sun ZQ, Antzelevitch C. Ito and action potential notch are smaller in left vs. right canine ventricular epicardium Am J Physiol. 1996;271:H548–H561. doi: 10.1152/ajpheart.1996.271.2.H548. [DOI] [PubMed] [Google Scholar]
- 24.Krishnan SC, Antzelevitch C. Flecainide-induced arrhythmia in canine ventricular epicardium. Phase 2 Reentry? Circulation. 1993;87:562–572. doi: 10.1161/01.cir.87.2.562. [DOI] [PubMed] [Google Scholar]
- 25.Di Diego JM, Antzelevitch C. Pinacidil-induced electrical heterogeneity and extrasystolic activity in canine ventricular tissues. Does activation of ATP-regulated potassium current promote phase 2 reentry? Circulation. 1993;88:1177–1189. doi: 10.1161/01.cir.88.3.1177. [DOI] [PubMed] [Google Scholar]
- 26.Di Diego JM, Antzelevitch C. High [Ca2+]-induced electrical heterogeneity and extrasystolic activity in isolated canine ventricular epicardium. Phase 2 reentry. Circulation. 1994;89:1839–1850. doi: 10.1161/01.cir.89.4.1839. [DOI] [PubMed] [Google Scholar]
- 27.Yan GX, Antzelevitch C. Cellular basis for the electrocardiographic J wave. Circulation. 1996;93:372–379. doi: 10.1161/01.cir.93.2.372. [DOI] [PubMed] [Google Scholar]
- 28.Fish JM, Antzelevitch C. Link between hypothermia and the Brugada syndrome. J Cardiovasc Electrophysiol. 2004;15:942–944. doi: 10.1046/j.1540-8167.2004.04323.x. [DOI] [PMC free article] [PubMed] [Google Scholar]
- 29.Shimizu W. Acquired forms of Brugada syndrome. In: Antzelevitch C, Brugada P, Brugada J, Brugada R, editors. The Brugada Syndrome: From Bench to Bedside. Oxford: Blackwell Futura; 2004. pp. 166–177. [Google Scholar]
- 30.Antzelevitch C, Brugada P, Borggrefe M, Brugada J, Brugada R, Corrado D, Gussak I, LeMarec H, Nademanee K, Perez Riera AR, Shimizu W, Schulze-Bahr E, Tan H, Wilde A. Brugada Syndrome. Report of the Second Consensus Conference Endorsed by the Heart Rhythm Society and the European Heart Rhythm Association. Circulation. 2005;111:659–670. doi: 10.1161/01.CIR.0000152479.54298.51. [DOI] [PubMed] [Google Scholar]
- 31.Antzelevitch C, Fish JM. Therapy for the Brugada Syndrome. In: Kass R, Clancy CE, editors. Handbook of Experimental Pharmacology. New York: Springer-Verlag; 2006. pp. 305–330. [DOI] [PMC free article] [PubMed] [Google Scholar]
- 32.Di Diego JM, Antzelevitch C. Cellular basis for ST-segment changes observed during ischemia. J Electrocardiol. 2003;36(Suppl):1–5. doi: 10.1016/j.jelectrocard.2003.09.001. [DOI] [PubMed] [Google Scholar]
- 33.Yan GX, Joshi A, Guo D, Hlaing T, Martin J, Xu X, Kowey PR. Phase 2 reentry as a trigger to initiate ventricular fibrillation during early acute myocardial ischemia. Circulation. 2004;110:1036–1041. doi: 10.1161/01.CIR.0000140258.09964.19. [DOI] [PubMed] [Google Scholar]
- 34.Oe H, Taniura T, Ohgitani N. A case of severe verapamil overdose. Jpn Circ J. 1998;62:72–76. doi: 10.1253/jcj.62.72. [DOI] [PubMed] [Google Scholar]
- 35.Antzelevitch C. Modulation of transmural repolarization. Ann N Y Acad Sci. 2005;1047:314–323. doi: 10.1196/annals.1341.028. [DOI] [PMC free article] [PubMed] [Google Scholar]


