

Abstract
In this work, we used direct measurements with the surface force apparatus to determine the pH-dependent electrostatic charge density of a single binding face of streptavidin. Mean field calculations have been used with considerable success to model electrostatic potential fields near protein surfaces, but these models and their inherent assumptions have not been tested directly at the molecular level. Using the force apparatus and immobilized, oriented monolayers of streptavidin, we measured a pI of 5–5.5 for the biotin-binding face of the protein. This differs from the pI of 6.3 for the soluble protein and confirms that we probed the local electrostatic features of the macromolecule. With finite difference solutions of the linearized Poisson–Boltzmann equation, we then calculated the pH-dependent charge densities adjacent to the same face of the protein. These calculated values agreed quantitatively with those obtained by direct force measurements. Although our study focuses on the pH-dependence of surface electrostatics, this direct approach to probing the electrostatic features of proteins is applicable to investigations of any perturbations that alter the charge distribution of the surfaces of immobilized molecules.
Charge distributions on protein surfaces are believed to modulate electrostatically directed ligand association (1–4), catalytic rates (1, 5), and redox potentials (6). Many biomolecular interactions frequently involve associations between surfaces with complementary surface potentials. Such DNA binding proteins as the processivity factor of Escherichia coli DNA polymerase III are net negatively charged, but the DNA binding domain contains a localized patch with significant positive charge (7). Simple calculations of proteins’ electrostatic surface potentials, obtained from solutions of the Poisson–Boltzmann equation, have been useful in interpreting biochemical data and obtaining a mechanistic understanding of physiological function (1). The calculated electrostatic potential fields of cytochrome b5 and cytochrome c, for example, suggest that complementary charge distributions generate steering torques that guide their association (4, 8, 9). Such steering fields potentially alter the kinetic binding rates and, in some cases, purportedly lower the repulsive barriers to binding between similarly charged species (10). To test this, variants of cytochrome b5 have been engineered to probe the orientational dependence of interactions between cytochrome c and immobilized cytochrome b5 (11). However, the significance of the spatial variation in electrostatic potentials has not been quantified directly.
Changes in proteins’ electrostatic surface potentials have been inferred from changes in kinetic binding rates and shifts in pKas caused by site-directed mutations (12–14). Using statistically acetylated protein, Gao and Whitesides reported the qualitative dependence on the electrostatic free energy contribution to protein–ligand binding by charged patches remote from the protein binding site (15, 16). These investigations illustrate the importance and continued interest in determining the impact of electrostatics on molecular recognition, testing the validity of current models of electrostatic behavior, and the improvement of our understanding of the dependence of intermolecular potentials on complex macromolecular structures. Calculated electrostatic potential distributions have been used in Brownian dynamics simulations to obtain near quantitative agreement with, for example, measured kinetics. However, the quality of the calculations depends both on the models used and on their underlying assumptions. Simulated binding rates, which use calculated intermolecular potentials, often involve adjustable parameters, such as solution energies, and do not constitute a direct measure of the electrostatic potentials (9, 12, 17–20). Thus, current models of protein electrostatics have not been verified directly at the molecular level.
Until recently, the more powerful approach of measuring directly the surface charge densities of localized regions of protein surfaces had not been possible. Direct force measurements with oriented protein monolayers did demonstrate qualitatively that distributions of charged residues control the local electrostatic properties of protein surfaces (21, 22). Because the force measurements probe the exposed surface of immobilized proteins, those results suggested that the electrostatic potential distribution over the protein exterior could be mapped directly by controlling the orientation of the bound species (23). In addition, the visualization of protein topography by atomic force microscopy, as reflected in the spatial variation of tip-sample repulsion (24), suggests the possibility of mapping spatial distributions of protein charge, in addition to the van der Waals surface.
In this work, we demonstrate the use of the surface force apparatus (SFA) to probe quantitatively the electrostatic properties of protein surfaces at the molecular level. In particular, we report direct measurements of the pH-dependence of the charge density of a single face of immobilized, oriented streptavidin. The directly measured isoelectric point of 5.0 ± 0.5 for the biotin-binding face, obtained with this method, differs from that of the soluble protein (pI ≈ 6.3). This demonstrated that the forces reflect the local charge density of the exposed protein surface. The charge densities thus determined were compared with theoretical predictions based on mean field calculations of the electrostatic surface potential near the protein. Accounting for shifts in the pKas of amino acid residues caused by the local protein environment, we obtained finite difference solutions of the three-dimensional linearized Poisson–Boltzmann equation for streptavidin (18, 25). We demonstrate near-quantitative agreement between the directly measured charge densities and the predicted values. These results constitute a direct pH-dependent probe of protein electrostatics at the molecular level, and they provide a direct comparison between molecular level measurements and theory.
MATERIALS AND METHODS
Chemicals.
1,2 ditridecanoyl-sn-glycero-3-phosphocoline and 1,2-dipalmitoyl-sn-glycero-3-phosphoethanolamine were purchased from Avanti Polar Lipids. N-(4-Maleimidomethyl) cyclohex-1-ylcarbonyl)-1,2-dihexadecanoyl-sn-glycero-3-phosphoethanolamine, triethylammonium salt and N-(6-(biotinoylamino) hexanoyl)-1,2-palmitoyl-sn-glycero-3-phosphoethanolamine, triethylammonium salt (biotin-X DPPE) were purchased from Molecular Probes. All inorganic salts were high purity (>99.5%) and were purchased from Aldrich. Potassium hydrogen phthalate was also from Aldrich. Streptavidin was from Calbiochem. All aqueous solutions were prepared with water purified with a Milli-Q UV Plus water purification system (Millipore).
Preparation of Oriented Streptavidin Monolayers.
Homogeneously oriented streptavidin monolayers were prepared by anchoring the protein on a supported lipid bilayer displaying biotin conjugated to dipalmitoyl phosphatidylethanolamine (Fig. 1 Lower) (22, 23). The outer leaflet of the bilayer comprised 5 mol % of biotin-X-1,2-dipalmitoyl-sn-glycero-3-phosphoethanolamine and 95 mol % of 1,2 ditridecanoyl-sn-glycero-3-phosphocoline. The lipid mixture was spread at the air–water interface of a Langmuir trough (NIMA, Coventry, England) and was compressed to an average lipid area of 65 Å2. This lipid monolayer then was transferred at constant pressure onto a monolayer of solid dipalmitoyl phosphatidylethanolamine (43 Å2/lipid) supported on molecularly smooth, freshly cleaved mica substrates, as described (22, 23). Soluble streptavidin binds to these layers and self-assembles into two-dimensional crystals (26). The fractional protein surface coverage of 85 ± 3% was determined both by quantifying the amount of 125I radiolabeled protein bound to the bilayers (27) and by surface plasmon resonance spectroscopy (28). The measured coverage agreed with results from neutron reflectivity studies of crystalline streptavidin domains on floating biotin-lipid films (29).
Figure 1.

(Upper) The force vs. distance profile between identical streptavidin monolayers as a function of the distance D between the outer protein surfaces. Force measurements were obtained in 8 mM phosphate buffer at pH 6.0 and 25°C. The solid line through the data is the best fit to the nonlinear Poisson–Boltzmann equation. The fitted parameters are given in Table 1. (Lower) The protein and monolayer configurations used in the force measurements. In measurements at pH 5.0, one of the two surfaces consisted of a charged membrane, which consisted of a charged lipid layer absent the bound protein.
Force Measurements.
The SFA quantifies the molecular forces between thin films as a function of their separation distance. The materials are confined to the surfaces of opposed, crossed-cylindrical lenses. A positioning control system varies the spacing between the surfaces, and the forces are measured from the deflection of a spring that supports one of the lenses (30). The distance resolution is ±1 Å, and the force resolution is ±1 nN (23, 30). The area probed is ≈10 μm2, so that the measured force represents an average over ≈350,000 proteins (23). To insure that a single protein orientation generated the measured electrostatic double-layer force, we bound and oriented streptavidin on supported biotin-lipid monolayers (Fig. 1 Lower).
The distance dependency of the forces between protein monolayers was measured at 25°C with the Mark III SFA (SurForce Corporation, Santa Barbara, CA), which has been described elsewhere (30). The chamber of the instrument housing the samples was filled with a buffer solution of defined pH and ionic strength. Measurements between the proteins were obtained at the ambient pH values of 5.0, 6.0, 7.0, and 7.6. Solutions buffered at pH 6.0, 7.0, and 7.6 were prepared with sodium phosphate, and the pH 5.0 solution was prepared with potassium hydrogen phthalate. All solutions were saturated with 1,2 ditridecanoyl-sn-glycero-3-phosphocoline to prevent desorption of the lipid bilayers during the measurements.
The profile of the electrostatic double-layer force was measured either between identical streptavidin monolayers (22) or between a streptavidin monolayer and a second charged “test surface.” In measurements that used a second charged bilayer, the test membrane contained 85 mol % 1,2 ditridecanoyl-sn-glycero-3-phosphocoline and 15 mol % of the negatively charged, synthetic lipid N-(4-maleimidomethyl-cyclohexyl-l-carbonyl)1,2-dipalmitoyl-sn-glycero-3-phosphoethanolamine. The surface charge density of the latter monolayer is −11 mC/m2 (27).
The surface charge densities of the immobilized streptavidin monolayers were determined from fits of the long-range, exponentially decaying portion of the measured force profile to solutions of a one-dimensional Nonlinear Poisson–Boltzmann equation (31, 32). Together with the Derjaguin approximation, which relates the interaction free energy between two flat surfaces to the normalized force between curved surfaces (31–33), we thus calculated the theoretical force between two charged, curved surfaces in aqueous electrolyte. The charge per protein, σs, then was obtained by normalizing the fitted surface charge density by the average area occupied by the streptavidin molecules.
The pH-Dependence of Calculated Electrostatic Potentials.
Changes in the electrostatic potentials caused by pKa shifts and the pH-dependent titration of ionizable residues were computed with the cluster method (18). Calculations were carried out by using the program uhbd 5.1 (19) following guidelines developed elsewhere (17, 25). Partial charges (34) and radii (35) were assigned to the streptavidin tetramer (36), which was constructed by applying crystallographic symmetry operations to the atomic coordinates of the monomer structure (Protein Data Bank accession code 1STP). Polar hydrogen atoms were added by using the hydrogen positioning program hbuild (37) within quanta 4.1 (Molecular Simulations, Waltham, MA). The charge distribution for the biotin used to anchor streptavidin was obtained by using gaussian-94 (38) at the Hartree-Fock level, with a 6-31G* basis set.
The calculation of local pKas by using the cluster method implements the uhbd suite of programs to calculate electrostatic energies. A modified Tanford–Roxby (39) approach was used to determine the pKa values of all ionizable groups in the protein. This procedure evaluates exactly an ionization polynomial for clusters of residues with significant charge correlation and uses a mean field approximation for other intercluster interactions. For all calculations, we used a solvent probe radius of 1.4 Å; a solvent dielectric constant of 80; a protein dielectric constant of 20, which has been shown to produce optimal results with the cluster method (25); and ionic strengths to 10 mM. All histidines were assigned a tautomeric form where NE2 is the titrating site.
To evaluate the electrostatic potentials and pKa shifts, the linearized Poisson–Boltzmann equation was discretized on a 1003 grid with a 1.5-Å spacing. For the pKa calculations, smaller focusing grids of sizes 15, 15, and 25 Å, with spacings 1.2, 0.75, and 0.25 Å, were used to obtain electrostatic potentials in the regions surrounding each ionizable site. The boundary condition assumed that the potential at the edge of the grid was the sum of the potentials of all atoms treated as independent Debye–Hückel spheres. The calculated pKa shifts then were used to predict the charge distribution near ionizable sites on streptavidin at different values of the solution pH. We thus assigned charges to grid points that were unique to the hydronium ion concentration.
RESULTS
Definition Of Intersurface Separation Distance.
In measurements of the force versus the separation between identical streptavidin monolayers, zero separation distance, i.e., D = 0 Å, corresponds to steric contact between the outer van der Waals surfaces of opposed streptavidin monolayers (Fig. 1 Lower). In measurements with a second “test” membrane, D = 0 Å corresponds to the distance between the protein surface and the membrane. The thickness of the molecular assembly was determined from the difference in the distance of closest intersurface approach, after the removal of all organic layers from the underlying mica substrate. After draining the apparatus, the organic surface layers, including the protein monolayers and the lipid bilayers, were burnt away by UV irradiation in an atmosphere of filtered N2. The measured thickness of 172 ± 3 Å for two supported protein monolayers is consistent with the protein and bilayer thicknesses determined by x-ray diffraction, force measurements, and neutron reflectivity (22, 29, 36).
Force Measurements.
The effective charge densities of the streptavidin monolayers were determined from the measured electrostatic double-layer forces between either identical protein monolayers or between a protein monolayer and a negatively charged test surface of known charge density (21, 22, 31–33). Fig. 1 shows the distance dependence of the electrostatic double-layer force between two streptavidin monolayers at pH 6.0. Fits of the long-range, repulsive force to the one-dimensional nonlinear Poisson–Boltzmann equation gave the electrostatic surface charge density and surface potential (22, 23, 27). The best fits were obtained with the constant charge boundary condition (31). At D <5 Å, the force profiles deviated from double-layer theory because of short-range steric and hydration forces. The results are summarized in Table 1.
Table 1.
Surface charge densities determined from the measured double-layer force between streptavidin monolayers
| pH | Salt, mM | σ, mC⋅m−2 | σs, e | σ − σ bg |
|---|---|---|---|---|
| 5* | 5.0 | −7 ± 1 | −1.2 ± 0.2 | 0 ± 0.4 |
| 6 | 8.0 | −11 ± 1 | −1.9 ± 0.2 | −0.7 ± 0.4 |
| 7 | 2.0 | −16 ± 2 | −2.8 ± 0.4 | −1.6 ± 0.4 |
| 7.6 | 6.0 | −19 ± 1 | −3.3 ± 0.2 | −2.1 ± 0.4 |
| 5* | 40.0 | 0 ± 2 | 0.0 ± 0.4 | — |
Determined from the force between the streptavidin monolayer and test surface in hydrogen phthalate buffer. All other measurements were in phosphate buffer. e, electron charge.
In the fitting procedure, the effective plane of charge, i.e., the outer Helmholtz plane, was assumed to lie within 6 Å of a plane tangent to the outermost van der Waals surface of streptavidin (Fig. 2). We thereby determined the effective charge projected into a plane tangent to the protein surface (20, 27). With identical samples, the measured surface charge density was independent of the salt concentration (data not shown). This enabled us to compare data from the different measurements, although the solution ionic strengths differed slightly.
Figure 2.
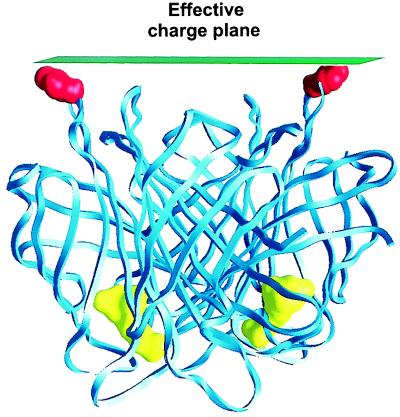
The streptavidin structure and the location of the effective charge plane. The effective outer Helmholtz plane is indicated by the plane tangent to the outer van der Waals surface of the Thr66 residues. The latter are indicated by the red space-filling Corey–Pauling–Koltun models. The yellow space-filling structures are the biotins used to anchor streptavidin to the bilayer.
Because similarly charged surfaces repel each other, the fits did not give the sign of the charge. To determine the latter, we used a test surface for which both the sign and the magnitude of the charge density is known. The data fits depend on the charge densities of both the protein and test surfaces (31, 32). Knowing σ for one surface, therefore, enabled us to determine that of the second, e.g., the protein monolayer, unambiguously (22). The fits of the double-layer force between streptavidin and the test membrane, at pH 5 in 5 mM buffer, indicated that the supported protein monolayer was negatively charged (Table 1). Because the negative charge will increase with increasing pH, the streptavidin charge must also be negative at pH >5.
We then compared these experimentally measured charge densities with theoretical predictions based on finite difference solutions to the three-dimensional linearized Poisson–Boltzmann equation recast on a discrete cubic grid. Use of the linearized Poisson–Boltzmann equation was justified because the magnitudes of the electrostatic potentials were <30 mV (33). The shifts in the pKas of the ionizable residues because of the local protein environment were calculated as described above. These pKa shifts then were used to predict the ionization states of titratable residues on streptavidin at different values of the solution pH.
We compared the experimental and theoretical results by determining the measured and calculated surface-averaged charge densities in the same plane tangent to the protein surface. The experimentally measured charge per protein σs is the fitted surface charge density σ normalized by the protein coverage (Table 1). At low electrostatic potentials, σ scales linearly with the protein surface coverage (27, 32). This made it possible to compare σ per streptavidin molecule, σS, with the calculated charge density as a function of the solution pH.
To compare the predicted charge densities with the measured ones, we then calculated the equivalent Gouy–Chapman potential adjacent to the same surface of streptavidin as probed in the force measurements (Fig. 2) (20, 27, 40). Fig. 3 shows the pH-dependent electrostatic potential distribution in this plane. The force probe measures the average charge density in the plane tangent to the outer van der Waals surface. We therefore obtained the equivalent Guoy–Chapman or surface-averaged potentials 〈Ψ(z)〉 at the protein surface, by averaging arithmetically the computed potentials over all grid points in the effective charge plane tangent to the outer Thr66 residues (Fig. 2). Thus,
 |
where the grid point positions are defined by the vectors i and j, which are coplanar with the charge plane at z. The sum runs over all n = 100,000 grid points in a slice at a fixed distance from the protein surface. The error in the distances determined in the force measurements is ±3 Å, so we also determined the variation in the calculated Gouy–Chapman potential within 6 Å of the surface.
Figure 3.
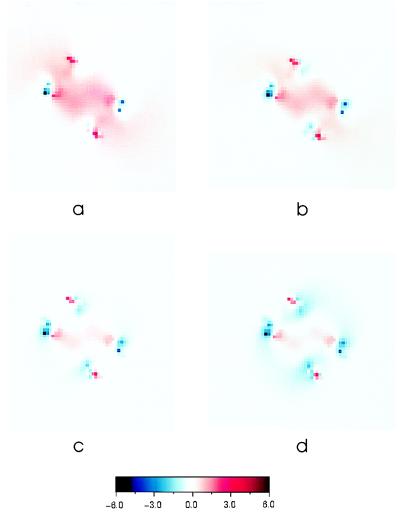
Electrostatic potential distributions in the charge plane as a function of pH. A–D show the electrostatic potential distributions in the tangent charge plane at pH 5.0, 6.0, 7.0, and 7.6, respectively.
The surface charge density then was calculated from 〈Ψ〉 with the Grahame equation (33) and then was normalized to 85% protein surface coverage. From the calculated electrostatic potential, averaged over all grid points in the plane, we thus calculated σS at the same position relative to the protein face as determined in the force measurements (Fig. 2). Within 6 Å of the surface, σ varied by <10%. The results are summarized in Table 2.
Table 2.
Surface charge densities calculated from finite difference solutions of the linearized Poisson–Boltzmann equation
| pH | Salt, mM | σ, mC⋅m−2 | σs, e | σExp − σtheory |
|---|---|---|---|---|
| 5 | 10 | 3.2 | 0.55 | 1.8 |
| 6 | 10 | −3.0 | −0.52 | 1.4 |
| 7 | 10 | −9.3 | −1.61 | 1.2 |
| 7.6 | 10 | −12.3 | −2.12 | 1.2 |
| Average 1.4 ± 0.4 | ||||
e, electron charge.
An initial comparison of the results showed the experimental values to be more negative than the predicted ones. However, the measured values include both a pH-dependent contribution from the protein surface and a constant contribution from the charged, underlying biotin-lipid substrate. The latter charge is caused by the ionized phosphate groups of the biotin-X-1,2-dipalmitoyl-sn-glycero-3-phosphoethanolamine (22). Independent measurements showed that the charge density of the biotin-lipid membrane is pH-independent, within experimental error, at the pH values investigated. At pH 5 and 7.6, σ was −7 ± 1 mC/m2 and −6.5 ± 0.5 mC/m2, respectively. Consistent with this, the results in Table 2 show that the difference between experiment and theory, which is attributed to the background charge, is also essentially constant at 1.4 ± 0.4 charges per protein.
To quantify the background contribution to the values in Table 1, the electrostatic potential caused by the underlying membrane was screened. To do this, we increased the ionic strength such that the Debye screening length was reduced to 15 Å, which is one-third of the streptavidin thickness normal to the membrane. At this ionic strength, the estimated membrane contribution to σ decays to 14% of its initial value, or ≈−0.1 mC/m2, at the distance from the bilayer coincident with outer protein surface. This approach substantially, although not completely, reduced the substrate contribution to the electrostatic potential at the position of the defined charge plane. Under these conditions, the fitted charge density of the streptavidin monolayer was 0 ± 0.2 mC/m2 at pH 5.0 (Table 1). At pH 6, however, the surface potential was still negative. The measured surface charge densities of both the streptavidin and the membrane are ionic strength-independent (data not shown). We therefore attribute this salt-dependent reduction in the measured streptavidin charge density σS to the screened substrate charge.
The difference between the measured charge density in 5 mM versus 40 mM salt at pH 5 gives the background contribution at low ionic strength. The σbg charges of streptavidin, corrected for the substrate contribution, are summarized in Table 1. Fig. 4 compares the theoretical titration curves for the biotin-binding face with the experimental values, adjusted for the background (27). Both the measured and calculated charges are in good agreement over this pH range. They predict the isoelectric point of this localized region of the protein exterior to be 5.0–5.5. This contrasts with the overall pI of 6.3 for the streptavidin molecule in solution, determined by isoelectric focusing.
Figure 4.

Comparison of the pH-dependence of measured and calculated charge per protein in the effective plane of charge. These results show the agreement between the calculated and measured pH-dependent electrostatic properties of the biotin binding surface of streptavidin at the molecular level. The parameters were determined as described in the text.
DISCUSSION
Using the SFA, we have obtained, by direct measurement at the molecular level, a titration curve for a localized region of the exterior surface of streptavidin. The difference in the isoelectric points between the probed surface and the soluble protein clearly demonstrates that these force measurements indeed reflect the local charge density of the oriented protein, rather than its net charge. In addition, we show good agreement between the measured electrostatic surface properties and the theoretical predictions.
These results show that such direct force measurements can be used to determine quantitatively the electrostatic properties of defined regions of a protein surface. Before these measurements, determination of the changes in local electrostatic potentials caused by, for example, charge mutations relied primarily on measured shifts in the pKas (13) or on changes in the kinetic binding rates (3). Our results show that it is possible to probe such changes in the surface electrostatics directly. Furthermore, the agreement between the values shows directly that mean field approaches accurately describe the electrostatic charge densities of complex protein structures.
In the force measurements, the measured electrostatic surface parameters comprised contributions from charges both on the protein and on the underlying substrate. To determine the protein contribution alone, it was necessary to account for the membrane charge. The influence of charged substrates on the apparent electrostatic potential of protein monolayers, as well as the efficacy of methods used to reduce their influence, was investigated recently (27). For dilute protein layers, increases in the ionic strength effectively screen the field contributed by the underlayers. However, because of the high streptavidin coverage (85%) in these measurements and the consequent presence of a low dielectric layer adjacent to the membrane, high salt may not screen the underlying charge as effectively. Nevertheless, in the absence of a computationally tractable model that describes the electrostatic field in the vicinity of this complicated protein-lipid assembly, it was not possible to determine precisely the effectiveness of the substrate charge screening at increased ionic strengths. Thus, the actual values of σs may be slightly more positive than those in Table 1.
The use of a one-dimensional Poisson–Boltzmann equation to describe the electrostatic charge density of oriented protein monolayers assumes that the latter can be approximated by flat plates with an average surface charge density that reflects the spatial heterogeneity of the exposed protein surface (20, 40). In the corresponding calculations, we also determined the effective Guoy–Chapman potentials by averaging the calculated electrostatic potentials in a slice tangent to the outer van der Waals surface. Accurate values of the one-dimensional electrostatic potential at the protein surface can only be obtained by averaging the potentials over a surface that follows the contour of the dielectric discontinuity between the protein interior and the solvent. As in the force measurements, our calculations smeared out lateral features in the local surface topography and charge distribution. Nevertheless, investigations of bilayers with spatially distinct charges verified that the Guoy–Chapman potential indeed reflects the electrostatic potential averaged over all discreet charges in a plane near the probed surface (Fig. 2) (20, 40). Consistent with this, our predicted charge densities are in excellent agreement with the experimental values, despite the limitations of the assumptions inherent in our approach.
The fact that the forces reflect the area averaged potential of the protein surface nearest the opposed probe surface does limit the resolution of the measurements, so that lateral variations in the charge density over the exposed face cannot be resolved without reorienting the immobilized protein. Moreover, the ability to resolve local compositional variations will decrease with decreasing protein dimensions, because distal charges on small molecules, including both those on the protein and those on the substrate, are screened less efficiently (27). Nevertheless, the measured Guoy–Chapman potentials are those that an incoming ligand or membrane will encounter along the axis of approach (12, 17). Although lateral variations in both surface charge distributions and topology will influence local electrostatic and hydrodynamic potentials at small to intermediate distances (1, 16), such high resolution of local protein force fields is not currently achievable.
In summary, using the SFA, we demonstrated that the electrostatic charge densities of defined, localized regions of protein surfaces are quantifiable at the molecular level. Our results demonstrate excellent agreement between the measured and theoretically predicted pH dependence of the electrostatic parameters for a protein surface. Although this study focused on determinations of pH-dependent electrostatics, this approach is not limited to the pH-titrations presented. It can be extended readily to investigations of any changes, such as charge mutations or the orientation of the bound protein, that alter the electrostatic potential of the exposed face of the immobilized macromolecule (11, 21). In addition, the forces measured with the SFA are related directly to the interaction free energies between the same materials by the Derjaguin approximation (32, 33). Therefore, similar measurements can be done to probe directly the impact of structural or orientational dependencies on the interaction free energies between macromolecules or between proteins and bilayer membranes.
Acknowledgments
This work was supported by National Institutes of Health Grant R29 GM51338.
ABBREVIATION
- SFA
surface force apparatus
References
- 1. Honig B, Nicolls A. Science. 1995;268:1144–1149. doi: 10.1126/science.7761829. [DOI] [PubMed] [Google Scholar]
- 2.Guenot J, Fletterick R, Kollman P. Protein Sci. 1994;3:1276–1285. doi: 10.1002/pro.5560030814. [DOI] [PMC free article] [PubMed] [Google Scholar]
- 3.Getzoff E, Cabelli D, Fisher C, Parge H, Viezzoli M, Banci L, Hallewell R. Nature (London) 1992;358:347–351. doi: 10.1038/358347a0. [DOI] [PubMed] [Google Scholar]
- 4.Koppenol W, Margoliash E. J Biol Chem. 1982;257:4426–4437. [PubMed] [Google Scholar]
- 5.Warshel A. Biochemistry. 1981;20:3167–3177. doi: 10.1021/bi00514a028. [DOI] [PubMed] [Google Scholar]
- 6.Churg A, Warshel A. Biochemistry. 1986;25:1675–1681. doi: 10.1021/bi00355a035. [DOI] [PubMed] [Google Scholar]
- 7.Kuriyan J, O’Donnell M. J Mol Biol. 1993;234:915–925. doi: 10.1006/jmbi.1993.1644. [DOI] [PubMed] [Google Scholar]
- 8.Rodgers K K, Pochapsky T C, Sligar S G. Science. 1988;240:1657–1659. doi: 10.1126/science.2837825. [DOI] [PubMed] [Google Scholar]
- 9.Wendoloski J J, Matthew J B, Weber P C, Salemme F R. Science. 1987;238:794–797. doi: 10.1126/science.2823387. [DOI] [PubMed] [Google Scholar]
- 10.Northrup S H, Boles J, O, Reynolds J C L. J Phys Chem. 1987;91:5991–5998. [Google Scholar]
- 11.Stayton P S, Olinger J M, Jiang M, Bohn P W, Sligar S G. J Am Chem Soc. 1992;114:9298–9299. [Google Scholar]
- 12.McCammon A J. Curr Opin Struct Biol. 1998;8:245–249. doi: 10.1016/s0959-440x(98)80046-8. [DOI] [PubMed] [Google Scholar]
- 13.Getzoff E, Tainer J, Weiner P, Kollman P, Richardson J, Richardson D. Nature (London) 1983;306:286–290. doi: 10.1038/306287a0. [DOI] [PubMed] [Google Scholar]
- 14.Thomas P, Russell A, Fersht A. Nature (London) 1985;318:375–376. [Google Scholar]
- 15.Gao J M, Gomez F A, Harter R, Whitesides G M. Proc Natl Acad Sci USA. 1994;91:12027–12030. doi: 10.1073/pnas.91.25.12027. [DOI] [PMC free article] [PubMed] [Google Scholar]
- 16.Gao J M, Mammen M, Whitesides G M. Science. 1996;272:535–537. doi: 10.1126/science.272.5261.535. [DOI] [PubMed] [Google Scholar]
- 17.Gibas C, Subramaniam S, McCammon J A, Braden B, Poljak R J. Biochemistry. 1997;36:15599–15614. doi: 10.1021/bi9701989. [DOI] [PubMed] [Google Scholar]
- 18.Gilson M. Proteins Struct Funct Genet. 1993;15:266–282. doi: 10.1002/prot.340150305. [DOI] [PubMed] [Google Scholar]
- 19.Madura J D, Briggs J M, Wade R C, Davis M E, Luty B A, Ilin A, Antosiewicz J, Gilson M, Bagheri B, Scott L R, et al. Computer Physics Communications. 1995;91:57–95. [Google Scholar]
- 20.Peitzsch R M, Eisenberg M, Sharp K A, McLaughlin S. Biophys J. 1995;68:729–738. doi: 10.1016/S0006-3495(95)80253-5. [DOI] [PMC free article] [PubMed] [Google Scholar]
- 21.Leckband D E, Kuhl T L, Wang H K, Müller W, Ringsdorf H. Biochemistry. 1995;34:11467–11478. doi: 10.1021/bi00036a020. [DOI] [PubMed] [Google Scholar]
- 22.Leckband D, Schmitt F-J, Israelachvili J, Knoll W. Biochemistry. 1994;33:4611–4624. doi: 10.1021/bi00181a023. [DOI] [PubMed] [Google Scholar]
- 23.Leckband D. Nature (London) 1995;376:617–618. doi: 10.1038/376617a0. [DOI] [PubMed] [Google Scholar]
- 24.Müller D J, Engel A. Biophys J. 1997;73:1633–1644. doi: 10.1016/S0006-3495(97)78195-5. [DOI] [PMC free article] [PubMed] [Google Scholar]
- 25.Antosiewicz J, McCammon J, Gilson M. J Mol Biol. 1994;238:415–436. doi: 10.1006/jmbi.1994.1301. [DOI] [PubMed] [Google Scholar]
- 26.Calvert T, Leckband D. Langmuir. 1997;13:6737–6745. [Google Scholar]
- 27.Yeung C, Leckband D. Langmuir. 1997;13:6746–6754. [Google Scholar]
- 28.Spinke J, Liley M, Schmitt F-J, Guder H-J, Angermaier L, Knoll W. J Chem Phys. 1993;99:7012–7019. [Google Scholar]
- 29.Vaknin, D., Als-Nielsen, J., Piepenstock, M. & Lösche, M. (1991) Biophys. J. 60. [DOI] [PMC free article] [PubMed]
- 30.Israelachvili J, McGuiggan P. J Mater Res. 1990;5:2223–2231. [Google Scholar]
- 31.Grabbe A. Langmuir. 1993;9:797–801. [Google Scholar]
- 32.Hunter R. Foundations of Colloid Science. Oxford: Oxford Univ. Press; 1989. [Google Scholar]
- 33.Israelachvili J. Intermolecular and Surface Forces. New York: Academic; 1992. [Google Scholar]
- 34.Brooks B, Bruccoleric R, Olafson B, States D, Swaminathan S, Karplus M. J Comp Chem. 1983;4:187–217. [Google Scholar]
- 35.Jorgensen W L, Tirado-Rives J. J Am Chem Soc. 1988;110:1657–1669. doi: 10.1021/ja00214a001. [DOI] [PubMed] [Google Scholar]
- 36.Weber P C, Ohlendorf D H, Wendoloski J J, Salemme F R. Science. 1989;243:85–88. doi: 10.1126/science.2911722. [DOI] [PubMed] [Google Scholar]
- 37.Brunger A T, Karplus M. Proteins Struct Funct Genet. 1988;4:148–156. doi: 10.1002/prot.340040208. [DOI] [PubMed] [Google Scholar]
- 38.Frisch M, Trucks G, Schlegel H, Gill P, Johnson B, Robb M, Cheeseman J, Keith T, Peterson G, Montgomery J, et al. User Manual. Pittsburgh: Gaussian; 1995. [Google Scholar]
- 39.Tanford C, Roxby R. Biochemistry. 1972;11:2192–2198. doi: 10.1021/bi00761a029. [DOI] [PubMed] [Google Scholar]
- 40.Mathias R, Baldo G J, Kandiah M, McLaughlin S. In: Electrified Interfaces in Physics. Guidelli R, editor. The Netherlands: Kluwer Academic Publishers; 1992. pp. 473–490. [Google Scholar]