

Abstract
The authors examined whether a diet that increases plasma urate level is also related to reduced risk of Parkinson’s disease (PD). The study population comprised 47,406 men in the Health Professionals Follow-up Study. The potential effect of diet on plasma urate level was estimated by regressing plasma urate on intakes of selected foods and nutrients in a subsample of 1,387 men. Coefficients of this regression model were then used to calculate a dietary urate index for all cohort participants. Multivariate relative risks of PD were estimated by means of Cox proportional hazards models. After 14 years of follow-up (1986-2000), the authors documented 248 incident cases of PD. A higher dietary urate index was associated with a lower risk of PD (top quintile vs. bottom: relative risk = 0.47, p-trend = 0.0008), after adjustment for age, smoking, caffeine intake, and other potential confounders. This association remained strong and significant after further adjustment for each component of the index individually (p-trend < 0.02 for each). These data support urate as a potentially protective factor in PD and suggest that dietary changes expected to increase plasma urate level may contribute to lower risk of PD. These potential benefits, however, should be weighed against expected adverse effects on risk of gout and other chronic diseases.
Keywords: diet, men, Parkinson disease, uric acid
Oxidative stress contributes to the loss of dopaminergic neurons in the substantia nigra of persons with Parkinson’s disease (PD) (1). Urate is a potent antioxidant that effectively scavenges reactive nitrogen and oxygen radicals (2), and persons with a high plasma urate level have a markedly lower risk of developing PD (3-5). Further, among patients with early PD, a higher plasma or cerebrospinal fluid urate concentration predicts slower clinical progression (6, 7). In a prospective study, persons with gout had a significantly lower risk of developing PD than persons without gout (8). The results of these studies suggest that urate could be a novel and tractable target for neuroprotective therapies, because plasma levels of urate can be increased through pharmacologic or dietary interventions. However, it remains unknown whether this association reflects the influence of dietary or endogenous determinants of serum urate level. A possible explanation for the association between higher plasma urate and lower PD risk or progression is that still-unknown genetic factors could affect both. It is therefore important to establish whether variations in plasma urate level that are due to exogenous factors are also related to risk of PD.
In the present study, we prospectively examined the relation between the uricemic potential of diet—assessed by means of a newly established, empirically derived dietary urate index—and risk of PD in a large cohort of US men. The primary hypothesis was that a prouricemic diet predicts a lower risk of PD.
MATERIALS AND METHODS
Study population
The investigation was conducted among men participating in the Health Professionals Follow-up Study, a prospective cohort study designed to examine the effects of diet on chronic diseases. The Health Professionals Follow-up Study was established in 1986, when 51,529 male US health professionals aged 40-75 years completed a mailed questionnaire about their medical history and lifestyle. Follow-up questionnaires have been mailed to participants every 2 years to obtain updated information on potential risk factors and to ascertain newly diagnosed diseases. Follow-up rates have averaged 94 percent in each 2- or 4-year cycle. As in previous analyses on diet and PD in this cohort (9, 10), we excluded participants who reported implausible energy intakes (<800 kcal/day or >4,200 kcal/day), left 70 or more items blank on the baseline dietary questionnaire, or had been previously diagnosed with PD, stroke, or cancer (other than nonmelanoma skin cancer). A total of 47,406 men were included in the analyses.
Assessment of dietary and nondietary exposures
Dietary intakes were assessed at baseline (1986) and every 4 years thereafter with a semiquantitative food frequency questionnaire validated for use in this population (11, 12). In brief, participants were asked how often (on average) over the previous year they had consumed a specific amount of each food item, with nine possible responses ranging from “never” to “six or more times per day.” Food composition values for nutrients were obtained from the Harvard University Food Composition Database, which was derived from US Department of Agriculture sources. The correlations between intakes of these foods as measured by a food frequency questionnaire and consumption of the same foods according to diet records were 0.79 for alcoholic beverages, 0.52-0.88 for dairy foods and dairy products, 0.56-0.83 for meats and fish, 0.78 for orange juice, 0.84 for soft drinks (cola), and 0.8 for vitamin C (11, 12).
Information on age, weight, height, smoking status, physical activity, and use of medicines was collected through questionnaires. Body mass index was calculated as weight (kg)/height (m)2.
Dietary urate index
Diet is an important determinant of uricemia, partly because of its content in purines (13), which are the metabolic precursors of urate, and partly through indirect effects on purine metabolism. For example, fructose and alcohol are prouricemic, whereas dairy proteins and vitamin C are antiuricemic (14-18). Although the short-term effects of each nutrient on plasma urate have been demonstrated in experimental studies, for the purpose of our investigation we were interested in the long-term chronic effects of diet on uricemia, which may be different from the short-term effects estimated in experimental research. Further, experimental studies are typically conducted in small groups of highly selected subjects, and results may not generalize to larger, more heterogeneous populations. Therefore, we estimated the long-term effects of diet on uricemia by means of an empirical regression approach, using a large subset of study participants with available data on plasma urate level, as described below.
Derivation of predictive equation
To obtain an equation that predicted plasma urate level according to habitual diet, we used data from a subsample of 1,387 Health Professionals Follow-up Study participants previously selected for a prospective nested case-control study of uricemia and hypertension. Blood samples were collected in 1993 and 1994. A stepwise linear regression model was fitted, with plasma urate as the dependent variable and intakes of foods and nutrients known to affect uricemia as potential predictors (14-17, 19-24). Criteria for inclusion in the case-control study were: 1) blood sample drawn after fasting for ≥8 hours; 2) body mass index <30 in 1994; and 3) no history of hypertension in 1994 (25). The mean age of men in the subsample was similar to that of the entire cohort (61.1 years (standard deviation (SD), 8.6) vs. 61.2 years (SD, 9.5); because of the exclusion of obese men, their mean body mass index was slightly lower than the cohort average (25.0 (SD, 2.4) vs. 26.0 (SD, 3.6) in the cohort, both assessed in 1994). Urate concentrations were determined through oxidization with the specific enzyme uricase to form allantoin and hydrogen peroxide (Roche Diagnostics, Indianapolis, Indiana) at Boston Children’s Hospital Laboratory. The coefficient of variation for this assay, as determined using blind quality control specimens, was 2.7 percent. The mean plasma urate concentration was 6.0 mg/dl (SD, 1.2) (357 μmol/liter (SD, 71.4)).
In the stepwise model, we included 21 dietary components which may influence plasma urate level. To control for potential confounders, we forced the variables age, smoking, body mass index, caloric intake, and history of hypertension after blood collection into the stepwise regression model (see the Appendix for more details). After controlling for the covariates, the dietary variables selected through the stepwise procedure included dairy protein (regression coefficient (β) = -0.009, p = 0.01), alcohol (β = 0.013, p < 0.0001), fructose (β = 0.007, p = 0.02), and vitamin C (β = -0.0003, p < 0.0001). When we did not include history of hypertension after blood collection in the stepwise regression model, the same dietary items remained in the final model and the coefficients did not change. In addition, results were virtually identical when the stepwise regression was conducted only among the controls from the original case-control study.
Although total meat and fish/seafood intakes were not retained in the stepwise procedure in the present study, they are good sources of purines and were found to be significantly associated with plasma urate level in the Third National Health and Nutrition Examination Survey (20). Therefore, we constructed an additional regression model by adding these two variables to the model described above. The regression coefficients for this alternative model were -0.008 for dairy protein (g/day, p < 0.03), 0.014 for alcohol (g/day, p < 0.0001), -0.009 for fructose (g/day, p = 0.009), -0.0003 for vitamin C (mg/day, p < 0.0001), 0.06 for total meat (servings/day, p = 0.32), and 0.11 for total fish/seafood (servings/day, p = 0.37).
The correlation coefficients for correlation between predicted and observed plasma urate levels were similar in the main model and the alternative models (r = 0.23 and r = 0.24, respectively; p < 0.0001 for both). A similar correlation was found among the 103 men with blood samples who developed PD during follow-up (r = 0.19, p = 0.06).
Estimation of dietary urate index among all cohort participants
The predictive equations derived above were then applied to the food and nutrient consumption data reported on the baseline (1986) food frequency questionnaire for calculation of the corresponding “dietary urate index” for each cohort participant. We calculated two indices for each participant: 1) the main index based on consumption of dairy protein, alcohol, fructose, and vitamin C, referred to as the “dietary urate index,” and 2) an alternative index based on the same items in addition to total meat and seafood. Because our purpose in this study was to estimate the independent effects of diet on risk of PD, these indices were based on the dietary items only; we adjusted for age, body mass index, and other nondietary predictors of plasma urate level as potential confounders in the analysis. In secondary analyses, we derived similar indices using diet reported in 1986 to predict PD between 1986 and 1994 and the average of the 1986 and 1990 diets to predict PD risk between 1994 and 2000.
We further examined the reproducibility of the dietary urate index over time. The Pearson correlations for the indices obtained from four food frequency questionnaires during 1986-1998 ranged from 0.5 to 0.7 (p < 0.0001 for all) (see appendix table).
Ascertainment of PD
We identified new cases of PD by means of biennial self-reported questionnaires (10). We then asked the treating neurologist to complete a questionnaire to confirm the diagnosis of PD or to send a copy of the medical records. A case was confirmed if a diagnosis of PD was considered definite or probable by the treating neurologist or internist, or if the medical record included either a final diagnosis of PD made by a neurologist or evidence of at least two of the three cardinal signs (rest tremor, rigidity, bradykinesia) in the absence of features suggesting other diagnoses (26, 27). We conducted the review of medical records while blind to participants’ exposure status. Overall, the diagnosis was confirmed by the treating neurologist in 81 percent of the cases, by review of the medical records in 3 percent, and by the treating internist without further support in the remaining 16 percent. We also requested the death certificates of the deceased study participants and identified PD diagnoses that were not reported during regular follow-up (<2 percent). If PD was listed as a cause of death on the death certificate, we requested permission from the family to contact the treating neurologist or physician and followed the same procedure as for the nonfatal cases. In this analysis, we used only definite and probable cases of PD, as we did previously (9, 28).
Statistical analysis
We computed person-time of follow-up for each participant from the return date of the baseline questionnaire (1986) to the date of the occurrence of the first symptoms attributed to PD, the date of death, or the end of follow-up (January 31, 2000), whichever came first. We used the date of first symptoms as an outcome because PD patients may change their diet or other relevant behaviors before the disease is diagnosed. Baseline dietary urate indices were categorized into quintiles, and relative risks were calculated by dividing the incidence rate in each quintile by the rate in the lowest quintile. Multivariate-adjusted relative risks were derived from Cox proportional hazards models controlling for age (in months), smoking status (never smoker, past smoker, or current smoker of 1-14 cigarettes/day or ≥15 cigarettes/day), body mass index (<23, 23-24.9, 25-26.9, 27-29.9, or ≥30), physical activity (quintiles), use of diuretics (yes/no), use of nonsteroidal antiinflammatory drugs (yes/no), caloric intake (kcal/day), and caffeine intake (quintiles). All covariates were measured at baseline (1986).
We also examined potential interactions between the dietary urate index and baseline age (<60 years vs. ≥60 years), smoking status (never smoker vs. ever smoker), body mass index (<25 vs. ≥25), and caffeine intake (0-149 mg/day vs. ≥150 mg/day, based on median intake) by adding multiplicative terms to the models. To address the possibility that dietary changes caused by early symptoms of PD might affect the results, we conducted lag analyses by excluding the first 4 years of follow-up. Because the dietary urate indices were derived from a subsample of men who were free of hypertension and had a body mass index less than 30, we also conducted a sensitivity analysis restricted to participants who met the applicable criteria of the subsample. Given the possibility that some cases of PD were not reported to us, either because the disease was not diagnosed or because the participant was too sick to complete and return the questionnaire, we censored participants at the age of 75 years; few participants younger than 75 would be expected to be severely ill and to not report the diagnosis of PD.
RESULTS
After an average of 14 years of follow-up, we documented 248 incident cases of PD. Participants with a higher dietary urate index were more likely to smoke, more likely to take diuretics, and consumed larger amounts of caffeine and energy than those with a low urate index (table 1) but did not differ from persons with a lower urate index with regard to other covariates.
TABLE 1.
Baseline characteristics of participants in the Health Professionals Follow-up Study according to quintile of dietary urate index, 1986*
| Quintile (Q) of dietary urate index |
ptrend | |||||
|---|---|---|---|---|---|---|
| Q1 | Q2 | Q3 | Q4 | Q5 | ||
| Median predicted plasma uric acid level† (mg/dl) | 5.7 | 5.9 | 6.0 | 6.1 | 6.3 | |
| No. of Parkinson’s disease cases | 71 | 49 | 57 | 41 | 30 | |
| Age (years) | 53.9 | 53.9 | 53.9 | 53.9 | 54.0 | 0.16 |
| Current smoking (%) | 7.9 | 7.9 | 7.8 | 8.7 | 14.9 | <0.0001 |
| Past smoking (%) | 36.8 | 38.1 | 39.4 | 43.6 | 49.3 | <0.0001 |
| Body mass index‡ | 25.4 | 25.7 | 25.6 | 25.4 | 25.5 | 0.63 |
| Physical activity (metabolic equivalents/week) | 21.9 | 19.9 | 20.3 | 22.2 | 21.9 | 0.09 |
| Caloric intake (kcal/day) | 1,999 | 1,898 | 1,858 | 1,969 | 2,212 | <0.0001 |
| Caffeine intake (mg/day) | 192 | 215 | 223 | 235 | 281 | <0.0001 |
| Alcohol intake (g/day) | 3.9 | 4.2 | 5.6 | 10.7 | 32.1 | <0.0001 |
| Fructose intake (g/day) | 23.3 | 22.3 | 23.8 | 27.5 | 29.3 | <0.0001 |
| Vitamin C intake (mg/day) | 915 | 363 | 267 | 265 | 279 | <0.0001 |
| Dairy protein intake (g/day) | 23.3 | 17.3 | 13.2 | 12.1 | 12.1 | <0.0001 |
| Total meat intake (servings/day) | 1.3 | 1.3 | 1.3 | 1.4 | 1.5 | <0.0001 |
| Seafood intake (servings/day) | 0.40 | 0.37 | 0.39 | 0.40 | 0.41 | 0.002 |
| Use of diuretics (%) | 8.8 | 9.3 | 9.4 | 9.5 | 11.2 | <0.0001 |
| Use of nonaspirin nonsteroidal antiinflammatory drugs (%) | 6.8 | 5.9 | 5.5 | 5.7 | 6.3 | 0.13 |
Values were standardized to the age distribution of the overall cohort.
Predicted plasma urate value (mg/dl) = 5.94 + 1.07 × dietary urate index.
Weight (kg)/height (m)2.
Overall, we found that a higher dietary urate index was associated with a lower risk of PD. Comparing the top quintile of the index with the bottom quintile, the age- and smoking-adjusted relative risk of PD was 0.47 (95 percent confidence interval (CI): 0.30, 0.74; p-trend = 0.001). The results were not changed (relative risk (RR) = 0.47) after further adjustment for caffeine, body mass index, caloric intake, and other potential confounders (figure 1). To examine whether this association could be explained by any of the dietary factors included in the urate index, we further adjusted the analyses for each component of the index, one at a time. The relative risk for the highest quintile of the urate index versus the lowest remained significantly elevated after adjustment for vitamin C (RR = 0.39, 95 percent CI: 0.24, 0.64), dairy protein (RR = 0.53, 95 percent CI: 0.31, 0.88), fructose (RR = 0.49, 95 percent CI: 0.30, 0.78), and alcohol (RR = 0.45, 95 percent CI: 0.24, 0.83).
FIGURE 1.
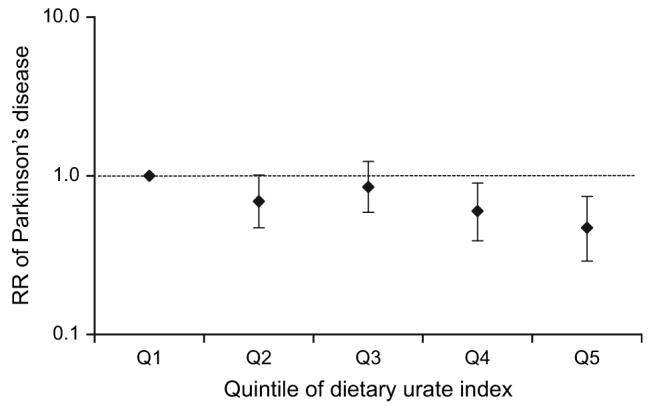
Relative risk (RR) of Parkinson’s disease according to quintile (Q) of baseline dietary urate index in the Health Professionals Follow-up Study, 1986-2000. Results were adjusted for age (in months), smoking status (never smoker, past smoker, or current smoker of 1-14 cigarettes/day or ≥15 cigarettes/day), body mass index (weight (kg)/height (m)2; <23, 23-24.9, 25-26.9, 27-29.9, or ≥30), use of nonsteroidal antiinflammatory drugs (yes/no), use of diuretics (yes/no), physical activity (quintiles), caloric intake (kcal/day), and caffeine intake (quintiles). p for trend = 0.0008. Bars, 95% confidence interval.
When considered individually, fructose, dairy protein, and alcohol were significantly or marginally significantly associated with PD risk in the direction consistent with their estimated effects on plasma urate level (table 2). Vitamin C was not related to PD risk. After further adjustment for the dietary urate index, greater intake of fructose remained a significant predictor of a lower PD risk, but the associations between dairy protein and alcohol and PD were much attenuated. In contrast, vitamin C intake became significantly associated with a lower risk of PD (for comparison of the two extreme categories, adjusted RR = 0.46, 95 percent CI: 0.21, 0.98; p-trend = 0.04).
TABLE 2.
Relative risk* of Parkinson’s disease according to baseline intakes of fructose, dairy protein, vitamin C, and alcohol, Health Professionals Follow-up Study, 1986-2000
| Category of intake |
ptrend | |||||
|---|---|---|---|---|---|---|
| 1 | 2 | 3 | 4 | 5 | ||
| Fructose (in quintiles) | ||||||
| No. of PD† cases | 46 | 48 | 57 | 58 | 39 | |
| Median intake (g/day) | 10.8 | 17.0 | 22.4 | 29.0 | 42.5 | |
| RR† | 1 | 0.80 | 0.89 | 0.85 | 0.49 | 0.01 |
| 95% CI† | 0.53, 1.23 | 0.59, 1.36 | 0.55, 1.32 | 0.29, 0.84 | ||
| Vitamin C | ||||||
| No. of PD cases | 125 | 56 | 34 | 24 | 9 | |
| Intake (mg/day) | <250 | 250-499 | 500-999 | 1,000-1,499 | ≥1,500 | |
| RR | 1 | 1.05 | 0.88 | 1.44 | 0.78 | 0.87 |
| 95% CI | 0.75, 1.48 | 0.58, 1.32 | 0.92, 2.27 | 0.39, 1.57 | ||
| Alcohol | ||||||
| No. of PD cases | 72 | 98 | 52 | 9 | 17 | |
| Intake (g/day) | 0 | 0.1-9 | 10-19 | 20-29 | ≥30 | |
| RR | 1 | 0.96 | 1.07 | 0.58 | 0.58 | 0.06 |
| 95% CI | 0.69, 1.33 | 0.73, 1.57 | 0.26, 1.29 | 0.33, 1.03 | ||
| Dairy protein (in quintiles) | ||||||
| No. of PD cases | 39 | 41 | 49 | 48 | 71 | |
| Median intake (g/day) | 5.1 | 9.3 | 12.9 | 17.9 | 29.5 | |
| RR | 1 | 1.05 | 1.25 | 1.36 | 1.83 | 0.003 |
| 95% CI | 0.66, 1.67 | 0.80, 1.96 | 0.86, 2.16 | 1.17, 2.87 | ||
Adjusted for age (in months), smoking status (never smoker, past smoker, or current smoker of 1-14 cigarettes/day or ≥15 cigarettes/day), body mass index (weight (kg)/height (m)2; <23, 23-24.9, 25-26.9, 27-29.9, or ≥30), use of nonsteroidal antiinflammatory drugs (yes/no), use of diuretics (yes/no), physical activity (quintiles), caloric intake (kcal/day), and caffeine intake (quintiles).
PD, Parkinson’s disease; RR, relative risk; CI, confidence interval.
We conducted several sensitivity analyses to examine the robustness of our findings and observed similar significant associations. When we used an alternative urate index which further included meat and seafood, the results did not materially change. The multivariate-adjusted relative risk for the highest urate index quintile versus the lowest was 0.44 (95 percent CI: 0.27, 0.70; p-trend = 0.0002). After exclusion of subjects with gout at baseline, the relative risk for the highest urate index quintile versus the lowest was 0.46 (95 percent CI: 0.28, 0.75; p-trend = 0.001). In the 4-year lag analyses, the multivariate relative risks changed slightly, relative to the primary analyses. The relative risks were 1.0 (referent), 0.73, 0.94, 0.58, and 0.42 (95 percent CI: 0.25, 0.71; p-trend = 0.0007) for quintiles 1-5 of the urate index. When we excluded participants with a body mass index ≥30 or with reported hypertension, the multivariate-adjusted relative risks across quintiles of the index were 1.0 (referent), 0.64, 0.85, 0.58, and 0.38 (95 percent CI: 0.21, 0.69; p-trend = 0.001). Similar significant results were obtained when we used the cumulative average dietary urate index (for highest quintile vs. lowest, RR 0.55, 95 percent CI: 0.35, 0.87; p-trend = 0.01) and when we censored participants at the age of 75 years (for highest quintile vs. lowest, RR = 0.45, 95 percent CI: 0.26, 0.76; p-trend = 0.001). Similar patterns were seen for PD cases diagnosed by neurologists and PD cases diagnosed by nonneurologists. The adjusted relative risks across quintiles of the index were 1.0 (referent), 0.68, 0.84, 0.61, and 0.42 (p-trend = 0.001) for cases diagnosed by neurologists and 1.0 (referent), 0.63, 0.76, 0.55, and 0.55 for cases diagnosed by nonneurologists (p-trend = 0.20).
We did not find significant interactions between the dietary urate index and age, smoking status, body mass index, or caffeine intake at baseline (table 3). The association between a higher urate index and a lower PD risk was evident in subgroup analyses carried out according to age, smoking status, body mass index, and caffeine intake.
TABLE 3.
Relative risk* of Parkinson’s disease in the fifth quintile of dietary urate index versus the first, according to baseline age, smoking status, body mass index, and caffeine intake, Health Professionals Follow-up Study, 1986-2000
| Age (years) |
Smoking |
Body mass index† |
Caffeine intake (mg/day) |
|||||
|---|---|---|---|---|---|---|---|---|
| <60 | ≥60 | Never | Ever | <25 | ≥25 | <150 | ≥150 | |
| Relative risk | 0.56 | 0.43 | 0.39 | 0.49 | 0.45 | 0.45 | 0.41 | 0.52 |
| 95% confidence interval | 0.25, 1.24 | 0.24, 0.76 | 0.19, 0.82 | 0.26, 0.92 | 0.22, 0.90 | 0.23, 0.87 | 0.22, 0.77 | 0.25, 1.09 |
| ptrend | 0.09 | 0.004 | 0.007 | 0.03 | 0.01 | 0.02 | 0.002 | 0.09 |
| pinteraction | 0.78 | 0.71 | 0.80 | 0.54 | ||||
Adjusted for age (in months), smoking status (never smoker, past smoker, or current smoker of 1-14 cigarettes/day or ≥15 cigarettes/day), body mass index (weight (kg)/height (m)2; <23, 23-24.9, 25-26.9, 27-29.9, or ≥30), use of nonsteroidal antiinflammatory drugs (yes/no), use of diuretics (yes/no), physical activity (quintiles), caloric intake (kcal/day), and caffeine intake (quintiles).
Weight (kg)/height (m)2.
DISCUSSION
In this large prospective study with 14 years of follow-up, we found that men with diets which may increase plasma urate level had a significantly reduced risk of developing PD: A greater than twofold reduction in risk was observed between the highest and lowest quintiles of a dietary urate index that summarizes the combined effects of diet on plasma urate level. Our results are unlikely to have been affected by recall or selection bias because of the prospective study design. The robustness of this association was further supported by a variety of sensitivity analyses.
Our results are consistent with the previous observations in several longitudinal studies that higher plasma urate level predicts a lower risk of PD (3-5) and with the recent finding that higher plasma urate level predicts a slower clinical progression of PD (6, 7). Earlier pathologic studies had demonstrated that PD patients had a lower cerebrospinal fluid urate or xanthine concentration than controls (29). However, neither the serologic studies nor the pathologic studies were able to exclude the possibility that the association between higher urate concentration and a lower risk of PD results from genetic factors causing both a decrease in plasma urate level and an increase in susceptibility to PD. In contrast, the results of the present study, suggesting that diet-dependent changes in plasma urate level modify PD risk, provide support for a protective effect of urate per se or of its metabolic correlates.
Experimental evidence also supports a potential role of urate in the pathogenesis of PD. Urate reduces oxidative stress primarily through its actions as an effective scavenger of peroxynitrite and hydroxyl radicals (2, 30). Urate completely prevented the death of the dopaminergic cells in culture induced by homocysteine plus rotenone or iron (31). Possible mechanisms for a neuroprotective action of urate include suppression of oxyradical accumulation and preservation of mitochondrial function (32), inhibition of the cytotoxic activity of lactoperoxidase (33), and protection from dopamine-induced apoptosis (34).
The interpretation that urate protects against PD, how-ever, seems at odds with the observation that the major nondietary determinants of hyperuricemia, such as male gender, obesity, and hypertension, either are not associated with PD risk or are associated with increased risk (35-37). A possible explanation for this discrepancy is that other factors associated with male gender, obesity, and hypertension may increase the risk of PD and thus counteract a protective effect of increased plasma urate level. These factors may include higher occupational exposure to neurotoxic chemicals in men as compared with women (38), a protective effect of estrogen (39), an inverse relation between obesity and the availability of dopamine D2 receptor in the striatum (40), and effects of the renin-angiotensin system on dopamine release (41). Alternatively, the lower risk of PD among persons with high plasma urate levels could reflect confounding by still-unknown genetic or environmental factors. In a recent study, coffee consumption, which is inversely related to PD risk in men (10), was found to be associated with lower plasma urate levels (42). However, neither caffeine intake nor coffee consumption was related to plasma urate in our cohort. More studies are needed to elucidate the association.
The empirically derived urate index is also consistent with previous observations on diet and risk of gout among men in this cohort. We found that intakes of alcohol (24) and fructose were associated with an increased risk of gout, while intakes of dairy food (21) and vitamin C were associated with a lower risk.
Ingestion of both fructose and ethanol, by increasing the degradation of adenine nucleotides, leads to increased synthesis of inosine, hypoxanthine, and xanthine, which is then converted to urate by xanthine oxidase (14, 16, 18). The activation of this purinergic pathway within the brain, rather than the final increase in plasma urate level, could be the relevant determinant of PD risk. This explanation, however, may not clearly explain the strong association between greater consumption of dairy food and the higher PD risk observed in this study and previous studies (9, 43), because the antiuricemic effects of dairy protein seem to be mostly due to increased uricosuria (15). Another possible explanation is that these dietary factors could modulate transport of urate through the blood-brain barrier. We also observed that increased vitamin C intake was associated with a lower plasma urate concentration, which is consistent with results from clinical trials (17). Vitamin C could increase urate excretion by competing with urate for renal reabsorption (17). The lack of an association between greater vitamin C intake and higher PD risk may be due to the possibility that the hypouricemic effect of vitamin C could be offset by its function as a powerful antioxidant. After adjustment for the dietary urate index, a greater intake of vitamin C was significantly associated with a lower risk of PD.
Strengths of this study include the large population, the longitudinal design, and the high rate of follow-up. The main limitation of the present study was that, because of its observational design, we could not exclude the possibility that the association between the urate index and PD risk resulted from some unmeasured underlying common determinate(s). In addition, the clinical diagnosis of PD is not perfect, and thus some degree of diagnostic error is likely to have been present. In a recent large clinicopathologic study, however, the positive predictive value of a clinical diagnosis of PD was found to be 90 percent or higher (44); thus, bias from this source is likely to have been modest.
In this large longitudinal investigation carried out among US men, we found that a diet expected to increase plasma urate level was associated with a reduced risk of PD. This result, together with previous findings that uricemia not only is a strong negative risk factor for PD (4) but also predicts slower clinical progression of PD (6, 7), supports a possible neuroprotective effect of urate or its precursors in PD pathogenesis and suggests that dietary modulation of plasma urate may play a role in the prevention and treatment of PD.
ACKNOWLEDGMENTS
This study was supported by National Institutes of Health/National Institute of Neurological Disorders and Stroke grant R01 NS048517, TAP Pharmaceutical Products, Inc. (Lake Forest, Illinois), and the Alfreda Louise Kwiecien Parkinson’s Research Fund. The study was also supported in part by the Intramural Research Program of the National Institutes of Health, National Institute of Environmental Health Sciences.
None of the sponsors participated in the design of the study or in the collection, analysis, or interpretation of the data.
Conflict of interest: none declared.
Abbreviations
- CI
confidence interval
- PD
Parkinson’s disease
- RR
relative risk
- SD
standard deviation
APPENDIX Derivation of Dietary Urate Index
For derivation of the dietary urate index, the following foods and nutrients were considered in a stepwise model: total meat (servings/day), seafood (servings/day), dairy protein (g/day), individual dairy foods and dairy products (milk, yogurt, cheese, cream, and ice cream; servings/day), alcohol (g/day), individual alcoholic beverages (liquor, beer, and wine; servings/day), vitamin C (mg/day), fructose (g/day), sucrose (g/day), vegetables (servings/day), legumes and soybean products (servings/day), flavonoids (mg/day), folate (mg/day), coffee (cups/day), and caffeine (mg/day). Dairy protein has been suggested to be a major contributor to the association between dairy food intake and plasma urate concentration (15, 20). However, because of the possibility that nonprotein components could also contribute to the association, we included both dairy protein and individual dairy items as possible predictors of plasma urate level. The same rationale was used for considering as possible predictors both alcohol and individual alcoholic beverages. The significance levels were set a priori at 0.2 for entry into the model and at 0.1 for staying in the model. To control for potential confounders, we forced the following covariates, obtained from the 1994 follow-up questionnaire, into the stepwise regression model: age (in months), smoking status (never smoker, past smoker, or current smoker of 1-14 cigarettes/day or ≥15 cigarettes/day), body mass index (weight (kg)/height (m)2; <23, 23-24.9, 25-26.9, or 27-29.9), caloric intake (kcal/day), and history of hypertension after blood collection (yes/no).
APPENDIX TABLE.
Pearson correlations for dietary urate indices obtained from four food frequency questionnaires completed during 1986-1998, Health Professionals Follow-up Study*
| 1986 | 1990 | 1994 | 1998 | |
|---|---|---|---|---|
| 1986 | 0.68 | 0.61 | 0.53 | |
| 1990 | 0.68 | 0.58 | ||
| 1994 | 0.65 |
p < 0.0001 for all correlations.
REFERENCES
- 1.Jenner P. Oxidative stress in Parkinson’s disease. Ann Neurol. 2003;53(suppl 3):S26–36. doi: 10.1002/ana.10483. [DOI] [PubMed] [Google Scholar]
- 2.Ames BN, Cathcart R, Schwiers E, et al. Uric acid provides an antioxidant defense in humans against oxidant- and radical-caused aging and cancer: a hypothesis. Proc Natl Acad Sci U S A. 1981;78:6858–62. doi: 10.1073/pnas.78.11.6858. [DOI] [PMC free article] [PubMed] [Google Scholar]
- 3.de Lau LM, Koudstaal PJ, Hofman A, et al. Serum uric acid levels and the risk of Parkinson disease. Ann Neurol. 2005;58:797–800. doi: 10.1002/ana.20663. [DOI] [PubMed] [Google Scholar]
- 4.Weisskopf MG, O’Reilly EJ, Chen H, et al. Plasma urate and risk of Parkinson’s disease. Am J Epidemiol. 2007;165:561–7. doi: 10.1093/aje/kwm127. [DOI] [PMC free article] [PubMed] [Google Scholar]
- 5.Davis JS, Grandinetti A, Waslien CI, et al. Observations on serum uric acid and the risk of idiopathic Parkinson’s disease. Am J Epidemiol. 1996;144:480–4. doi: 10.1093/oxfordjournals.aje.a008954. [DOI] [PubMed] [Google Scholar]
- 6.Ascherio A, LeWitt PA, Watts A, et al. CSF as well as serum urate are predictors of Parkinson’s disease progression; Presented at the 10th International Congress of Parkinson’s Disease and Movement Disorders; Kyoto, Japan. October 28-November 2, 2006; Abstract. [Google Scholar]
- 7.Schwarzschild MA, Schwid SR, Marek K, et al. Serum urate level predicts progression of Parkinson’s disease. Arch Neurol. in press. [Google Scholar]
- 8.Alonso A, Rodriguez LA, Logroscino G, et al. Gout and risk of Parkinson disease: a prospective study. Neurology. 2007;69:1696–700. doi: 10.1212/01.wnl.0000279518.10072.df. [DOI] [PubMed] [Google Scholar]
- 9.Chen H, Zhang SM, Hernan MA, et al. Diet and Parkinson’s disease: a potential role of dairy products in men. Ann Neurol. 2002;52:793–801. doi: 10.1002/ana.10381. [DOI] [PubMed] [Google Scholar]
- 10.Ascherio A, Zhang SM, Hernan MA, et al. Prospective study of caffeine consumption and risk of Parkinson’s disease in men and women. Ann Neurol. 2001;50:56–63. doi: 10.1002/ana.1052. [DOI] [PubMed] [Google Scholar]
- 11.Feskanich D, Rimm EB, Giovannucci EL, et al. Reproducibility and validity of food intake measurements from a semiquantitative food frequency questionnaire. J Am Diet Assoc. 1993;93:790–6. doi: 10.1016/0002-8223(93)91754-e. [DOI] [PubMed] [Google Scholar]
- 12.Rimm EB, Giovannucci EL, Stampfer MJ, et al. Reproducibility and validity of an expanded self-administered semiquantitative food frequency questionnaire among male health professionals. Am J Epidemiol. 1992;135:1114–26. doi: 10.1093/oxfordjournals.aje.a116211. [DOI] [PubMed] [Google Scholar]
- 13.Fam AG. Gout: excess calories, purines, and alcohol intake and beyond. Response to a urate-lowering diet. J Rheumatol. 2005;32:773–7. [PubMed] [Google Scholar]
- 14.Mayes PA. Intermediary metabolism of fructose. Am J Clin Nutr. 1993;58(suppl):754S–65S. doi: 10.1093/ajcn/58.5.754S. [DOI] [PubMed] [Google Scholar]
- 15.Garrel DR, Verdy M, PetitClerc C, et al. Milk- and soy-protein ingestion: acute effect on serum uric acid concentration. Am J Clin Nutr. 1991;53:665–9. doi: 10.1093/ajcn/53.3.665. [DOI] [PubMed] [Google Scholar]
- 16.Yamamoto T, Moriwaki Y, Takahashi S. Effect of ethanol on metabolism of purine bases (hypoxanthine, xanthine, and uric acid) Clin Chim Acta. 2005;356:35–57. doi: 10.1016/j.cccn.2005.01.024. [DOI] [PubMed] [Google Scholar]
- 17.Huang HY, Appel LJ, Choi MJ, et al. The effects of vitamin C supplementation on serum concentrations of uric acid: results of a randomized controlled trial. Arthritis Rheum. 2005;52:1843–7. doi: 10.1002/art.21105. [DOI] [PubMed] [Google Scholar]
- 18.Gao X, Qi L, Qiao N, et al. Intake of added sugar and sugar-sweetened drink and serum uric acid concentration in US men and women. Hypertension. 2007;50:306–12. doi: 10.1161/HYPERTENSIONAHA.107.091041. [DOI] [PubMed] [Google Scholar]
- 19.Lee SJ, Terkeltaub RA, Kavanaugh A. Recent developments in diet and gout. Curr Opin Rheumatol. 2006;18:193–8. doi: 10.1097/01.bor.0000209434.82096.1f. [DOI] [PubMed] [Google Scholar]
- 20.Choi HK, Liu S, Curhan G. Intake of purine-rich foods, protein, and dairy products and relationship to serum levels of uric acid: The Third National Health and Nutrition Examination Survey. Arthritis Rheum. 2005;52:283–9. doi: 10.1002/art.20761. [DOI] [PubMed] [Google Scholar]
- 21.Choi HK, Atkinson K, Karlson EW, et al. Purine-rich foods, dairy and protein intake, and the risk of gout in men. N Engl J Med. 2004;350:1093–103. doi: 10.1056/NEJMoa035700. [DOI] [PubMed] [Google Scholar]
- 22.Oster KA. Folic acid and xanthine oxidase. Ann Intern Med. 1977;86:367. doi: 10.7326/0003-4819-86-3-367. Letter. [DOI] [PubMed] [Google Scholar]
- 23.Lotito SB, Frei B. Consumption of flavonoid-rich foods and increased plasma antioxidant capacity in humans: cause, consequence, or epiphenomenon? Free Radic Biol Med. 2006;41:1727–46. doi: 10.1016/j.freeradbiomed.2006.04.033. [DOI] [PubMed] [Google Scholar]
- 24.Choi HK, Atkinson K, Karlson EW, et al. Alcohol intake and risk of incident gout in men: a prospective study. Lancet. 2004;363:1277–81. doi: 10.1016/S0140-6736(04)16000-5. [DOI] [PubMed] [Google Scholar]
- 25.Forman JP, Choi H, Curhan GC. Plasma uric acid level and risk for incident hypertension among men. J Am Soc Nephrol. 2007;18:287–92. doi: 10.1681/ASN.2006080865. [DOI] [PubMed] [Google Scholar]
- 26.Ward CD, Gibb WR. Research diagnostic criteria for Parkinson’s disease. Adv Neurol. 1990;53:245–9. [PubMed] [Google Scholar]
- 27.Samii A, Nutt JG, Ransom BR. Parkinson’s disease. Lancet. 2004;363:1783–93. doi: 10.1016/S0140-6736(04)16305-8. [DOI] [PubMed] [Google Scholar]
- 28.Hernan MA, Chen H, Schwarzschild MA, et al. Alcohol consumption and the incidence of Parkinson’s disease. Ann Neurol. 2003;54:170–5. doi: 10.1002/ana.10611. [DOI] [PubMed] [Google Scholar]
- 29.Tohgi H, Abe T, Takahashi S, et al. The urate and xanthine concentrations in the cerebrospinal fluid in patients with vascular dementia of the Binswanger type, Alzheimer type dementia, and Parkinson’s disease. J Neural Transm Park Dis Dement Sect. 1993;6:119–26. doi: 10.1007/BF02261005. [DOI] [PubMed] [Google Scholar]
- 30.Hooper DC, Scott GS, Zborek A, et al. Uric acid, a peroxynitrite scavenger, inhibits CNS inflammation, blood-CNS barrier permeability changes, and tissue damage in a mouse model of multiple sclerosis. FASEB J. 2000;14:691–8. doi: 10.1096/fasebj.14.5.691. [DOI] [PubMed] [Google Scholar]
- 31.Duan W, Ladenheim B, Cutler RG, et al. Dietary folate deficiency and elevated homocysteine levels endanger dopaminergic neurons in models of Parkinson’s disease. J Neurochem. 2002;80:101–10. doi: 10.1046/j.0022-3042.2001.00676.x. [DOI] [PubMed] [Google Scholar]
- 32.Yu ZF, Bruce-Keller AJ, Goodman Y, et al. Uric acid protects neurons against excitotoxic and metabolic insults in cell culture, and against focal ischemic brain injury in vivo. J Neurosci Res. 1998;53:613–25. doi: 10.1002/(SICI)1097-4547(19980901)53:5<613::AID-JNR11>3.0.CO;2-1. [DOI] [PubMed] [Google Scholar]
- 33.Everse J, Coates PW. The cytotoxic activity of lactoperoxidase: enhancement and inhibition by neuroactive compounds. Free Radic Biol Med. 2004;37:839–49. doi: 10.1016/j.freeradbiomed.2004.06.017. [DOI] [PubMed] [Google Scholar]
- 34.Jones DC, Gunasekar PG, Borowitz JL, et al. Dopamine-induced apoptosis is mediated by oxidative stress and is enhanced by cyanide in differentiated PC12 cells. J Neurochem. 2000;74:2296–304. doi: 10.1046/j.1471-4159.2000.0742296.x. [DOI] [PubMed] [Google Scholar]
- 35.Grandinetti A, Morens DM, Reed D, et al. Prospective study of cigarette smoking and the risk of developing idiopathic Parkinson’s disease. Am J Epidemiol. 1994;139:1129–38. doi: 10.1093/oxfordjournals.aje.a116960. [DOI] [PubMed] [Google Scholar]
- 36.Mayeux R, Marder K, Cote LJ, et al. The frequency of idiopathic Parkinson’s disease by age, ethnic group, and sex in Northern Manhattan, 1988-1993. Am J Epidemiol. 1995;142:820–7. doi: 10.1093/oxfordjournals.aje.a117721. [DOI] [PubMed] [Google Scholar]
- 37.Hu G, Jousilahti P, Nissinen A, et al. Body mass index and the risk of Parkinson disease. Neurology. 2006;67:1955–9. doi: 10.1212/01.wnl.0000247052.18422.e5. [DOI] [PubMed] [Google Scholar]
- 38.Ascherio A, Chen H, Weisskopf MG, et al. Pesticide exposure and risk for Parkinson’s disease. Ann Neurol. 2006;60:197–203. doi: 10.1002/ana.20904. [DOI] [PubMed] [Google Scholar]
- 39.Currie LJ, Harrison MB, Trugman JM, et al. Postmenopausal estrogen use affects risk for Parkinson disease. Arch Neurol. 2004;61:886–8. doi: 10.1001/archneur.61.6.886. [DOI] [PubMed] [Google Scholar]
- 40.Wang GJ, Volkow ND, Logan J, et al. Brain dopamine and obesity. Lancet. 2001;357:354–7. doi: 10.1016/s0140-6736(00)03643-6. [DOI] [PubMed] [Google Scholar]
- 41.Lopez-Real A, Rey P, Soto-Otero R, et al. Angiotensin-converting enzyme inhibition reduces oxidative stress and protects dopaminergic neurons in a 6-hydroxydopamine rat model of Parkinsonism. J Neurosci Res. 2005;81:865–73. doi: 10.1002/jnr.20598. [DOI] [PubMed] [Google Scholar]
- 42.Choi HK, Curhan G. Coffee, tea, and caffeine consumption and serum uric acid level: The Third National Health and Nutrition Examination Survey. Arthritis Rheum. 2007;57:816–21. doi: 10.1002/art.22762. [DOI] [PubMed] [Google Scholar]
- 43.Park M, Ross GW, Petrovitch H, et al. Consumption of milk and calcium in midlife and the future risk of Parkinson disease. Neurology. 2005;64:1047–51. doi: 10.1212/01.WNL.0000154532.98495.BF. [DOI] [PubMed] [Google Scholar]
- 44.Hughes AJ, Daniel SE, Lees AJ. Improved accuracy of clinical diagnosis of Lewy body Parkinson’s disease. Neurology. 2001;57:1497–9. doi: 10.1212/wnl.57.8.1497. [DOI] [PubMed] [Google Scholar]