

Abstract
Neuritic outgrowth is a striking example of directed motility, powered through the actions of molecular motors. Members of the myosin superfamily of actin-associated motors have been implicated in this complex process. Although conventional myosin II is known to be present in neurons, where it is localized at the leading edge of growth cones and in the cell cortex close to the plasma membrane, its functional involvement in growth cone motility has remained unproven. Here, we show that antisense oligodeoxyribonucleotides, complementary to a specific isoform of conventional myosin (myosin IIB), attenuate filopodial extension whereas sense and scrambled control oligodeoxyribonucleotides have no effect. Attenuation is shown to be reversible, neurite outgrowth being restored after cessation of the antisense regimen. Myosin IIB mRNA was present during active neurite extension, but levels were minimal in phenotypically rounded cells before neurite outgrowth and message levels decreased during antisense treatment. By contrast, the myosin IIA isoform is shown to be expressed constitutively both before and during neurite outgrowth and throughout exposure to myosin IIB antisense oligodeoxyribonucleotides. These results provide direct evidence that a conventional two-headed myosin is required for growth cone motility and is responsible, at least in part, for driving neuritic process outgrowth.
Filopodial extension, growth cone motility, and neurite outgrowth are important characteristics of developing neurons, their combined action playing an essential role in the formation of the nervous system during development and in axonal regeneration, including the restoration of connectivity, after injury (1). Little is known of the mechanisms underlying these aspects of directed motility in vertebrate neurons, but the participation of a number of molecular motors belonging to the myosin superfamily has been proposed. Thirty years ago, conventional, two-headed myosin II was first shown to be present in brain and neuronally derived material (2, 3). Since then, myosin I (4–6), myosin II (6–11), and myosin V (12, 13) have been observed at the leading edge of neuritic growth cones, often located in close proximity to the plasma membrane. Such observations suggest that these molecular motors may each perform distinct yet integrated tasks that facilitate force generation during the complex motions of growth cone advance.
However, defining localization is not the same as defining function. Myosin V has been shown, by the technique of microscale chromophore-assisted laser inactivation, to play a role in neuronal growth cone filopodial extension (13). Yet neither microscale chromophore-assisted laser inactivation (13) nor our preliminary antisense studies have been able to implicate myosin I in the directed motility of neuronal cells—even though myosin I isoforms have been shown to be involved in the mechanism of locomoting amoebae (14, 15). Although recent fusion protein expression studies on live amoebae suggest that myosin II also may be found at the tips of pseudopodia (16), leading to a reevaluation of earlier immunofluorescence work (15), myosin II gene knockouts of amoebae (17, 18) were unable to eliminate forward locomotion. It is important to stress, however, that the roles of molecular motors in these very different cell types, slime mold amoebae and mammalian neuronal cells, may not be the same.
Although an increasing body of evidence has suggested an involvement of myosin II in neuronal growth cone function, this has not yet been demonstrated directly. Although 2,3-butanedione-2-monoxime has been used to provide circumstantial evidence for an involvement of myosin II in growth cone motility (10, 11), it has been shown to knock out both myosin II and myosin V activity (19), and there is no consensus as to how this compound exerts its effects in either muscle (20, 21) or neuronal (20, 22) cells. Nevertheless, the cellular localization of myosin II (6–11) noted above, together with inferences that myosin may be the downstream target during Rho-stimulated cellular contractility and neurite retraction (23, 24), indicate that it is crucial to establish directly whether myosin II isoforms play a functional role in neuritogenesis. Here, we have made use of a functional knockout approach to assess whether myosin II action is required for neurite outgrowth. Of the two nonmuscle conventional myosin gene products (25, 26, 27), termed myosins IIA and IIB, it is the IIB isoform that predominates in mature cells of neuronal origin, comprising at least 70% of expressed myosin II (6, 9, 25, 26, 28). In this study, we have used antisense oligodeoxyribonucleotides targeting myosin IIB transcripts within cultured mouse neuroblastoma cells.
MATERIALS AND METHODS
Mouse neuroblastoma cells (Neuro-2A), cultured as described (6), were transferred to serum-free media and treated, separately, with sense (BQ5 or B5), antisense (BQ3 or B3), and scrambled (BQ3R or B3R) oligonucleotides every 12 hours for a total of 96 hours. To monitor recovery, observations and quantitation were extended for up to 168 hours after the first treatment. After initial incubation with oligonucleotide at a concentration of 50 μM, 25 μM supplements of oligonucleotide were added every 12 hours, to compensate for oligonucleotide degradation (29). In addition to untreated cells, controls included sense (BQ5 or B5) and scrambled (BQ3R or B3R) oligonucleotide treatments, the latter corresponding in base composition to that of the antisense oligonucleotide except that the sequence was scrambled (but did not match any other entry in the database). To generate the data shown in large-scale experiments, such as seen in Fig. 2a, eight separate cultures were commenced simultaneously for each treatment. Cells were observed by both differential interference contrast (DIC) and indirect immunofluorescence microscopy by using a Zeiss Axiovert 135 inverted microscope, representative images being photographed at every time point for each treatment. The antibodies used in this study were polyclonal rabbit anti-nonmuscle myosin II (Biogenesis, Bournemouth, U.K.) and fluorescein-conjugated goat anti-rabbit IgG (Sigma). Results from experiments involving BQ3, BQ5, and BQ3R are shown in detail; results from experiments involving B3, B5, and B3R are not shown and were quantitatively less pronounced. This was possibly a reflection of the fact that the B-series of oligonucleotides was derived from a human myosin sequence that exhibits a five-base mismatch as compared with the rodent myosin sequence from which the BQ-series was derived (28, 30). Measurement of individual neurite lengths (Seescan, Cambridge, U.K.) from the tip of the neurite to the edge of the cell soma, together with the number of neurites per cell, was possible through the use of DIC optics, all processes being clearly visible.
Figure 2.
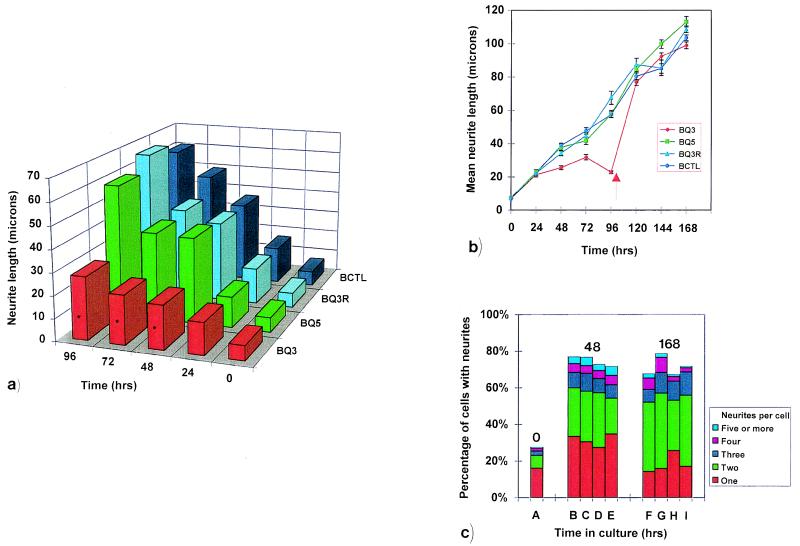
The effect of antisense oligonucleotides, derived from myosin IIB sequence, on neurite outgrowth from cultured mouse Neuro-2A cells. Data was collected from 65 to 382 cells that were measured at every time point. The average number of cells measured in a, b, and c below were, respectively, 219, n = 17; 198, n = 29; 312, n = 9, where n is the number of data sets. (a) Histogram of representative experiment (one of four) demonstrating the effect of oligonucleotide treatments on median neurite length from bipolar cells over a 96-hour period. Application of the Mann–Whitney u test at each of the 48-, 72-, and 96-hour time points shows that BQ3 (antisense, red) treatment leads to neurite lengths that are significantly different (asterisks indicate P < 0.05) from those arising from BQ5 (sense, green), BQ3R (scrambled, blue), or BCTL (untreated, cyan) controls. A nonparametric test was chosen because both the raw data for all length measurements and their logarithmic transformations did not display a Gaussian distribution, as determined by an Anderson–Darling plot analysis (it may be noted that such discrimination was only possible because of the large number of cells measured at each time point in this study). (b) Effect of recovery from oligonucleotide treatment on mean neurite length representative of the entire cell population. After 96 hours, cells were incubated in oligonucleotide-free media (arrow). SEM is shown for every time point. (c) The effect of oligonucleotide treatment on the number of neurites arising from each cell at zero (column A), 48 (columns B–E), and 168 (columns F–I) hours. χ2 analysis indicates that, at any one time point, the number of neurites per cell is not affected by the form of oligonucleotide treatment. Cells were either untreated (BCTL, columns A, B, and F) or treated with scrambled (BQ3R, columns C and G), sense (BQ5, columns D and H), or antisense (BQ3, columns E and I) oligonucleotides.
Total RNA was isolated by use of Trizol reagent (Life Technologies, Paisley, Scotland) through a single step procedure (31). Before RNA precipitation, 5–10 μg of RNase-free glycogen (Boehringer–Mannheim) was added to the aqueous phase as a carrier. During cDNA production, first strand synthesis was primed by the use of random hexamers (CLONTECH) to ensure complete representation of the myosin transcript. The reverse transcriptase (RT)–PCR was performed by using standard procedures (32), RNA samples being harvested from ≈3 × 10⁵ Neuro-2A cells at each time point. RT-PCR was performed by using 35 (Fig. 3) or 42 (Fig. 4) cycles of amplification (94° for 45 sec; 60° (Fig. 3) or 62° (Fig. 4) for 1 min; 72° for 2 min; and a final 7-min extension at 72°. Primers used for myosin IIB were 5′-CATCTACAACCCTGCCACTCA-3′ (upstream primer: a 21-mer from U34303 (30), located 60 bases downstream from the ATG start site) and BQ3 (downstream primer), giving rise to an 870-bp amplification product. Primers used for the myosin IIA isoform were 5′-TCCTGGCTATAAGTCACCATG-3′ (upstream primer) and 5′-AGGCCTCTAGGATAGGGTTG-3′ (downstream primer), giving rise to a 680-bp amplification product. The sequence of the upstream primer (U31463; ref. 33) begins at residue −18 before the ATG start site (italicized); the sequence of the downstream primer is complementary to the sequence that codes for NPILEA (U31463; ref. 33), the first residue being equivalent to residue 226 in the chicken skeletal muscle myosin amino acid sequence (34). Primers used for actin (positive control) were 5′-TGTGATGGTGGGAATGGGTCAG-3′ (upstream primer) and 5′-TTTGATGTCACGCACGATTTCC-3′ (downstream primer), derived for mouse β-actin (Stratagene), giving rise to a 514-bp amplification product.
Figure 3.

(A) RT-PCR demonstration that myosin IIB mRNA does not accumulate during the regime of antisense treatment. RT-PCR was performed by using RNA extracted from Neuro-2A cells after 24, 48, and 72 hours in culture, cells being untreated (lanes 1, 7, 8, 9) or treated with BQ3 (antisense, lanes 3, 10, 11, and 12) or BQ5 (sense, lanes 2, 14, and 15) oligonucleotides. Lanes 1, 2 and 3 represent actin amplicons from the 72-hour time point of control, sense-, and antisense-treated cells, respectively. Lanes 7, 8 and 9 are myosin IIB amplicons from the 24-, 48-, and 72-hour time points of control (C) cells; lanes 4 and 5 are also 72-hour amplicons from control cells but from replicate experiments, demonstrating amplicon reproducibility between experiments. Lanes 10, 11 and 12 are myosin IIB amplicons from the 24-, 48-, and 72-hour time points of antisense-treated (AS) cells. Lanes 14 and 15 are myosin IIB amplicons from the 48- and 72-hour time points of sense-treated (S) cells. Markers, 1-kilobase DNA ladders (Life Technologies), are seen in Lanes 6 and 13. Densitometry indicates that myosin IIB amplicon levels after antisense treatment are present at 50 and 29% of the control amplicon levels for the 48- and 72-hour time points, respectively. Conditions and primers used are described in Materials and Methods. (B) RT-PCR demonstration that myosin IIA mRNA remains unaffected during the regime of myosin IIB antisense treatment. RT-PCR was performed by using RNA extracted from Neuro-2A cells after 96 hours in culture, cells being untreated (Lanes 1, 5, and 9) or treated with BQ5 (sense, lanes 2, 6, and 10), BQ3 (antisense, lanes 3, 7, and 11), or BQ3R (scrambled, lanes 4, 8, and 12) oligonucleotides. Amplicons shown use primers for myosin IIA (lanes 1–4), myosin IIB (lanes 5–8), and actin (lanes 9–12). Markers, 1-kilobase DNA ladders (Life Technologies), are seen in Lane 13. Conditions and primers used are described in Materials and Methods.
Figure 4.

RT-PCR demonstration that myosin IIB expression is concurrent with neurite outgrowth whereas myosin IIA exhibits constitutive expression. Neuro-2A RNA samples were examined by RT-PCR at zero (lanes 2, 7, and 12), 24 (lanes 3, 8, and 13), 48 (lanes 4, 9, and 14), 72 (lanes 5, 10, and 15), and 96 (lanes 6, 11, and 16) hours after cell plating, generating amplicons from myosin IIA (lanes 2–6), myosin IIB (lanes 7–11), or actin (positive control, lanes 12–16) primers. Markers, 1-kilobase DNA ladders (Life Technologies), are seen in lanes 1 and 17. Conditions and primers used are described in Materials and Methods. These observations were repeated on templates derived from six different cDNA preparations. Two negative controls comprise an absence of template to test for systematic DNA contamination (lane 18) and an absence of reverse transcriptase to test for the presence of genomic DNA (lane 19). A positive control used G3PDH primers and human placental RNA (CLONTECH) and tested for the integrity of reverse transcriptase and Taq polymerase; it yielded the expected 963-bp fragment (lane 20).
RESULTS AND DISCUSSION
Sequence information for myosin IIB, available from the gene databanks, was used to design isoform-specific antisense and sense (control) oligodeoxyribonucleotides (Table 1). These were synthesized either to correspond (in the case of sense oligos), or be complementary (in the case of antisense oligos), to regions that were either within the 5′ noncoding portion of the transcript immediately adjacent to the ATG translation start site or within the isoform-specific coding sequence, also located toward the 5′ end of the transcript.
Table 1.
List of oligonucleotides used in the treatment of cells in this study
| Oligo | Isoform | Sequence | Direction and location | Species | Accession no. |
|---|---|---|---|---|---|
| B5 | MHCIIB | 5′-ttggatcgttccatttac-3′ | Sense, 5′-noncoding | Human | U34304 |
| B3 | MHCIIB | 5′-gtaaatggaacgatccaa-3′ | Antisense, 5′-noncoding | Human | U34304 |
| BQ5 | MHCIIB | 5′-gcagatccaattctggaatca-3′ | Sense, 5′-coding | Rat | U15766 |
| BQ3 | MHCIIB | 5′-tgattccagaattggatctgc-3′ | Antisense, 5′-coding | Rat | U15766 |
| B3R | * | 5′-tcggaagacgcaattaaa-3′ | B3 scrambled | * | * |
| BQ3R | * | 5′-ggctacgatgacagctatttt-3′ | BQ3 scrambled | * | * |
Shown are the oligonucleotide code name, myosin isoform, oligonucleotide sequence, direction and location of the sequence, the species from which the sequence was derived, and the database accession number. The location of the 5′ ends of the sense sequences, with respect to either the ATG start site or the chicken skeletal muscle myosin amino acid sequence used as a reference (34), are as follows: B5, −19 before ATG (U34304, ref. 30) whereas B3 is the complement of B5; BQ5, codes for ADPILES (U15766, ref. 28), the first residue being equivalent to residue 225 in the chicken myosin amino acid sequence whereas BQ3 is the complement of BQ5. Asterisks signify that the scrambled antisense control does not correspond to any known sequence in the databanks.
Anti-myosin II immunofluorescence was attenuated significantly in cells treated for 96 hours with antisense oligonucleotides directed against myosin IIB sequence (Fig. 1h) whereas fluorescence remained unaffected in untreated cells (Fig. 1e). Fluorescence also was unaffected in cells treated identically with sense oligonucleotides derived from the same region (Fig. 1g) and in cells treated with scrambled oligonucleotides (Fig. 1f). These data demonstrate that the antisense oligonucleotide was acting in the expected manner, diminishing expression of the specific myosin isoform encoded by sequence complementary to the antisense oligonucleotide. It may be noted that the commercial antibody used (Biogenesis) is able to recognize both the A and B isoforms of nonmuscle myosin II (6, 9); therefore, incomplete attenuation of fluorescence signal after antisense treatment was anticipated. This was not problematic in practice because diminution of target protein expression was observed (Fig. 1h), and, in any case, total ablation of expression is not necessarily expected from the application of antisense methodologies (35).
Figure 1.
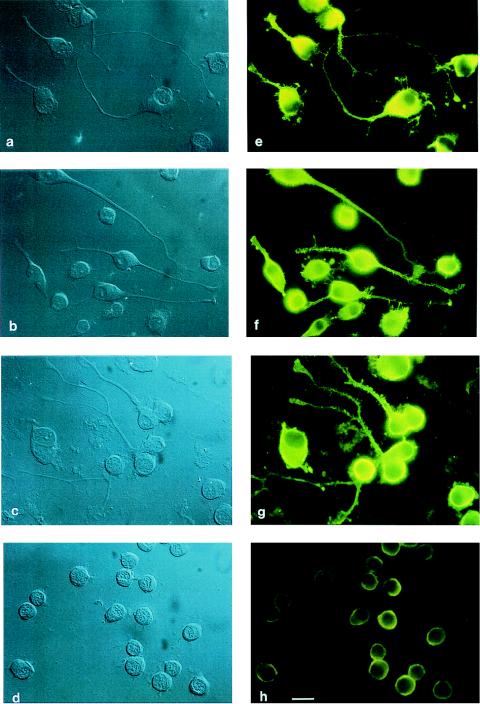
The effect of antisense or control oligonucleotides, derived from myosin IIB sequence, on the phenotype of cultured mouse Neuro-2A cells. Cells shown were observed at 96 hours by both DIC (a–d) and indirect immunofluorescence (e–h) microscopy and were either untreated (a and e) or treated with scrambled (b and f), sense (c and g), or antisense (d and h) oligonucleotides. Antibodies used were rabbit anti-nonmuscle myosin II and fluorescein-conjugated goat anti-rabbit IgG. Note that small processes still remain after antisense treatment, this being seen most easily in the DIC images (d). (Bar = 20 μm.)
When Neuro-2A cells were treated with antisense oligonucleotides specific to the myosin IIB isoform, both qualitative (Fig. 1) and quantitative (Fig. 2 a and b) observations showed that neuritic outgrowth was diminished significantly after 48 hours until cessation of antisense treatment at 96 hours. Although this was true irrespective of the total number of neurites per cell (Fig. 2b), the results were most pronounced when bipolar Neuro-2A cells were considered as a distinct subpopulation (Fig. 2a). By contrast, cells that either remained untreated, or had been treated with sense or scrambled oligonucleotides for the full 96-hour period, remained unaffected and continued to extend at normal rates (Fig. 2 a and b).
Measurement of images from an average of 312 cells at every time point in each of the four separate treatments showed no significant difference in the number of neurites arising from each cell after antisense oligonucleotide treatment as compared with sense and scrambled oligonucleotide treatment or with untreated controls (Fig. 2c). However, a significant time-dependent, treatment-independent increase in the number of bipolar, as compared with unipolar, cells was observed at later times of incubation (Fig. 2c, compare columns B, C, D, and E with columns F, G, H, and I). Taken together with the data shown in Fig. 1 and Fig. 2 a and b, these results indicate that the myosin IIB antisense oligonucleotide affects neurite extension directly but cannot be the sole determinant of neurite number, which must involve the participation of additional factors.
To explore the reversibility of the antisense effect, neurite extension was followed for at least an additional 72 hours after removal of oligonucleotide through replacement of culture medium (Fig. 2b). These results are a continuation of the experiment involving the cells seen in Fig. 2a, with an average of 198 cells being quantified at every time point with respect to each treatment. After removal of antisense oligonucleotide at 96 hours, neurite outgrowth rebounded, reaching lengths comparable to control, sense, and scrambled oligonucleotide-treated cells within the next 24 hours (Fig. 2b). These results demonstrate that the attenuation of neurite outgrowth, through treatment with antisense oligonucleotides corresponding to myosin IIB, is rapidly reversible.
One possible explanation for the unexpectedly high rate of rebound would be the accumulation of myosin IIB mRNA throughout the duration of the antisense regime. To test this, we used RT-PCR to evaluate the pool of myosin IIB mRNA resulting from each of the oligonucleotide treatments. Our results demonstrate that myosin IIB mRNA did not accumulate during the antisense regime; indeed, there was a time-dependent decrease in the amount of amplicon as a consequence of antisense treatment (Fig. 3A, lanes 10–12). By contrast, the amplicons generated from cellular mRNA derived from untreated cells (Fig. 3A, lanes 4, 5, and 7–9) or cells that had undergone sense oligonucleotide treatment (Fig. 3A, lanes 14 and 15) were substantially unchanged. These results do not support an accumulation of myosin IIB mRNA as an explanation for the rate of rebound after antisense oligonucleotide removal (Fig. 2b). Indeed, the rate of rebound taken together with the lack of accumulation of myosin IIB mRNA would suggest that, during the normal growth of these cells in culture, the availability of myosin cannot be rate-limiting with regards neuritic outgrowth. This would indicate that the supply of another factor or factors was normally rate-limiting and had continued to accumulate during the period of antisense treatment facilitating an increased rate of neurite outgrowth on renewed expression of myosin immediately after removal of the antisense block. Myosin IIA mRNA levels remained unchanged throughout myosin IIB antisense, sense, and scrambled regimes [Fig. 3B, compare lanes 2–4 (myosin IIA amplicons) with lanes 6–8 (myosin IIB amplicons)].
To test whether the myosin IIB isoform is expressed at all times or is only coincident with neurite outgrowth, RT-PCR was performed on samples obtained from cells at the time of plating and at 24-hour intervals thereafter. A direct comparison was made with myosin IIA expression (Fig. 4). These RT-PCR results demonstrate that myosin IIB is predominantly expressed during active neurite extension, expression being attenuated at the zero time point when phenotypically rounded neuroblastoma cells have not yet attached themselves to the substratum, before neurite outgrowth (Fig. 4, compare lane 7 with lanes 8–11). By contrast, the myosin IIA isoform is expressed constitutively at the zero time point and at similar levels throughout neuritic outgrowth (Fig. 4, lanes 2–6). The level of actin mRNA, as assessed by RT-PCR, did not fluctuate either throughout the experimental time-course for untreated cell cultures (Fig. 4, lanes 12–16) or as a consequence of sense or antisense oligonucleotide treatment for 72 or 96 hours (Fig. 3A, lanes 1–3; Fig. 3B, lanes 9–12).
The antisense approach used here provides results that support an involvement of myosin IIB in neurite outgrowth and growth cone motility. Mechanistically, it remains unclear how this may operate, but the peripheral location of this isoform subjacent to the plasma membrane is significant (6–9). Although it is clear that a suppression of myosin IIB message correlates with an abrogation of neurite outgrowth (Figs. 3 and 4), ruffling and the production of short protrusions remain unaffected, this being seen most clearly in the DIC images (Fig. 1d). It is possible that lamellipodial ruffling and blebbing do not require the action of myosin IIB, which instead is needed only after process formation has been initiated. Indeed, the number of neurites per cell remains unaffected by the antisense treatment (Fig. 2C).
It has been reported that the depletion of casein kinase II by antisense oligonucleotide application also prevents neuritogenesis in neuroblastoma cells (36). Although the latter results were discussed in terms of a possible role for casein kinase II in MAP1B phosphorylation (36), it may be noted that the myosin IIB heavy chain also possesses a recognition site for casein kinase II phosphorylation (37). Both the antisense knockout of myosin IIB function reported here and the casein kinase II antisense knockout results demonstrate attenuation of filopodial extension, giving rise to the possibility that casein kinase II is the normal regulator of myosin IIB activity. Surprisingly, the most obvious feature of myosin IIB knockout mice was found to be impaired cardiac development leading to death on or before the day of birth (38). However, other abnormalities were noted, including hydrocephalus and retinal dysplasia (38), suggesting that the normal development of the brain also was affected adversely.
In addition to a role in neurite outgrowth, myosin IIB also, in principle, could be required for neurite retraction and focal contact formation to facilitate adhesion to the substratum, either separately or in combination. In this regard, it may be noted that lysophosphatidate (23, 24, 39) and thrombin (23, 40, 41) are able to induce neurite retraction in neuronally derived cells and focal adhesion in fibroblasts, functions that are thought to be brought about through activation of actomyosin-based contractility. Such observations correlate with an increase in myosin light chain phosphorylation (23, 24). A similar correlation has been observed with regard to apoptotic membrane blebbing (42). In serum-starved neuroblastoma cells Clostridium botulinum C3 exoenzyme treatment inactivates RhoA by ADP ribosylation and thereby inhibits lysophosphatidate- and thrombin-induced neurite retraction (23). By contrast, in serum-fed cells, neurite outgrowth ensues after prolonged C3 treatment or through induction by inhibitors of myosin light chain phosphorylation (23). It would appear, therefore, that the involvement of myosin IIB in neurite outgrowth is a distinctive mechanism, separable from myosin involvement in neurite retraction, focal adhesion, and membrane blebbing. Furthermore, it would appear that these separate mechanisms may be controlled in different ways, neurite retraction and blebbing being regulated through regulatory light chain phosphorylation and neurite outgrowth being independent of light chain phosphorylation but possibly regulated through heavy chain phosphorylation, as noted above.
From the above, it would appear likely that individual myosin isoforms perform specific tasks during the complex mix of propulsion and retraction, adhesion and repulsion, which constitutes growth cone motility during axonal pathfinding. In this regard, our results indicate that freshly plated neuroblastoma cells displaying rounded forms only minimally express myosin IIB while exhibiting constitutive expression of myosin IIA (Fig. 4, compare lanes 2 and 7). Only during neurite outgrowth is the myosin IIB transcript expressed in significant amounts (Fig. 4, lanes 8–11). Because myosin IIA is the predominant isoform expressed at zero time, one attractive interpretation of the division of labor between isoforms is that the cortical tension described (23, 24) in rounded cells, before induction of spreading, is a function of myosin IIA whereas the role of myosin IIB relates to filopodial outgrowth. However, the results presented here are not exclusive, and it is likely that myosin IIB will act in concert with other molecular motors to bring about neuritogenesis. Curiously, although myosin V has been shown to play a role in filopodial extension (13), impaired myosin I activity does not appear to have an obvious effect on growth cone motility (13) despite its localization at the leading edge of the growth cone (4–6). It is possible that any role played by myosin I in neuritogenesis is downstream or secondary to myosin IIB action; a possible synergy of operation between these different myosin family members is currently under investigation.
Acknowledgments
Supported by a grant from the Wellcome Trust to P.D.C.
ABBREVIATIONS
- DIC
differential interference contrast
- RT
reverse transcriptase
Footnotes
This paper was submitted directly (Track II) to the Proceedings Office.
References
- 1. Letourneau P C, Kater S B, Macagno E R, editors. The Nerve Growth Cone. New York: Raven; 1991. [Google Scholar]
- 2.Puszkin S, Berl S, Puszkin E, Clarke D. Science. 1968;161:170–171. doi: 10.1126/science.161.3837.170. [DOI] [PubMed] [Google Scholar]
- 3.Puszkin S, Nicklas W J, Berl S. J Neurochem. 1972;19:1319–1333. doi: 10.1111/j.1471-4159.1972.tb01457.x. [DOI] [PubMed] [Google Scholar]
- 4.Wagner M C, Barylko B, Albanesi J P. J Cell Biol. 1992;119:163–170. doi: 10.1083/jcb.119.1.163. [DOI] [PMC free article] [PubMed] [Google Scholar]
- 5.Lewis A K, Bridgman P C. Cell Motil Cytoskeleton. 1996;33:130–150. doi: 10.1002/(SICI)1097-0169(1996)33:2<130::AID-CM5>3.0.CO;2-G. [DOI] [PubMed] [Google Scholar]
- 6.Miller M, Bower E, Levitt P, Li D, Chantler P D. Neuron. 1992;8:25–44. doi: 10.1016/0896-6273(92)90106-n. [DOI] [PubMed] [Google Scholar]
- 7.Cheng T P O, Murakami N, Elzinga M. FEBS Lett. 1992;311:91–94. doi: 10.1016/0014-5793(92)81374-u. [DOI] [PubMed] [Google Scholar]
- 8.Li D, Miller M, Chantler P D. Proc Natl Acad Sci USA. 1994;91:853–857. doi: 10.1073/pnas.91.3.853. [DOI] [PMC free article] [PubMed] [Google Scholar]
- 9.Rochlin W, Itoh K, Adelstein R S, Bridgman P C. J Cell Sci. 1995;108:3661–3670. doi: 10.1242/jcs.108.12.3661. [DOI] [PubMed] [Google Scholar]
- 10.Lin C H, Espreafico E M, Mooseker M S, Forscher P. Neuron. 1996;16:769–782. doi: 10.1016/s0896-6273(00)80097-5. [DOI] [PubMed] [Google Scholar]
- 11.Ruchhoeft M L, Harris W A. J Neurobiol. 1997;32:567–578. [PubMed] [Google Scholar]
- 12.Espreafico E M, Cheney R E, Matteoli M, Nascimento A A C, De Camilli P V, Larson R E, Mooseker M S. J Cell Biol. 1992;119:1541–1557. doi: 10.1083/jcb.119.6.1541. [DOI] [PMC free article] [PubMed] [Google Scholar]
- 13.Wang F-S, Wolenski J S, Cheney R E, Mooseker M S, Jay D G. Science. 1996;273:660–663. doi: 10.1126/science.273.5275.660. [DOI] [PubMed] [Google Scholar]
- 14.Titus M A, Wessels D, Spudich J A, Soll D. Mol Biol Cell. 1993;4:233–246. doi: 10.1091/mbc.4.2.233. [DOI] [PMC free article] [PubMed] [Google Scholar]
- 15.Fukui Y, Lynch T J, Brzeska H, Korn E D. Nature (London) 1989;341:328–331. doi: 10.1038/341328a0. [DOI] [PubMed] [Google Scholar]
- 16.Moores S L, Sabry J H, Spudich J A. Proc Natl Acad Sci USA. 1996;93:443–446. doi: 10.1073/pnas.93.1.443. [DOI] [PMC free article] [PubMed] [Google Scholar]
- 17.De Lozanne A, Spudich J A. Science. 1987;236:1086–1091. doi: 10.1126/science.3576222. [DOI] [PubMed] [Google Scholar]
- 18.Knecht D A, Loomis W F. Science. 1987;236:1081–1086. doi: 10.1126/science.3576221. [DOI] [PubMed] [Google Scholar]
- 19.Cramer L P, Mitchison T J. J Cell Biol. 1995;131:179–189. doi: 10.1083/jcb.131.1.179. [DOI] [PMC free article] [PubMed] [Google Scholar]
- 20.Sellin L C, McArdle J J. Pharmacol Toxicol. 1994;74:305–313. doi: 10.1111/j.1600-0773.1994.tb01365.x. [DOI] [PubMed] [Google Scholar]
- 21.Gwathmey J K, Hajjar R J, Solaro R J. Circ Res. 1991;69:1280–1292. doi: 10.1161/01.res.69.5.1280. [DOI] [PubMed] [Google Scholar]
- 22.Huang G J, McArdle J J. J Physiol. 1992;447:257–274. doi: 10.1113/jphysiol.1992.sp019001. [DOI] [PMC free article] [PubMed] [Google Scholar]
- 23.Jalink K, van Corven E J, Hengeveld T, Moril N, Narumiya S, Moolenaar W H. J Cell Biol. 1994;126:801–810. doi: 10.1083/jcb.126.3.801. [DOI] [PMC free article] [PubMed] [Google Scholar]
- 24.Chrzanowska-Wodnicka M, Burridge K. J Cell Biol. 1996;133:1403–1415. doi: 10.1083/jcb.133.6.1403. [DOI] [PMC free article] [PubMed] [Google Scholar]
- 25.Katsuragawa Y, Yanagisawa Y, Inoue A, Masaki T. Eur J Biochem. 1989;184:611–616. doi: 10.1111/j.1432-1033.1989.tb15057.x. [DOI] [PubMed] [Google Scholar]
- 26.Kawamoto S, Adelstein R S. J Cell Biol. 1991;112:915–924. doi: 10.1083/jcb.112.5.915. [DOI] [PMC free article] [PubMed] [Google Scholar]
- 27.Simons M, Wang M, McBride O, Kawamoto S, Gdula D, Adelstein R S, Weir L. Circ Res. 1991;69:530–539. doi: 10.1161/01.res.69.2.530. [DOI] [PubMed] [Google Scholar]
- 28.Itoh K, Adelstein R S. J Biol Chem. 1995;270:14533–14540. doi: 10.1074/jbc.270.24.14533. [DOI] [PubMed] [Google Scholar]
- 29.Ferreira A, Niclas J, Vale R D, Banker G, Kosik K S. J Cell Biol. 1992;117:595–606. doi: 10.1083/jcb.117.3.595. [DOI] [PMC free article] [PubMed] [Google Scholar]
- 30.Weir L, Chen D. Gene Expr. 1996;6:45–57. [PMC free article] [PubMed] [Google Scholar]
- 31.Chomczynski P, Sacchi N. Anal Biochem. 1987;162:156–159. doi: 10.1006/abio.1987.9999. [DOI] [PubMed] [Google Scholar]
- 32.Kawasaki E S. In: PCR Protocols: A Guide to Methods and Applications. Innis M A, Gelfand D H, Sninsky J J, White T J, editors. New York: Academic; 1990. pp. 21–27. [Google Scholar]
- 33.Choi O H, Park C-S, Itoh K, Adelstein R S, Beaven M A. J Muscle Res Cell Motil. 1996;17:69–77. doi: 10.1007/BF00140325. [DOI] [PubMed] [Google Scholar]
- 34.Sellers J R, Goodson H V. In: Protein Profiles. Sheterline P, editor. New York: Academic; 1995. pp. 1323–1423. [PubMed] [Google Scholar]
- 35.Qin Z-H, Shou L-W, Zhang S-P, Wang Y, Weiss B. Mol Pharmacol. 1995;86:2161–2167. [PubMed] [Google Scholar]
- 36.Ulloa L, Diaz-Nido J, Avila J. EMBO J. 1993;12:1633–1640. doi: 10.1002/j.1460-2075.1993.tb05808.x. [DOI] [PMC free article] [PubMed] [Google Scholar]
- 37.Murakami N, Healy-Louie G, Elzinga M. J Biol Chem. 1990;265:1041–1047. [PubMed] [Google Scholar]
- 38.Tullio A N, Accili D, Ferrans V J, Yu Z, Takeda K, Grinberg A, Westphal H, Preston Y A, Adelstein R S. Proc Natl Acad Sci USA. 1997;94:12407–12412. doi: 10.1073/pnas.94.23.12407. [DOI] [PMC free article] [PubMed] [Google Scholar]
- 39.Tigyi G, Miledi R. J Biol Chem. 1992;267:21360–21367. [PubMed] [Google Scholar]
- 40.Jalink K, Moolenaar W H. J Cell Biol. 1992;118:411–419. doi: 10.1083/jcb.118.2.411. [DOI] [PMC free article] [PubMed] [Google Scholar]
- 41.Suidan H S, Stone S R, Hemmings B A, Monard D. Neuron. 1992;8:363–375. doi: 10.1016/0896-6273(92)90302-t. [DOI] [PubMed] [Google Scholar]
- 42.Mills J C, Stone N L, Erhardt J, Pittman R N. J Cell Biol. 1998;140:627–636. doi: 10.1083/jcb.140.3.627. [DOI] [PMC free article] [PubMed] [Google Scholar]