

Abstract
The variations of breast cancer mortality rates from place to place reflect both underlying differences in breast cancer prevalence and differences in diagnosis and treatment that affect the risk of death. This article examines the role of access to health care in explaining the variation of late-stage diagnosis of breast cancer. We use cancer registry data for the state of Illinois by zip code to investigate spatial variation in late diagnosis. Geographic information systems and spatial analysis methods are used to create detailed measures of spatial access to health care such as convenience of visiting primary care physicians and travel time from the nearest mammography facility. The effects of spatial access, in combination with the influences of socioeconomic factors, on late-stage breast cancer diagnosis are assessed using statistical methods. The results suggest that for breast cancer, poor geographical access to primary health care significantly increases the risk of late diagnosis for persons living outside the city of Chicago. Disadvantaged population groups including those with low income and racial and ethnic minorities tend to experience high rates of late diagnosis. In Illinois, poor spatial access to primary health care is more strongly associated with late diagnosis than is spatial access to mammography. This suggests the importance of primary care physicians as gatekeepers in early breast cancer detection.
Keywords: breast cancer, late-stage cancer, mammography, poisson regression model, primary care access
For many types of cancer, including breast cancer, stage at diagnosis is a critically important determinant of health outcomes. Evidence shows that the risks of mortality and health complications for breast cancer patients are strongly related to stage of diagnosis. Patients whose cancer is diagnosed early have fewer complications and substantially higher rates of survival than those whose cancer is diagnosed late. For breast cancer, health care access, especially access to primary care and mammography screening services, is critically important for early detection. Access is strongly influenced by financial, sociocultural, and geographic barriers, yet the relative importance of these barriers in affecting the risk of late-stage breast cancer is poorly understood. In this article, we examine the role of spatial access to health care in comparison to nonspatial factors such as socioeconomic and demographic characteristics. We use cancer registry data for the state of Illinois by zip code to investigate spatial variation in late diagnosis. Geographic information systems (GIS) and spatial analysis methods are used to create detailed measures of spatial access to health care, and the effects of spatial access and socioeconomic disadvantage on late-stage disease are assessed using statistical methods. The results suggest that poor geographical access to primary health care significantly influences the risk of late diagnosis.
Recognizing the importance of stage at diagnosis, a growing body of research examines social and geographical inequalities in late-stage breast cancer. Studies consistently show that disadvantaged populations, including low-income groups and racial and ethnic minorities, are more likely to be diagnosed with late-stage breast cancer (Eley et al. 1994; Bradley, Given and Roberts 2001; Spitler, Mayo, and Parker 2001). Socioeconomic gradients in risk exist at both the individual and neighborhood levels. At the individual level, studies consistently show that Medicaid coverage, an indicator of low individual or household income, is associated with a higher risk of late-stage breast cancer (Roetzheim et al. 1999; Bradley, Given and Roberts 2001). Similarly, women with low levels of education have higher risks (Bennett et al. 1998). African American and Latino women are more likely to be diagnosed with late-stage disease; however these race and ethnic disparities are largely due to socioeconomic differences and differences in access to health care (Cross, Harris, and Recht 2002). Personal characteristics, including obesity and cultural beliefs, also come into play (Lannin et al. 1998; Cui et al. 2002).
Research suggests that these socioeconomic disparities in late-stage breast cancer are tied not only to individual characteristics but also to differences in neighborhood context. Neighborhood social class is an important predictor of breast cancer stage (Mandelblatt et al. 1991). Barry and Breen (2005) found that women living in distressed, low-income neighborhoods in three U.S. cities had a higher likelihood of late-stage diagnosis than did women living in more affluent neighborhoods. Similar findings were reported by Schwartz et al. (2003) and Bradley, Given and Roberts (2002), who demonstrated that living in a high-poverty neighborhood posed an additional risk above and beyond that due to individual characteristics like Medicaid coverage. Thus, in urban areas, neighborhood context is a strong predictor of late-stage breast cancer diagnosis.
The risk of late-stage breast cancer also varies geographically at the urban and regional levels. In cities, clusters of late-stage disease often conform to clusters of high-risk population. Higher rates of invasive breast cancer have been found in areas where population income and education levels are low (Merkin, Stevenson, and Rowe 2002). On the regional scale, there are persistent rural–urban inequalities in risk. Rates of late-stage breast cancer in rural areas exceed those in urban areas (Liff, Chow, and Greenberg 1991), and disadvantaged populations in rural areas are particularly vulnerable. Extraordinarily high rates of late-stage breast cancer have been noted among some rural minority women—a pattern of “double jeopardy” based on race and residence (Amey, Miller, and Albrecht 1997). Regional scale studies have also used spatial clustering methods to identify localized clusters of late-stage breast cancer. The results of these analyses vary strongly from one research context to another. In Minnesota, Thomas and Carlin (2003) found no statistically significant spatial clusters of late-stage breast cancer, whereas studies in Massachusetts (Sheehan and DeChello 2005), New York (Jacquez and Greiling 2003), New Jersey (Roche, Skinner, and Weinstein 2002), and at the U.S. national level (Schootman and Sun 2004) show spatial or space–time clustering. As in urban areas, these regional clusters in part reflect the underlying spatial distribution of high-risk, disadvantaged populations (Roche, Skinner, and Weinstein 2002; Sheehan and DeChello 2005), although the relative contributions of population and other factors have not been systematically assessed. A recent study by Lin and Zhang (2007) demonstrated spatial clustering of late-stage breast cancer in Kentucky after controlling for socioeconomic factors and health service availability.
The causes of these socioeconomic and geographical disparities in late-stage breast cancer are complex. Among others, lack of access to health care, including both mammography screening and primary health care in general, strongly influences the likelihood of early cancer detection (Mullins, 1999; Jacobellis and Cutter 2002). The benefits of regular mammography and other types of screening are well established (Oluwole et al. 2003), yet some women in the United States do not have access to regular and effective screening. Mammography utilization follows the same socioeconomic gradients as does late-stage disease. Low-income and uninsured women are less likely than other women to receive age-appropriate mammography and other breast cancer screens (Adams et al. 2003; Barrett and Legg 2005). Cultural and linguistic isolation, for example, foreign birthplace, is also a significant barrier to cancer screening, even after other factors are controlled (Goel et al. 2003). In addition, research indicates that travel distance and lack of transportation are important predictors of mammography utilization and early detection (Lannin et al. 1998; Engelmann et al. 2002). Lack of access to early detection methods in rural areas might explain higher rates of advanced cancer diagnosis in rural than in urban patients (Liff, Chow, and Greenberg 1991).
Access to health care varies across space because of the uneven geographical distributions of health care providers and consumers (spatial factors), and it also varies among population groups because of their different socioeconomic and demographic characteristics (nonspatial factors; Meade and Earickson 2000, 383–92). Spatial access emphasizes the importance of geographical barriers (travel distance or time) between consumer and provider, whereas nonspatial access stresses nongeographic barriers or facilitators such as social class, income, insurance coverage, race or ethnicity, culture, age, and gender (Joseph and Phillips 1984; Wang and Luo 2005). A spatial accessibility measure needs to account for complex interaction between health care supply and demand locations and the distance and ease of travel between them (Luo and Wang 2003; McLafferty 2003). Nonspatial factors are many and are often correlated with each other, and integrating them requires the usage of analytical statistical methods (Wang and Luo 2005). These spatial and nonspatial factors are often interdependent; for example, income (nonspatial) affects transportation access, which in turn affects spatial access to health care. These factors, and the interactions among them, vary in importance in different geographical settings.
No prior research has examined systematically the effects of spatial access to health care along with various nonspatial factors in influencing geographic patterns of late-stage breast cancer. Recent studies have analyzed spatial clustering of late-stage cancer, but they do not determine whether spatial clusters are related to a lack of spatial access to health care (Sheehan and DeChello 2005). Thomas and Carlin (2003), for example, assessed spatial clustering of late-stage breast and colorectal cancer in Minnesota counties and explored the associations with mammography and colonoscopy utilization; however, they did not extend the analysis to examine mammography and colonoscopy service locations. Marchick and Henson (2005) found a positive association between the number of mammography facilities per thousand population by county and the incidence rate of in situ breast cancer; however counties might be too large and heterogeneous to detect meaningful associations. Zenk, Tarlov, and Sun (2006) investigated spatial equity of mammography facilities in Chicago, but did not examine the links with late diagnosis. This research uses newly developed GIS methods to measure spatial accessibility to primary care and mammography, and also integrates nonspatial factors. The results are then used to analyze the association between health care access and stage of breast cancer diagnosis for the state of Illinois by zip code.
Data Sources and Issues
This research uses cancer incidence data for Illinois from the Illinois State Cancer Registry (ISCR), Illinois Department of Public Health (IDPH) for 1998 to 2000. The data set includes cases among Illinois residents that were diagnosed in neighboring states such as Missouri and Wisconsin, and the completeness of case ascertainment is estimated at 98 percent (Lehnerr and Havener 2002). The data set prepared by the ISCR for our study contains individual records of cancer incidence in Illinois from 1998 to 2000. Each cancer case is geocoded to the county and zip code of residence. The data file includes variables such as cancer type, age group, sex, race, diagnosis stage, and year. The zip-code-level cancer data used in this study were obtained from the ISCR after a rigorous data request review process, and the data include variables (e.g., race, diagnosis stage, and year) not released in publicly accessible data sets.
In the study period, there were 31,914 incidences of breast cancer in Illinois. Consistent with other studies, we defined late-stage as diagnosis in stages 2 through 7 (Bradley, Given, and Roberts 2002). The late-stage group consists of cancers that have spread beyond the site of origin to nearby or distant tissues, organs, or lymph nodes. Excluding 1,403 cases with no stage information, there were 30,511 cases, among which 9,077 (29.7 percent) were classified as late stage.
Table 1 presents some basic statistics for late-stage breast cancer in Illinois by race and rural–urban location. The percentage of late-stage breast cancer cases is classified by race based on information in the ISCR database. Late-stage risk is tabulated by rural–urban location using the rural–urban classification scheme for zip code areas based on rural to urban commuting flows (Hart 2006). Wide racial disparities in late-stage diagnosis are evident in Table 1: the risk of late diagnosis is substantially higher for black women (39.7 percent) as compared with white (28.4 percent) and Asian women (29.6 percent). There are also rural–urban inequalities in late-stage breast cancer. The late-stage percentage is highest among persons living in Chicago, but rates are also elevated among those living in small rural and isolated rural zip codes.
Table 1. Racial and geographic disparities in late-stage breast cancer.
| Total cases | Late-stage cases | % late | |
|---|---|---|---|
| Race | |||
| White | 25,985 | 7,438 | 28.6 |
| Black | 3,395 | 1,349 | 39.7 |
| Asian | 507 | 150 | 29.6 |
| Urban–rural | |||
| Chicago City | 5,571 | 1,890 | 33.9 |
| Other Urban | 17,986 | 5,134 | 28.5 |
| Suburban | 2,213 | 646 | 29.2 |
| Large town | 1,965 | 544 | 27.7 |
| Small town and isolated rural | 2,776 | 863 | 31.1 |
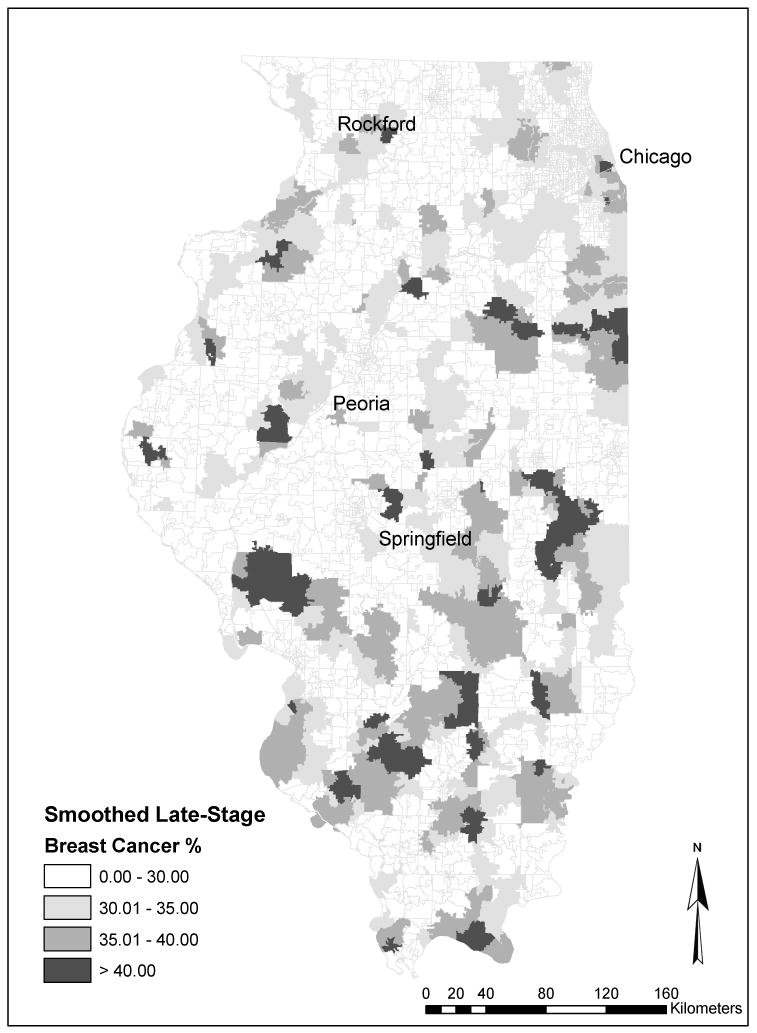
To show detailed spatial patterns of late-stage disease, we created a spatially smoothed map of late-stage breast cancer risk (Figure 1). Spatially smoothed rates were computed in an effort to address the small numbers problem—the fact that in many rural and exurban zip codes, the number of breast cancer cases is too small to compute a reliable estimate of the late-stage diagnosis rate. Spatial smoothing incorporates data for neighboring zip codes to create a smoothed estimate of the local risk of late-stage disease. In this case, the smoothing window is defined as the six nearest neighbor zip codes. This particular smoothing window was large enough to ensure reasonable numbers of cases for most zip code areas and small enough to show detailed spatial variation. Smoothed rates were computed in GeoDa (Spatial Analysis Laboratory, University of Illinois 2006) using the spatial empirical Bayes option, which includes a statistical adjustment for small numbers of cases (Anselin, Syabri, and Koh 2006). The map reveals distinct spatial clusters of high late-stage risk. Clusters are evident on the south side of Chicago and extending south into neighboring suburbs. Distinct clusters are also apparent in the more remote regions of central and southern Illinois. The presence of these rural clusters might be associated with poor spatial access to health care, a problem found in many rural regions.
Figure 1. Spatially smoothed late-stage breast cancer rates in Illinois, 1998–2000.
In analyzing spatial access to health care, we consider two types of health care services: primary care physicians and mammography facilities. Primary care physicians are important because they typically provide the first point of contact with the health care system. These physicians are critical for the success of preventive care and cancer screening (Lee 1995). Spatial access to primary care physicians is an indicator of general spatial access to health services. In defining primary care physicians, we included family physicians, general practitioners, general internists, and obstetrician-gynecologists (Cooper 1994). The primary care physician data for Illinois in 2000 were extracted from the Physician Master File of the American Medical Association (AMA). Limited by the geographic accuracy in the AMA data set (e.g., a significant number of records in the Physician Master File only have P.O. box addresses, not feasible for geocoding to street addresses), a physician's location is represented by the zip code of the physician's office address. Therefore, we have the number of primary care physicians, measured in terms of fulltime equivalent (FTE) physicians, in each zip code area.
To accurately assess spatial access, we also analyze the locations of mammography screening services. Mammography is typically performed in hospitals or some specialized health care facilities, rather than in doctors' offices. Location data for mammography facilities were obtained from the U.S. Food and Drug Administration, which is responsible for certifying mammography facilities (http://www.fda.gov/cdrh/mammography/certified.html). The 386 current certified mammography facilities in Illinois were used to approximate the mammography service providers in 2000. These facilities were geocoded to point locations by GIS address matching techniques.
In addition to the supply of health services, the spatial access measure considers the demand for services as measured by population in various locations. Population data were obtained from the 2000 U.S. Census at the census tract level. The 2000 Census is also the major data source for defining nonspatial factors such as socioeconomic and demographic variables at the aggregate level.
One important issue surrounding cancer studies is the geographical unit of analysis. In this research, zip code areas are used to represent locations of primary care physicians (in assessing spatial accessibility) and also cancer occurrences (in measuring the risk of late-stage cancer diagnosis). Our choice of using zip code areas is dictated by data availability. Cancer data are not available for areas smaller than zip codes because of privacy and confidentiality restrictions. We are aware of the problems associated with using zip code data (Kirby 1996; Grubesic 2006). Zip code boundaries are imprecise and can change over time, and zip codes do not conform well to social or neighborhood areas. Despite these limitations, zip codes represent a reasonably fine spatial resolution and have been used extensively in health research (e.g., Ng, Wilkins, and Perras 1993; Parker and Campbell 1998; Knapp and Hardwick 2000). Whenever points are needed to represent areal units such as zip code areas and census tracts (e.g., in distance and travel time estimations), we use population-weighted centroids (based on block-level population data) instead of simple geographic centroids to represent population locations more accurately (Luo and Wang 2003).
Measuring Health Care Access
As introduced earlier, health care access affecting late-stage breast cancer diagnosis is composed of three measures: (1) distance or travel time from mammography facilities, (2) spatial access to primary care physicians, and (3) nonspatial factors accounting for socioeconomic and demographic variables. The following discusses how each component is measured.
Measuring Distance and Time from the Nearest Mammography Facility
To measure geographical access to mammography, we determined the minimum distance or travel time to the closest facility (Brabyn and Gower 2003). This straightforward distance or travel time measure does not differentiate between mammography facilities. It assumes that mammography screening is available for all residents and that there is no difference in the quality or capacity of these providers.
Among the 386 mammography service providers in Illinois, six facilities are excluded from the analysis as they have duplicate addresses. Most of these facilities are mobile, and only the street addresses of their affiliated hospitals are available. The remaining 380 sites are geocoded according to their addresses. Euclidean distance and travel time are calculated from the centroid of each zip code to each mammography facility. Travel time is estimated based on real-world road networks accounting for lower speeds in high-density urban areas (Luo and Wang 2003, 869–70). The estimation utilizes the ArcInfo network analysis module and assumes that people take the shortest route.1 Travel time is estimated from a zip code centroid (assuming that all population is concentrated there) to the nearest mammography facility. These estimates do not account for the time one spends starting the car at the beginning of the trip, finding a parking space at the end of the trip, and the time walking to the facility, all of which increase travel times. Thus, our travel time estimates are intended to capture variability in travel times, reflecting differential spatial access to mammography, rather than actual travel times. For comparison, both the Euclidean distance and travel time between a residential zip code centroid and its nearest mammography facility are computed. The two are correlated but not completely substitutable with an R2 of 0.244. In other words, distance is a weak surrogate for travel time.
Measuring Spatial Accessibility to Primary Care Physicians
Because of scarcity of health care resources, most accessibility measures need to account for both supply and demand, as it is the case for access to primary care. Measures of spatial accessibility for primary care need to account for the match between supply and demand within a region and the complex interaction between supply and demand located in different regions (Joseph and Phillips 1984). A prior study compared different methods for measuring spatial accessibility and recommended the usage of a two-step floating catchment area (2SFCA) method (Luo and Wang 2003, 879). As the name indicates, the 2SFCA method is implemented in two steps. In the first step, for each physician location j, search all population locations (k) that are within a threshold travel time (d0) from location j (i.e., catchment area j), and compute the physician to population ratio Rj within the catchment area:
| (1) |
where Pk is the population of tract k whose centroid falls within the catchment (i.e., dkj ≤ d0), Sj is the number of physicians at location j, and dkj is the travel time between k and j. In the second step, for each population location i, search all physician locations (j) that are within the threshold travel time (d0) from location i (i.e., catchment area i), and sum up the physician to population ratios Rj at these locations:
| (2) |
In a GIS environment such as ArcGIS, this method can be implemented easily by using a series of “join” and “sum” functions (Wang 2006, 85–89).
In this study, population locations are represented by census tract centroids, and physician locations are given by zip code centroids. For the reason explained earlier, both centroids are population-weighted ones based on the block-level population data. The threshold travel time (d0) between population and physician locations is defined as thirty minutes, a standard used by the U.S. Department of Health and Human Services for defining service areas (see http://bphc.hrsa.gov/dsd). The accessibility index is initially computed at the census tract level, and transformed to zip code areas by the basic areal weighting interpolator (Goodchild and Lam 1980; Wang 2006, 47). The method apportions the attribute value (i.e., accessibility index) from source zones (i.e., census tracts) to target zones (i.e., zip code areas) according to the areal proportion. For more advanced interpolation approaches, see Goodchild, Anselin, and Deichmann (1993).
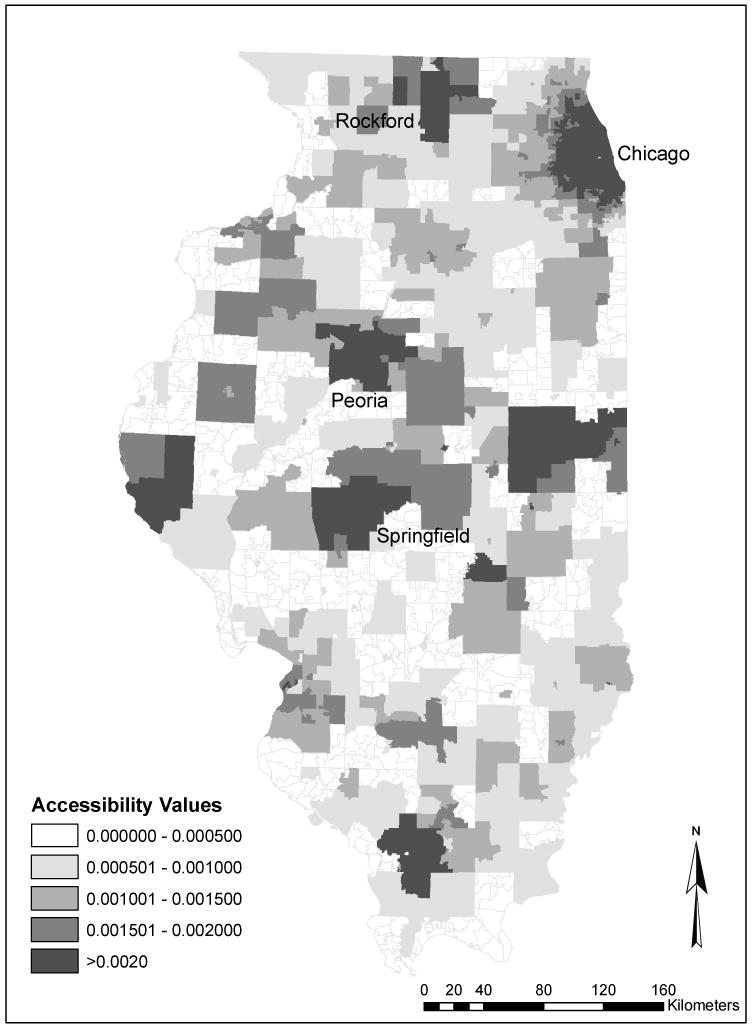
Figure 2 shows the variation of spatial accessibility to primary care across Illinois in 2000. The spatial accessibility value can be roughly interpreted as the physician-to-population ratio (e.g., a value of 0.001 represents one doctor per thousand residents), and thus a higher value corresponds to better access to primary care. Figure 2 shows that areas with higher accessibility scores (better spatial access) were concentrated in urban areas (e.g., Chicago, Rockford, Springfield, and Peoria) that have a high concentration of primary care physicians. Lower accessibility scores (poorer spatial access) were mostly observed in rural areas. The spatial measure does not reveal impoverished inner-city communities that usually suffer from poor health care access; in these communities, nonspatial barriers are more important.
Figure 2. Spatial accessibility to primary care physicians in Illinois, 2000.
Measuring Nonspatial Factors Affecting Health Care Access
Nonspatial factors such as demographic and socioeconomic characteristics also affect health care accessibility (Field 2000; Wang and Luo 2005), and likely late-stage cancer diagnosis. These socioeconomic variables are not available for individual patients in the cancer data set, therefore we rely on zip code measures based on Census data. The Census data were obtained for 2000 at the census tract level and then interpolated to zip code areas using the spatial interpolation method discussed earlier. Based on existing literature, eleven variables are considered in analyzing nonspatial access: demographic variables (i.e., population with high health care needs including seniors sixty-five and older, children of ages zero to four, and women of childbearing ages fifteen to forty-four), socioeconomic status (e.g., population in poverty, female-headed households, home ownership, and median income), environment (e.g., households with an average of more than one person per room and housing units lacking of basic amenities), linguistic barriers and education (e.g., nonwhite population,2 population without a high school diploma, and households linguistically isolated), and transportation mobility (e.g., households without vehicles).
Factor analysis (FA) is used to consolidate these variables and uncover underlying dimensions of nonspatial factors. To decide how many factors to include, principal components analysis (PCA) is conducted first. The PCA uses the same number (eleven) of variables (components) to capture the same variance contained in the original data set, but shows the relative importance of components corresponding to their eigenvalues. In this study, we retain three components (factors) with eigenvalues greater than one that capture a majority (i.e., 74.7 percent) of the total variance.3 To better interpret and label the factors, the consequent FA uses the popular varimax rotation technique to maximize each variable's loading on one factor and minimize the loadings on the other two. The rotated factor structure is shown in Table 2, where the variables are reordered with the highest loadings on a factor highlighted. The three factors are labeled socioeconomic disadvantage, sociocultural barriers, and high health care needs. Factor 1 captures six variables that are all related to socioeconomic disadvantages. Note the negative loading of homeownership percentage on factor 1 as a lower percentage of owner-occupied housing units is generally associated with a more deprived neighborhood. Factor 2 includes variables such as linguistic isolation and lower education attainment that tend to be associated with lower service awareness and thus create an important barrier to health care access. Factor 3 is labeled high health care needs because it mainly captures the variable of population with high health care needs (note that the median income variable is loaded almost equally between factors 1 and 3). A higher value of socioeconomic disadvantages (factor 1) or sociocultural barriers (factor 2) corresponds to poorer access, and a larger value of high health care needs (factor 3) score indicates higher needs.
Table 2. Factor structure of nonspatial factors.
| Socioeconomic disadvantages | Sociocultural barriers | High health care needs | |
|---|---|---|---|
| Female-headed households (%) | 0.9089 | −0.0058 | 0.0504 |
| Population in poverty (%) | 0.8662 | 0.1642 | 0.2405 |
| Nonwhite population (%) | 0.8481 | 0.2153 | −0.0153 |
| Households without vehicles (%) | 0.8231 | 0.1905 | 0.2699 |
| Homeownership (%) | −0.6686 | −0.3362 | −0.3922 |
| Housing units lacking basic amenities (%) | 0.4278 | 0.2703 | −0.0323 |
| Households with linguistic isolation (%) | −0.0479 | 0.9561 | 0.0164 |
| Households with > 1 person per room (%) | 0.4464 | 0.7966 | −0.0631 |
| Population without high school diploma (%) | 0.5800 | 0.6406 | 0.1219 |
| Population with high needs (%) | 0.0316 | −0.1050 | 0.9186 |
| Median income ($) | −0.5491 | −0.2053 | −0.5605 |
| % of variance explained by each factor | 54.08 | 28.09 | 17.83 |
Values in italics indicate the highest loading of a variable on a factor among all factors.
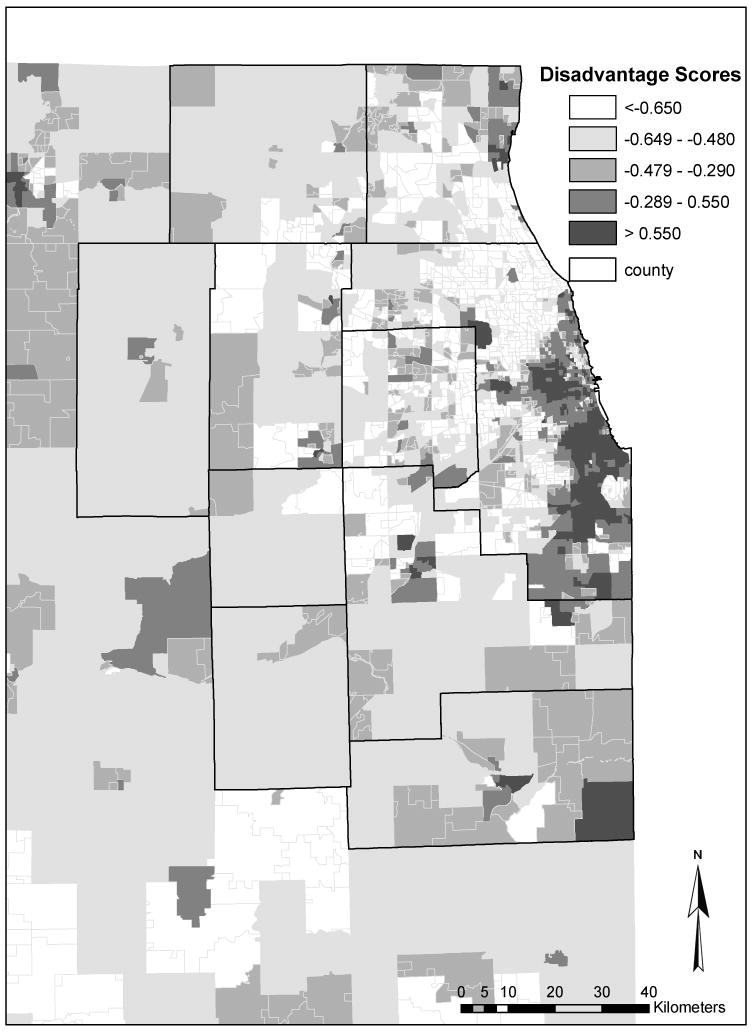
As an example, Figure 3 shows how the socioeconomic disadvantage (factor 1) scores vary across the Chicago region. Factor scores are standardized values with a mean of zero and standard deviation of one. In contrast to Figure 2, it shows that areas with high scores (high socioeconomic disadvantage) are concentrated in the urban centers, whereas areas with low scores (low socioeconomic disadvantage) are mostly in suburban and rural regions.
Figure 3. Socioeconomic disadvantage scores in Chicago region in 2000.
To analyze the association between late-stage breast cancer risk and access to health care, we use poisson regression, a method that is widely used in modeling count data (Cameron and Trivedi 1998). We hypothesize that for a zip code population, the risk of late-stage breast cancer is associated with nonspatial factors (socioeconomic disadvantage, sociocultural barriers, high health care needs), distance and travel time to the closest mammography facility, and spatial access to primary care. These associations are represented in a poisson rate model in which the dependent variable is the number of late-stage breast cancer cases. The total number of breast cancer cases serves as an offset variable (coefficient constrained to equal one) to account for differences in cancer incidence that reflect underlying differences in population and disease risk. Thus, this is an inhomogeneous poisson model in which the total number of breast cancer cases by zip code constrains the number of late-stage cases.
Independent variables include the three nonspatial factors, distance and travel time to mammography and spatial access to primary care. Because distance and travel time to mammography essentially measure the same thing, we experimented with including each variable alone and in combination with the other variables. The results were very consistent, so only those with travel time are presented here. There is also some collinearity between the access to primary care variable and travel time to mammography (Pearson's r = 0.41). To check whether collinearity was affecting the substantive findings of the models, we entered each variable alone and in combination, along with the other independent variables. The p values for the two spatial variables did not change appreciably, indicating that the main statistical conclusions are robust to collinearity.
In analyzing variations in late-stage breast cancer over small areas like zip codes, the small numbers problem is a major challenge (Diehr 1984; Wang and O'Brien 2005). Many rural zip codes have few cases of breast cancer, making it difficult to examine spatial associations. Although poisson regression is fairly robust to small numbers, problems arise when the counts include many zeros, a problem that exists when all zip codes are analyzed. To check whether results are consistent when small zip codes are eliminated, we ran the models a second time only for zip codes with ten or more breast cancer cases (approximately 40 percent of the zip codes in the state). The results of these models were very similar to those for the full set of zip codes. Only the results for zip codes with ten or more cases are presented here.
Illinois is a geographically diverse state, from densely populated Chicago to sparsely populated rural areas. Within this mix, the city of Chicago stands out, its large concentration of health care services and dense transportation network leading to relatively high levels of spatial access. Given this, we expect that the associations between spatial access and late-stage breast cancer will differ between Chicago and the rest of the state. To investigate this geographic disparity, separate poisson regression models are estimated for the two regions. We were unable to estimate the poisson regression models for the more detailed rural–urban categories presented in Table 1 because of small numbers of zip codes in several of the categories.
Spatial autocorrelation is an important issue in regression models such as those estimated here. To check whether residual spatial autocorrelation exists, we computed deviance residuals for each poisson regression model and calculated Moran's I for the residuals. To assess the sensitivity of results to the choice of spatial weights, three alternative spatial weights—fourth, sixth, and eighth nearest neighbor weights—were used in the calculations. This descriptive analysis reveals little to no evidence of residual spatial autocorrelation. Moran's I values are low, ranging from −0.0083 to −0.0107 for the Chicago-only model and from 0.092 to 0.107 for the non-Chicago, n ≥ 10 model.
Association between Late-Stage Breast Cancer and Health Care Access
Table 3 shows the results of the poisson regression models relating access variables and late-stage risk. The model coefficients indicate that both spatial and nonspatial factors affect variation in late-stage breast cancer risk by zip code. In the model for all zip codes, socioeconomic disadvantage (factor 1), sociocultural barriers (factor 2), and spatial access to primary care (access) have statistically significant associations with late breast cancer diagnosis. As expected, socioeconomic disadvantage and sociocultural barriers have positive relationships, indicating that persons living in areas where income and education levels are low and linguistic and sociocultural barriers are high have a greater risk of late-stage disease. Spatial access to primary care physicians is inversely related to late-stage risk. Living in areas with poor geographical access to primary care physicians increases the likelihood of late diagnosis for breast cancer. Interestingly, travel time to mammography services (time) has no statistically significant association with late-stage risk.
Table 3. Poisson regression models for late-stage breast cancer by zip code in Illinois, 1998–2000.
| Coefficent | Std. Error | p | |
|---|---|---|---|
| All zip codes | |||
| Factor 1 (socioeconomic disadvantage) | 0.139 | 0.016 | 0.000 |
| Factor 2 (sociocultural barriers) | 0.084 | 0.0016 | 0.000 |
| Factor 3 (health care needs) | −0.013 | 0.015 | 0.369 |
| Access | −27.242 | 11.039 | 0.014 |
| Time | 0.002 | 0.002 | 0.395 |
| Chicago only | |||
| Factor 1 (socioeconomic disadvantage) | 0.102 | 0.029 | 0.000 |
| Factor 2 (sociocultural barriers) | 0.046 | 0.026 | 0.075 |
| Factor 3 (health care needs) | −0.154 | 0.052 | 0.003 |
| Access | 36.628 | 53.076 | 0.490 |
| Time | 0.004 | 0.013 | 0.773 |
| Outside Chicago | |||
| Factor 1 (socioeconomic disadvantage) | 0.126 | 0.031 | 0.000 |
| Factor 2 (sociocultural barriers) | 0.083 | 0.025 | 0.001 |
| Factor 3 (health care needs) | −0.008 | 0.017 | 0.624 |
| Access | −36.184 | 13.254 | 0.006 |
| Time | 0.001 | 0.002 | 0.485 |
When the model is re-estimated for the city of Chicago only, somewhat different findings emerge (Table 3). In this urban context, the three socioeconomic factors are statistically significant predictors of late-stage breast cancer risk, but neither spatial access variable is significant. Socioeconomic disadvantage (factor 1) and higher health care needs (factor 3) have the largest influences on late-stage risk. These findings are consistent with the results of other studies in urban settings, which demonstrate a strong association between local area social and demographic characteristics and breast cancer stage (Mandelblatt et al. 1991; Barry and Breen 2005). In contrast, the effects of the two spatial access variables—travel time to mammography and access to primary care—are not statistically significant. This is consistent with research demonstrating complex associations among poverty, race and spatial access to mammography in Chicago (Zenk, Tarlov, and Sun 2006). Thus, in the city of Chicago, late-stage risk is mainly related to socioeconomic and demographic factors. Spatial barriers, given the relatively dense distributions of primary care physicians and mammography facilities in Chicago, are less important.
In the suburban and rural areas outside Chicago, spatial access is much more significant. Geographical access to primary care physicians is strongly related to late-stage risk (Table 3), indicating that the risk of late-stage breast cancer is higher in places with few available primary care physicians. This suggests that poor geographical access to primary care underpins the higher rates of late-stage breast cancer in some rural and suburban areas. Indeed poor spatial access to primary care is mainly a problem in rural areas in Illinois (Wang and Luo 2005). Again, longer travel times to mammography services are not statistically associated with higher late-stage risk. This might reflect the fact that the state is relatively well covered by mammography facilities. For zip codes outside Chicago, the average estimated travel time to mammography services is just 13.1 minutes, and only 2 percent of zip codes have an estimated travel time greater than thirty-five minutes. (Note that these travel times do not include intrazonal travel, which is estimated to be more than ten minutes for drive-alone commuting trips; Wang 2003.) In addition to primary care access, two of the nonspatial, contextual variables are strongly related to late-stage risk. As in the previous models, socioeconomic disadvantage and sociocultural barriers are associated with higher risks. Risks are greater in places with disadvantaged, marginalized populations, confirming the strong ties between late-stage breast cancer and socioeconomic barriers in rural and suburban regions of Illinois. Lacking individual-level data on socioeconomic status, we cannot determine whether this association reflects individual socioeconomic disadvantage or disadvantage in the local areas in which individuals reside. However, the strong and consistent ties between disadvantage and late-stage risk in a nonurban setting warrant future research attention.
Conclusions
For many types of cancer including breast cancer, stage at diagnosis is a critically important determinant of health outcomes, including risks of mortality. This study focuses on impacts of health care access on late-stage breast cancer diagnosis. Access includes spatial access to health care such as primary care and mammography screening services and nonspatial factors such as socioeconomic and demographic characteristics. Our study indicates that people living in areas with a high concentration of disadvantaged populations (i.e., low-income groups and racial and ethnic minorities) are more likely to be diagnosed with late-stage breast cancer. The finding is consistent across all models for statewide, Chicago-only, and outside-Chicago zip codes. This confirms results in Detroit (Bradley, Given, and Roberts 2002) and other places (Merkin, Stevenson, and Rowe 2002; Vinnakota and Lam 2006) that identify the strong associations between socioeconomic vulnerability and late-stage cancer risk and mortality.
More important, our study highlights the importance of geographical access to primary care access in reducing the risk of late-stage breast cancer. Primary care physicians are the first line of defense in the health delivery system and they are critical for the success of preventive care (Lee 1995). Most preliminary screenings and referrals for breast cancer detection are conducted at primary care doctors' offices. Primary care physicians typically refer patients to mammography services, thus it makes sense that in our models, primary care access is a much more important predictor of late-stage risk than is travel time to mammography. The importance of primary care access in rural areas reflects the rural physician shortage (Rosenblatt and Lishner 1991; Wang and Luo 2005), and our results suggest that this shortage has important implications for early cancer detection. Both the models for Illinois as a whole and for the areas outside of Chicago show that poor spatial access to primary care is associated with high risks of late-stage breast cancer diagnosis.
Our study shows no statistically significant association between travel time to mammography services and the stage of breast cancer diagnosis after spatial access to primary care and zip code socioeconomic characteristics are controlled. This finding might reflect the Illinois context. The average estimated travel time to mammography services is fairly short in Illinois, and thus, on average, distance or travel time to mammography might not be a major issue. Illinois is relatively well served geographically by existing mammography facilities, and gaps in service availability might have been filled by mobile mammography services that exist in some of the most isolated parts of the state. The mammography findings also need to be understood in association with the results for primary care access. Spatial access to primary health care services is critically important, and when that access is controlled in statistical models, travel time to mammography has no statistical association with late-stage breast cancer risk. This suggests that in the Illinois context, spatial access to primary care doctors is more important than access to mammography facilities in achieving high rates of early breast cancer detection.
The results of this study are limited by the reliance on zip code data. Zip code boundaries are imprecise, and the areas vary in size and demographic composition. Also, using zip codes as the unit of analysis raises the potential for the ecological fallacy in which area characteristics might be inaccurately associated with individual health outcomes. We plan to address such limitations in a future study using multilevel modeling to incorporate the effects on late-stage cancer of certain individual risk factors along with area characteristics. Despite these limitations, this research highlights the importance of spatial access to primary health care in reducing the risk of late breast cancer detection. Spatial access is critically important outside the dense urban setting of Chicago, where it works in concert with place-based socioeconomic disadvantage to influence late-stage risk. These associations between spatial and social inequalities and breast cancer disparities are important topics for future investigation.
Biographies
Fahui Wang is a Professor in the Department of Geography and Anthropology at Louisiana State University, Baton Rouge, LA 70803. E-mail: fwang@lsu.edu. His research interests include GIS and spatial analysis applications in health and crime research, urban and regional analysis, and China studies.
Sara McLafferty is a Professor in the Department of Geography at the University of Illinois at Urbana-Champaign, Urbana, IL 61801-3671. E-mail: smclaff@uiuc.edu. Her research interests include the geographies of health and health care, urban geography, and spatial analysis methods/GIS.
Veronica Escamilla is a PhD student in the Department of Geography, University of North Carolina at Chapel Hill, Chapel Hill, NC 27599-3220. E-mail: escamill@email.unc.edu. Her research interests include GIS, spatial analysis, and medical geography.
Lan Luo is a PhD student in the Department of Geography at the University of Illinois at Urbana-Champaign, Urbana, IL 61801-3671. E-mail: lanluoniu@yahoo.com. Her research interests include GIS, spatial analysis, and medical geography.
Footnotes
Financial support from the National Cancer Institute (NCI), National Institutes of Health, under Grant 1-R21-CA114501-01, is gratefully acknowledged. Points of view or opinions in this article are those of the authors, and do not necessarily represent the official position or policies of NCI. The research was conducted when Wang and Luo were at Northern Illinois University, and Escamilla was at University of Illinois at Urbana-Champaign.
To obtain the travel time from a zip code centroid to a mammography facility, we compute (1) the travel time between a zip code centroid and its nearest node (say, A) on the network, (2) the travel time between a mammography and its nearest node (say, B) on the network, and (3) the travel time between the two nodes A and B that are on the network. The first two segments are minor and are approximated as travel time across straight-line (crows-fly) distances. See Wang (2006, 23–31).
This variable intends to capture an important population characteristic (white vs. nonwhite), and does not include whites of Hispanic origin. The correlation coefficient between nonwhite and non-Hispanic nonwhite is as high as 0.97 in the study area. Defining the variable as non-Hispanic nonwhite does not significantly alter the results in later FA or regression on breast cancer diagnosis.
A component with eigenvalues less than one accounts for less than an original variable's variance (=1 after data standardization), and thus does not serve the purpose of data reduction.
Publisher's Disclaimer: This article maybe used for research, teaching and private study purposes. Any substantial or systematic reproduction, re-distribution, re-selling, loan or sub-licensing, systematic supply or distribution in any form to anyone is expressly forbidden.
The publisher does not give any warranty express or implied or make any representation that the contents will be complete or accurate or up to date. The accuracy of any instructions, formulae and drug doses should be independently verified with primary sources. The publisher shall not be liable for any loss, actions, claims, proceedings, demand or costs or damages whatsoever or howsoever caused arising directly or indirectly in connection with or arising out of the use of this material.
Contributor Information
Fahui Wang, Louisiana State University.
Sara McLafferty, University of Illinois at Urbana-Champaign.
Veronica Escamilla, University of North Carolina at Chapel Hill.
Lan Luo, University of Illinois at Urbana-Champaign.
Literature Cited
- Adams E, Florence C, Thorpe K, Becker E, Joski C. Preventive care: Female cancer screening, 1996–2000. American Journal of Preventive Medicine. 2003;25:301–7. doi: 10.1016/s0749-3797(03)00216-2. [DOI] [PubMed] [Google Scholar]
- Amey C, Miller M, Albrecht S. The role of race and residence in determining stage at diagnosis of breast cancer. Journal of Rural Health. 1997;13:99–108. doi: 10.1111/j.1748-0361.1997.tb00939.x. [DOI] [PubMed] [Google Scholar]
- Anselin L, Syabri I, Koh Y. GEODA: An introduction to spatial data analysis. Geographical Analysis. 2006;38:5–22. [Google Scholar]
- Barrett K, Legg J. Demographic and health factors associated with mammography utilization. American Journal of Health Promotion. 2005;19:401–5. doi: 10.4278/0890-1171-19.6.401. [DOI] [PubMed] [Google Scholar]
- Barry J, Breen N. The importance of place of residence in predicting late-stage diagnosis of breast or cervical cancer. Health and Place. 2005;11:15–29. doi: 10.1016/j.healthplace.2003.12.002. [DOI] [PubMed] [Google Scholar]
- Bennett C, Ferreira M, Davis T, Kaplan J, Weinberger M, Kuzel T, Seday MA, Sartor O. Relation between literacy, race, and stage of presentation among low-income patients with prostate cancer. Journal of Clinical Oncology. 1998;16:3101–4. doi: 10.1200/JCO.1998.16.9.3101. [DOI] [PubMed] [Google Scholar]
- Brabyn L, Gower P. Mapping accessibility to general practitioners. In: Khan O, Skinner R, editors. Geographic information systems and health applications. Hershey, PA: Idea Group Publishing; 2003. pp. 289–307. [Google Scholar]
- Bradley C, Given C, Roberts C. Disparities in cancer diagnosis and survival. Cancer. 2001;91:178–88. doi: 10.1002/1097-0142(20010101)91:1<178::aid-cncr23>3.0.co;2-s. [DOI] [PubMed] [Google Scholar]
- Bradley C, Given C, Roberts C. Race, socioeconomic status and breast cancer treatment and survival. Journal of the National Cancer Institute. 2002;94:490–96. doi: 10.1093/jnci/94.7.490. [DOI] [PubMed] [Google Scholar]
- Cameron A, Trivedi P. Regression analysis of count data. Cambridge, U.K.: Cambridge University Press; 1998. [Google Scholar]
- Cooper R. Seeking a balanced physician workforce for the 21st century. Journal of the American Medical Association. 1994;272:680–87. [PubMed] [Google Scholar]
- Cross CK, Harris J, Recht A. Race, socioeconomic status, and breast carcinoma in the U.S.: What have we learned from clinical studies? Cancer. 2002;95:1988–99. doi: 10.1002/cncr.10830. [DOI] [PubMed] [Google Scholar]
- Cui Y, Whiteman M, Langenberg P, Sexton M, Tkaczuk K, Flaws J, Bush T. Can obesity explain the racial difference in stage of breast cancer at diagnosis between black and white women? Journal of Women's Health & Gender-Based Medicine. 2002;11:527–36. doi: 10.1089/152460902760277886. [DOI] [PubMed] [Google Scholar]
- Diehr P. Small area statistics: Large statistical problems. American Journal of Public Health. 1984;74:313–14. doi: 10.2105/ajph.74.4.313. [DOI] [PMC free article] [PubMed] [Google Scholar]
- Eley JW, Hill HA, Chen VW, Austin DF, Wesley MN, Muss HB, Greenberg RS, Coates RJ, Correa P, Redmond CK. Racial differences in survival from breast cancer—Results of the National Cancer Institute Black/White survival study. Journal of the American Medical Association. 1994;272:947–54. doi: 10.1001/jama.272.12.947. [DOI] [PubMed] [Google Scholar]
- Engelmann K, Hawley D, Gazaway R, Mozier M, Ahluwalia A, Ellerbeck E. Impact of geographic barriers on the utilization of mammograms by older rural women. Journal of the American Geriatric Society. 2002;50:62–68. doi: 10.1046/j.1532-5415.2002.50009.x. [DOI] [PubMed] [Google Scholar]
- Field K. Measuring the need for primary health care: An index of relative disadvantage. Applied Geography. 2000;20:305–32. [Google Scholar]
- Goel M, Wee C, McCarthy E, Davis R, Ngo-Metzger Q, Phillips R. Racial and ethnic disparities in cancer screening: The importance of foreign birth as a barrier to care. Journal of General Internal Medicine. 2003;18:1028–35. doi: 10.1111/j.1525-1497.2003.20807.x. [DOI] [PMC free article] [PubMed] [Google Scholar]
- Goodchild M, Anselin L, Deichmann U. A framework for the interpolation of socioeconomic data. Environment and Planning A. 1993;25:383–97. [Google Scholar]
- Goodchild M, Lam NS. A real interpolation: A variant of the traditional spatial problem. Geoprocessing. 1980;1:297–331. [Google Scholar]
- Grubesic T. Zip codes and spatial analysis: Problems and prospects. Paper presented at the annual meeting of the Association of American Geographers; Chicago. 2006. [Google Scholar]
- Hart G. Rural-urban commuting areas codes, version 2.0. [13 November 2007];2006 http://depts.washington.edu/uwruca/ and http://www.doh.wa.gov/Data/guidelines/RuralUrban.htm#Ruca.
- Jacobellis J, Cutter G. Mammography screening and differences in stage of disease by race/ethnicity. American Journal of Public Health. 2002;92:1144–50. doi: 10.2105/ajph.92.7.1144. [DOI] [PMC free article] [PubMed] [Google Scholar]
- Jacquez J, Greiling J. Local clustering of breast, lung and colorectal cancer in Long Island, New York. International Journal of Health Geographics. 2003;2(1):3. doi: 10.1186/1476-072X-2-3. [DOI] [PMC free article] [PubMed] [Google Scholar]
- Joseph A, Phillips D. Accessibility and utilization: Geographical perspectives on health care delivery. New York: Harper & Row; 1984. [Google Scholar]
- Kirby R. Toward congruence between theory and practice in small area analysis and local public health data. Statistics in Medicine. 1996;15:1859–66. doi: 10.1002/(SICI)1097-0258(19960915)15:17<1859::AID-SIM397>3.0.CO;2-0. [DOI] [PubMed] [Google Scholar]
- Knapp K, Hardwick K. The availability and distribution of dentists in rural ZIP codes and primary care health professional shortage areas (PC-HPSA) ZIP codes: Comparison with primary care providers. Journal of Public Health Dentistry. 2000;60:43–49. doi: 10.1111/j.1752-7325.2000.tb03291.x. [DOI] [PubMed] [Google Scholar]
- Lannin D, Mathews H, Mitchell J, Swanson M, Swanson F, Edwards M. Influence of socioeconomic and cultural factors on racial differences in late-stage presentation of breast cancer. Journal of American Medical Association. 1998;279:1801–7. doi: 10.1001/jama.279.22.1801. [DOI] [PubMed] [Google Scholar]
- Lee P. Health system reform and generalist physician. Academic Medicine. 1995;70:S10–S13. doi: 10.1097/00001888-199501000-00019. [DOI] [PubMed] [Google Scholar]
- Lehnerr M, Havener L. Assessment of interstate exchange of cancer data: Illinois. Springfield: Illinois State Department of Public Health; 2002. pp. 1986–1998. [Google Scholar]
- Liff J, Chow W, Greenberg R. Rural–urban differences in stage at diagnosis: Possible relationship to cancer screening. Cancer. 1991;67:1454–59. doi: 10.1002/1097-0142(19910301)67:5<1454::aid-cncr2820670533>3.0.co;2-k. [DOI] [PubMed] [Google Scholar]
- Lin G, Zhang T. Loglinear residual tests of Moran's I autocorrelation and their applications to Kentucky breast cancer data. Geographical Analysis. 2007;39:293–310. [Google Scholar]
- Luo W, Wang F. Measures of spatial accessibility to healthcare in a GIS environment: Synthesis and a case study in Chicago region. Environment and Planning B: Planning and Design. 2003;30:865–84. doi: 10.1068/b29120. [DOI] [PMC free article] [PubMed] [Google Scholar]
- Mandelblatt J, Andrews H, Kerner J, Zauber A, Burnett W. Determinants of late stage at diagnosis for breast and cervical cancer: The impact of age, race, social class and hospital type. American Journal of Public Health. 1991;81:646–49. doi: 10.2105/ajph.81.5.646. [DOI] [PMC free article] [PubMed] [Google Scholar]
- Marchick J, Henson D. Correlations between access to mammography and breast cancer stage at diagnosis. Cancer. 2005;103:1571–80. doi: 10.1002/cncr.20915. [DOI] [PubMed] [Google Scholar]
- McLafferty S. GIS and health care. Annual Reviews of Public Health. 2003;24:25–42. doi: 10.1146/annurev.publhealth.24.012902.141012. [DOI] [PubMed] [Google Scholar]
- Meade S, Earickson R. Medical geography. 2nd. New York: Guilford; 2000. [Google Scholar]
- Merkin S, Stevenson L, Rowe N. Geographic socioeconomic status, race, and advanced-stage breast cancer in New York City. American Journal of Public Health. 2002;92:64–70. doi: 10.2105/ajph.92.1.64. [DOI] [PMC free article] [PubMed] [Google Scholar]
- Mullins D. An overview of cancer economics (based on a presentation) American Journal of Managed Care. 1999;5S:371–76. [PubMed] [Google Scholar]
- Ng E, Wilkins R, Perras A. How far is it to the nearest hospital? Calculating distances using the Statistics Canada Postal Code Conversion File. Health Report. 1993;5:179–88. [PubMed] [Google Scholar]
- Oluwole S, Ali A, Adu A, Blane B, Barlow B, Oropeza R, Freeman H. Impact of a cancer screening program on breast cancer stage at diagnosis in a medically underserved urban community. Journal of the American College of Surgeons. 2003;196:180–88. doi: 10.1016/S1072-7515(02)01765-9. [DOI] [PubMed] [Google Scholar]
- Parker E, Campbell J. Measuring access to primary medical care: Some examples of the use of geographical information systems. Health and Place. 1998;4:183–93. doi: 10.1016/s1353-8292(98)00010-0. [DOI] [PubMed] [Google Scholar]
- Roche L, Skinner R, Weinstein R. Use of a geographic information system to identify and characterize areas with high proportions of distant stage breast cancer. Journal of Public Health Management and Practice. 2002;8:26–32. doi: 10.1097/00124784-200203000-00004. [DOI] [PubMed] [Google Scholar]
- Roetzheim R, Pal N, Tennant C, Voti L, Ayanian J, Schwabe A, Krischer J. Effects of health insurance and race on early detection of cancer. Journal of the National Cancer Institute. 1999;91:1409–15. doi: 10.1093/jnci/91.16.1409. [DOI] [PubMed] [Google Scholar]
- Rosenblatt R, Lishner D. Surplus or shortage? Unraveling the physician supply conundrum. West Journal of Medicine. 1991;154:43–50. [PMC free article] [PubMed] [Google Scholar]
- Schootman M, Sun D. Small-area incidence trends in breast cancer. Epidemiology. 2004;15:300–307. doi: 10.1097/01.ede.0000121605.41388.7c. [DOI] [PubMed] [Google Scholar]
- Schwartz K, Crossley-May H, Vigneau F, Brown K, Banerjee M. Race, socioeconomic status and stage at diagnosis for five common malignancies. Cancer Causes and Control. 2003;14:761–66. doi: 10.1023/a:1026321923883. [DOI] [PubMed] [Google Scholar]
- Sheehan J, DeChello L. A space–time analysis of the proportion of late stage breast cancer in Massachusetts, 1988 to 1997. International Journal of Health Geographics. 2005;4:15. doi: 10.1186/1476-072X-4-15. [DOI] [PMC free article] [PubMed] [Google Scholar]
- Spatial Analysis Laboratory, University of Illinois. Urbana-Champaign, IL: Department of Geography, University of Illinois; 2006. [15 November 2007]. GeoDa 0.95i. https:www.geoda.uiuc.edu/ [Google Scholar]
- Spitler H, Mayo R, Parker V. Patterns of breast, cervical, colorectal, and prostate cancer in the Appalachian region of South Carolina. Ethnicity & Disease. 2001;11:51–59. [PubMed] [Google Scholar]
- Thomas A, Carlin B. Late detection of breast and colorectal cancer in Minnesota counties: An application of spatial smoothing and clustering. Statistics in Medicine. 2003;22:113–27. doi: 10.1002/sim.1215. [DOI] [PubMed] [Google Scholar]
- Vinnakota S, Lam N. Socioeconomic inequality of cancer mortality in the United States: A spatial data mining approach. International Journal of Health Geographics. 2006;5:9. doi: 10.1186/1476-072X-5-9. [DOI] [PMC free article] [PubMed] [Google Scholar]
- Wang F. Job proximity and accessibility for workers of various wage groups. Urban Geography. 2003;24:253–71. [Google Scholar]
- Wang F. Quantitative methods and applications in GIS. London: CRC Press; 2006. [Google Scholar]
- Wang F, Luo W. Assessing spatial and nonspatial factors in healthcare access in Illinois: Towards an integrated approach to defining health professional shortage areas. Health and Place. 2005;11:131–46. doi: 10.1016/j.healthplace.2004.02.003. [DOI] [PubMed] [Google Scholar]
- Wang F, O'Brien C. Constructing geographic areas for analysis of homicide in small populations: Testing herding-culture-of-honor proposition. In: Wang F, editor. Geographic information systems and crime analysis. Hershey, PA: Idea Group; 2005. pp. 84–100. [Google Scholar]
- Zenk S, Tarlov E, Sun J. Spatial equity in facilities providing low- or no-fee screening mammography in Chicago neighborhoods. Journal of Urban Health. 2006;83:195–210. doi: 10.1007/s11524-005-9023-4. [DOI] [PMC free article] [PubMed] [Google Scholar]