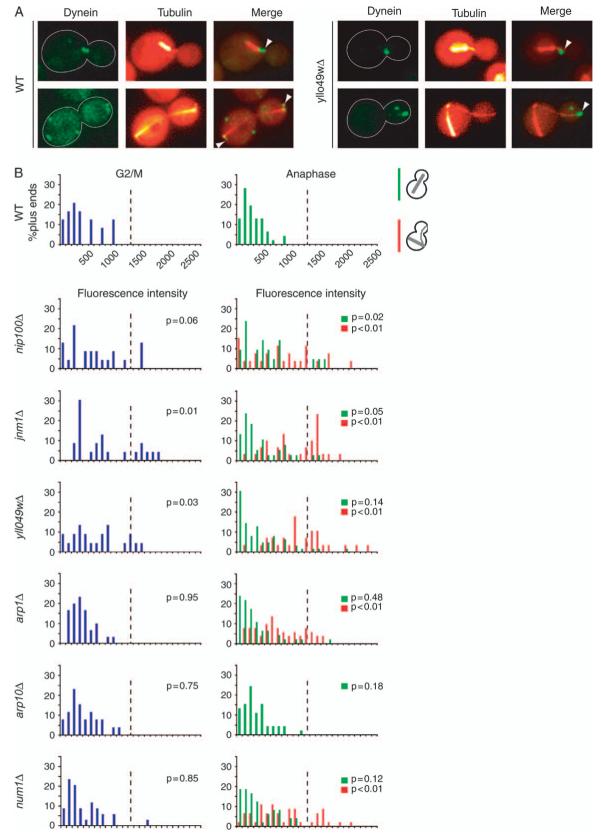
Figure 7. Dynein accumulation at microtubule plus ends in the absence of dynactin.
A) Images of DHC/Dyn1 tagged with 3GFP in wild-type and yll049wΔ cells expressing CFP-labeled microtubules. Arrowheads mark Dyn1-3GFP located at microtubule plus ends. B) Histograms of Dyn1-3GFP fluorescence intensity at microtubule plus ends in wild-type and mutant cells. The fluorescence intensity of Dyn1-3GFP per cytoplasmic microtubule plus end was determined in G2/M and anaphase cells expressing CFP-Tub1-labeled microtubules. Cell cycle stage was assessed from spindle length. Spindles ∼1-1.25 μm in length were scored as G2/M, and longer spindles were scored as anaphase. Blue bars represent microtubule plus ends in G2/M cells. Green bars represent plus ends of cells with properly aligned anaphase spindles that traverse the bud neck. Red bars represent plus ends of cells with anaphase spindles that are contained entirely within the mother cell and misaligned with respect to the axis of division. The wild-type and arp10Δ strains displayed only correctly positioned anaphase spindles. Z-series images were captured from asynchronous cultures of wild-type (yJC4149), nip100Δ (yJC4145), jnm1Δ (yJC4150), yll049wΔ (yJC4160), arp1Δ (yJC4143), arp10Δ (yJC4547) and num1Δ (yJC4164) strains. Microtubule ends were identified using CFP-Tub1, and intensity measurements were taken on the corresponding plane of the GFP stack using ImageJ (Materials and Methods). For G2/M cells, 22-34 microtubule ends were scored per sample, and for anaphase, 21-62 were scored. The p values were generated by t-tests comparing the result for a given mutant with the wild-type result in either G2/M or anaphase. The dashed line on each chart is drawn at the same position for reference.

