Abstract
One hundred and sixty-eight genotypes of cotton from the same growing region were used as a germplasm group to study the validity of different genetic distances in constructing cotton core subset. Mixed linear model approach was employed to unbiasedly predict genotypic values of 20 traits for eliminating the environmental effect. Six commonly used genetic distances (Euclidean, standardized Euclidean, Mahalanobis, city block, cosine and correlation distances) combining four commonly used hierarchical cluster methods (single distance, complete distance, unweighted pair-group average and Ward’s methods) were used in the least distance stepwise sampling (LDSS) method for constructing different core subsets. The analyses of variance (ANOVA) of different evaluating parameters showed that the validities of cosine and correlation distances were inferior to those of Euclidean, standardized Euclidean, Mahalanobis and city block distances. Standardized Euclidean distance was slightly more effective than Euclidean, Mahalanobis and city block distances. The principal analysis validated standardized Euclidean distance in the course of constructing practical core subsets. The covariance matrix of accessions might be ill-conditioned when Mahalanobis distance was used to calculate genetic distance at low sampling percentages, which led to bias in small-sized core subset construction. The standardized Euclidean distance is recommended in core subset construction with LDSS method.
Keywords: Core subset, Mixed linear model, Least distance stepwise sampling (LDSS) method, Standardized Euclidean distance, Mahalanobis distance
INTRODUCTION
The concept of core collection was proposed by Frankel (1984) and developed by Brown (1989). A core collection is defined as a representative sample of the entire collection with minimum repetitiveness and maximum genetic diversity of a plant species and its relatives, and the other part of the initial collection is defined as reserve collection (Frankel, 1984). The core collection serves as a working collection that can be evaluated and utilized preferentially, which provides a convenient way to study and utilize germplasm resources and has received extensive attention all over the world.
One common approach for constructing a core collection is stratifying the whole collection by growing regions or ecotype and then selecting representative core accessions from each of the classified groups to form core subsets, and the whole core collection is constructed by combining all core subsets (Brown, 1995; Qiu et al., 2003). For a core collection, representativeness is the most important property. The main way to improve the representativeness of a core collection is to select more representative core subsets from the whole collection (Wang et al., 2007a). Cluster analysis has been widely used as an important tool to reduce redundancy and select core accessions within groups in germplasm research (van Hintum, 1995; Zewdie et al., 2004; Upadhyaya et al., 2006; Mosjidis and Klingler, 2006). Genetic distance and cluster method are main impact factors in core subset construction. Different genetic distance or cluster method leads to different core subset. In core subset construction, the least distance stepwise sampling (LDSS) has been proved to be a valid method for eliminating the influence of different cluster methods (Wang et al., 2007b). However, genetic distance calculation is premise for cluster analysis. The validities of different genetic distances in constructing core subsets by LDSS method have not been deeply investigated. The objective of present research was to use different common genetic distances and different common cluster methods to construct core subsets to evaluate the validities of different genetic distances.
MATERIALS AND METHODS
Materials
One hundred and sixty-eight cotton genotypes came from the same growing region and were used as a germplasm group to construct core subsets. All the 168 genotypes were planted for 2 years with 2 replications per year. The observed data of 20 quantitative traits on those plants were recorded. There were 11 agronomy traits (height of plant, height of fruiting branch, length of fruiting node, length of boll stalk, number of fruiting branch per plant, number of bolls per plant, incidence of infected plant, index of wilt disease, growth period, boll weight, and lint percentage), 5 fiber traits (length, uniformity, strength, elongation and micronaire) and 4 seed traits (seed length, seed width, ratio of length to width and kernel weight) in this initial germplasm group.
Core subset construction
Core subsets were constructed by LDSS method (Wang et al., 2007b). First, a precise sampling percentage of the core subset was determined based on other researches. Next, the genetic distances between accessions were calculated and accessions were grouped by hierarchical cluster analysis based on the genetic distance. One accession from a subgroup with the least distance, which was unique in the whole dendrogram, was randomly removed, and another accession of the subgroup was sampled. Then, the genetic distances among the remained accessions were calculated again, and the sampling was performed by the same way. The stepwise samplings were performed until the percentage of the remained accessions reached the given sampling percentage.
The sampling performed in this method was based on the subgroup with the least genetic distance, which could efficiently eliminate redundant accessions. Moreover, the constructing result of this method was not affected by cluster methods because subgroup with least distance was unique in each procedure of cluster (Wang et al., 2007b). Coincidence rate of range (CR) and variable rate of coefficient of variation (VR) (Hu et al., 2000; Upadhyaya and Ortiz, 2001; Kang et al., 2006) were adopted to evaluate the representativeness of core subsets.
Genetic distances and cluster methods
Six commonly used genetic distances (Euclidean distance, Euclid; standardized Euclidean distance, Seuclid; Mahalanobis distance, Mahal; city block distance, Cityblock; cosine distance, Cosine; correlation distance, Correlation) (Chen et al., 2002) were used to assess genetic distances among accessions. Four hierarchical cluster methods (nearest distance method, Single; furthest distance method, Complete; unweighted pair-group average method, Average; Ward’s method, Ward) (Chen et al., 2002) were used to perform clustering to construct different core subsets by combining six genetic distances.
In each combination (a genetic distance plus a cluster method), 84 core subsets were constructed based on 21 sampling percentages ranging from 10% to 30% with 4 replications per sampling percentage. Further, 2016 core subsets were achieved from the 24 combinations (6 genetic distances combining 4 cluster methods) for 84 core subsets. Core subsets constructed by Complete random method were treated as controls.
Validation of core subsets
The initial germplasm group was treated by the principal components analysis to validate the core subsets. Distribution of the core accessions and the reserved accessions was plotted by the first two principal components at the sampling percentages of 20%, 25% and 30%. Core subsets constructed by Complete random method were treated as control (Xu et al., 2006).
Data management
Mixed linear model approach (Zhu and Weir, 1996) was used to predict genotypic values of all cotton genotypes in each quantitative trait to eliminate environmental and GE (genotypical×environmental) effects. The model is:
| Yhk(ij)=μ+Eh+Ri(h)+Cj(h)+Gk(ij)+GEhk(ij)+εhk(ij), |
where Yhk (ij) is the observed value of the kth genotype in the hth environment within the ith row and the jth column; μ is the population mean; Eh is the fixed effect of the hth environment; Ri (h) is the fixed effect of the ith row within the hth environment; Cj (h) is the fixed effect of the jth column within the hth environment; Gk (ij) is the random effect of the kth genotype within the ith row and the jth column, Gk (ij)~(0,σG 2); GEhk (ij) is the random effect of the interaction between the hth environment and the kth genotype, GEhk (ij)~(0,σGE 2); εhk (ij) is the residual effect, εhk (ij)~(0,σε 2). All genotypic values of each trait were standardized (μ=0, σ=1) and used to construct core subsets. All analyses were conducted in MATLAB software, version 6.5.
RESULTS
Evaluation of different genetic distances
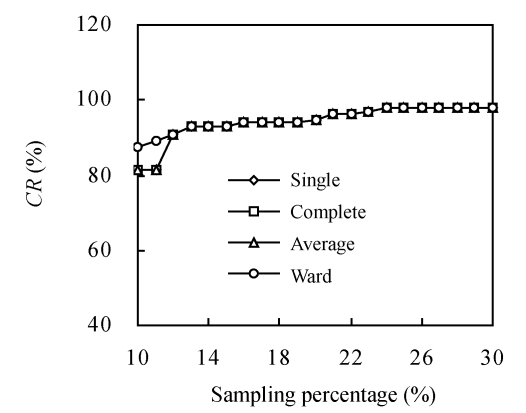
CR had been proved to be more robust than VR (Wang et al., 2007a), and we, therefore, chose CR to investigate the representation of different cluster methods combining different genetic distances in constructing core subsets. With the sampling percentage increasing, CR increased in all combinations (Fig.1). In all the five genetic distances (Euclid, Seuclid, Cityblock, Cosine and Correlation), core subsets constructed by the four cluster methods (Single, Complete, Average and Ward) showed completely the same changing curve in CR. By comparing the accessions in each core subset, all these four core subsets with the same sampling percentage and genetic distance were composed of the same accessions. However, Ward combining Mahal showed different CR changing curve compared to the other three cluster methods when the sampling percentage was less than 12%, while the four cluster methods combining Mahal showed exactly the same CR changing curve when the sampling percentage was over 12% (Fig.1).
Fig. 1.
The changing trend of coincidence rate of range (CR) of core subsets constructed by different hierarchical cluster methods combining Mahal distance
In order to find out why Mahal showed larruping to the other genetic distances in CR, we checked the courses of calculation in all the 6 genetic distances. The sample covariance matrix of Mahal was found to be ill-conditioned when the sampling percentage was less than 12% (more than 400 elements in initial data sample matrix).
Representativeness of core subsets constructed by different genetic distances
Since all cluster methods constructed the same core subsets in one genetic distance (except Ward in Mahal), core subsets constructed by the cluster method of Single were used to determine the representativeness of core subsets constructed by different genetic distances. At all the five sampling percentages (10%, 15%, 20%, 25% and 30%), core subsets constructed by Euclid, Seuclid, Mahal and Cityblock had significantly larger (α=0.05) CR than those constructed by Cosine and Correlation, and there was no significant difference for CR in core subsets constructed by Euclid, Seuclid, Mahal and Cityblock (Table 1). Core subsets constructed by Cosine had significantly larger CR than those constructed by Correlation at 25% sampling percentage, and there was no significant difference for CR in core subsets constructed by Cosine and Correlation at other four sampling percentages (Table 1).
Table 1.
Coincidence rate of range (CR) and variable rate of coefficient of variation (VR) of core subsets constructed by different sampling percentages and genetic distances combining Single cluster method
| Genetic distance |
CR (%) |
VR (%) |
||||||||
| 10%* | 15% | 20% | 25% | 30% | 10% | 15% | 20% | 25% | 30% | |
| Euclid | 90.30a | 92.60a | 94.60a | 96.06a | 96.79a | 151.31a | 137.80a | 132.15a | 127.43a | 123.49a |
| Seuclid | 89.61a | 93.29a | 95.92a | 96.78a | 98.03a | 150.06a | 139.66a | 132.33a | 127.46a | 123.41a |
| Mahal | 81.12a | 91.69a | 93.83a | 96.10a | 97.56a | 132.39b | 134.82a | 130.44a | 125.64a | 122.37a |
| Cityblock | 88.74a | 92.39a | 94.39a | 95.41a | 96.01a | 148.73a | 138.55a | 130.12a | 126.03a | 122.39a |
| Cosine | 58.03b | 63.33b | 69.65b | 72.92b | 74.10b | 93.16c | 93.34b | 94.37b | 92.87b | 93.78b |
| Correlation | 58.24b | 68.52b | 64.61b | 66.88c | 71.04b | 94.68c | 99.46b | 90.75b | 89.25b | 91.45b |
Values with different letters in the same sampling percentage are significantly different (α=0.05) by Tukey test;
Sampling percentage
There was no significant difference for VR in core subsets constructed by Euclid, Seuclid, Mahal and Cityblock at the sampling percentages of 15%, 20%, 25% and 30% (Table 1). At sampling percentage of 10%, core subsets constructed by Euclid, Seuclid and Cityblock had significantly larger VR than those constructed by Mahal, while there was no significant difference for VR in core subsets constructed by Euclid, Seuclid and Cityblock (Table 1). At all the five sampling percentages, there was no significant difference for VR in core subsets constructed by Cosine and Correlation (Table 1).
Changing trend of the representativeness of core subsets constructed by different genetic distances
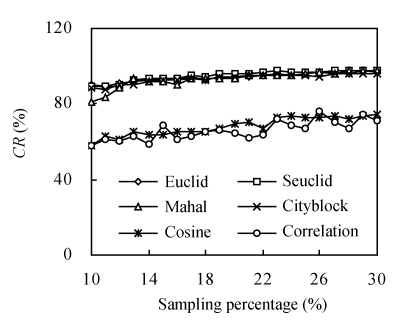
Fig.2 shows the pattern of the representativeness of core subsets constructed by different genetic distances. With the increase of the sampling percentage, CR increased in all the six genetic distances (Euclid, Seuclid, Mahal, Cityblock, Cosine and Correlation). However, CR of core subsets constructed by Cosine and Correlation increased unstably. Core subsets constructed by Cosine and Correlation had significantly lower CR than those constructed by the other four genetic distances at all sampling percentages. Compared to Euclid, Seuclid and Cityblock, Mahal constructed relatively lower CR when the sampling percentage was less than 12%. However, when the sampling percentage was over 12%, Euclid, Seuclid, Mahal and Cityblock showed similar CR. Synthesizing all sampling percentages, core subsets constructed by Seuclid had slightly larger CR than those constructed by Euclid, Mahal and Cityblock.
Fig. 2.
The changing trend of coincidence rate of range (CR) of core subsets constructed by different genetic distances combining Single cluster method
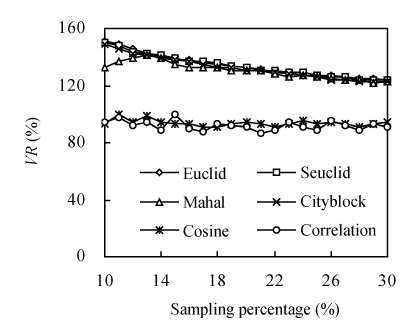
With the increase of the sampling percentage, except for core subsets constructed by Mahal at low sampling percentages (less than 12%), all VR declined (closing to 100%) in all six genetic distances. However, VR of core subsets constructed by Cosine and Correlation decreased unstably (Fig.3). Core subsets constructed by Cosine and Correlation had significantly lower VR than those constructed by the other four genetic distances at all sampling percentages (Fig.3). Compared to Euclid, Seuclid and Cityblock, core subsets constructed by Mahal had larger VR when the sampling percentage was less than 12% (Fig.3). When the sampling percentage was over 12%, Euclid, Seuclid, Mahal and Cityblock led to similar VR (Fig.3).
Fig. 3.
The changing trend of variable rate of coefficient of variation (VR) of core subsets constructed by different genetic distances combining Single cluster method
Validation of core subsets by the principal component analysis
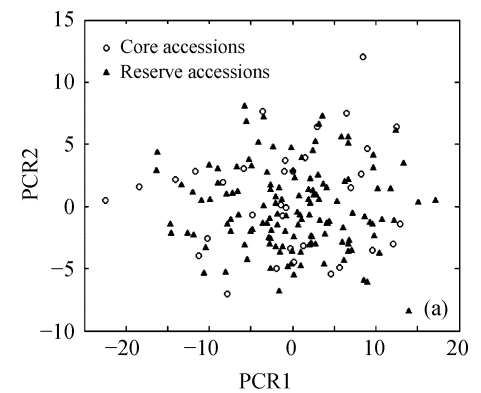
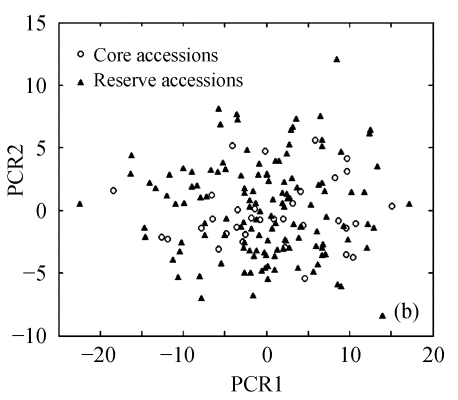
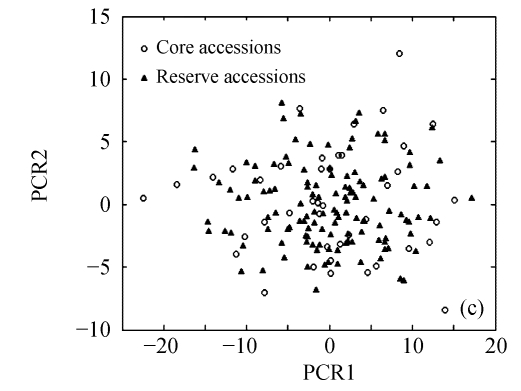
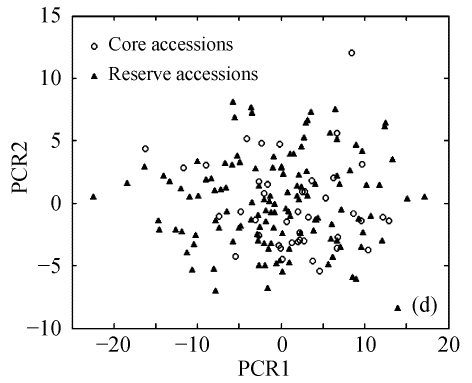
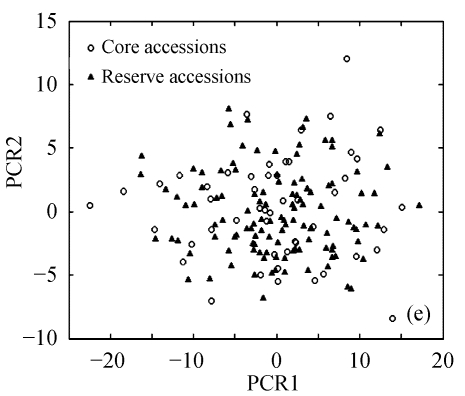
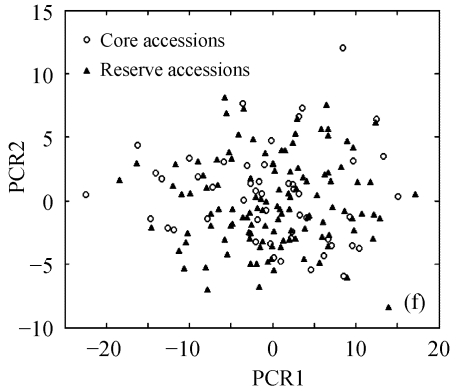
The above results suggest that Seuclid distance might be more suitable for core subset construction than the other five genetic distances. The principal component analysis was conducted to further validate core subsets constructed by Seuclid. The principal component analysis showed that the distribution of core and reserve accessions could be approximately presented by the first two principal components, which could account for 76.43% of the total genetic variation in initial germplasm group (Fig.4). Most extreme accessions were selected in core subsets by Seuclid distance and Single cluster method, while there were many extreme accessions not selected in core subsets by Complete random method (Fig.4). This phenomenon was more significant in low sampling percentages (Fig.4).
Fig. 4.
Principal component plots of core and reserve accessions in the sampling percentages for core subsets constructed by the least distance stepwise sampling (LDSS) method based on Seuclid distance combining Single cluster method or by the Complete random method. (a) LDSS method in 20% sampling percentage (Seuclid+Single); (b) Complete random method in 20% sampling percentage; (c) LDSS method in 25% sampling percentage (Seuclid+Single); (d) Complete random method in 25% sampling percentage; (e) LDSS method in 30% sampling percentage (Seuclid+Single); (f) Complete random method in 30% sampling percentage
DISCUSSION
Phenotypic values are mainly used in the research of constructing core subsets (Rodiño et al., 2003; Okpul et al., 2004; Volk et al., 2005; Yan et al., 2007). The phenotypic values of germplasm materials are easily affected by field conditions and experimental errors. Moreover, the effects of interaction between genotype and environment (GE effects) exist in phenotypic values (Hu et al., 2000). Therefore, a core subset based on phenotypic values may not accurately represent genetic diversity of the initial germplasm group (Tanksley and McCouch, 1997). Mixed linear model approach is an effective method to predict genotypic values from phenotypic values, and eliminate effects of experimental errors, environmental effects and GE effects (Hu et al., 2000; Li et al., 2004). In present research, core subsets were constructed based on genotypic values, which enabled more accurate evaluation of the methods for core subset construction.
The calculation of Mahal involves calculating sample covariance matrix, which may better reflect the genetic relationship among initial accessions. Some researches suggested that core subsets constructed by Mahal were not affected by scalar differences between traits, and more representative than those constructed by Euclid (Hu et al., 2000). However, the results of the present study show that the validity of Mahal may not be better than those of Euclid, Seuclid and Cityblock after genotypic values of each trait were standardized. The present research shows that the covariance matrix of accessions might be ill-conditioned when Mahal was used to calculate genetic distance at low sampling percentages, which led to bias in calculating the genetic distance. It suggests that Mahal might not be suitable for constructing small core subset. The calculations of Euclid, Seuclid and Cityblock do not need to calculate sample covariance matrix, which means that they are available in small core subset construction.
Our results also suggest that Seuclid is slightly more available for core subset construction than Euclid, Mahal and Cityblock. The principal component analysis validated LDSS method and Seuclid distance combining Single cluster method in core subset construction. The Seuclid distance was also validated in maize core subset construction (Crossa et al., 1995; Malosetti and Abadie, 2001). Core subsets constructed by Cosine and Correlation showed bad representativeness compared to those constructed by Euclid, Seuclid, Mahal and Cityblock. The genotypic values used in the present study were quantitative, so Cosine and Correlation may be more suitable for qualitative data in genotypic distance calculation (Yang et al., 1989). Most observed data of germplasm accessions were quantitative, and Seuclid leads to more representative core subsets and is available in any size of germplasm group. Therefore, Seuclid is recommended in core subset construction with LDSS method.
Footnotes
Project supported by the National Natural Science Foundation of China (No. 30270759), the Cooperation Project in Science and Technology between China and Poland Governments (No. 32-38), and the Scientific Research Foundation for Doctors in Shandong Academy of Agricultural Sciences (No. [2007]20), China
References
- 1.Brown AHD. Core collection: a practical approach to genetic resources management. Genome. 1989;31:818–824. [Google Scholar]
- 2.Brown AHD. The Core Collection at the Crossroads. In: Hodgkin T, Brown AHD, van Hintum TJL, et al., editors. Core Collections of Plant Genetic Resources. Chichester, UK: John Wiley and Sons; 1995. pp. 3–19. [Google Scholar]
- 3.Chen GM, Qi HY, Pan W. Mathematical Statistics in MATLAB (6.x) Beijing: Science Press; 2002. pp. 189–198. (in Chinese) [Google Scholar]
- 4.Crossa J, DeLacy IH, Taba S. The Use of Multivariate Methods in Developing a Core Collection. In: Hodgkin T, Brown AHD, van Hintum TJL, et al., editors. Core Collections of Plant Genetic Resources. Chichester, UK: John Wiley and Sons; 1995. pp. 77–89. [Google Scholar]
- 5.Frankel OH. Genetic Perspectives of Germplasm Conservation. In: Arber W, Llimensee K, Peacock WJ, editors. Genetic Manipulation: Impact on Man and Society. UK: Cambridge University Press; 1984. pp. 161–170. [Google Scholar]
- 6.Hu J, Zhu J, Xu HM. Methods of constructing core collections by stepwise clustering with three sampling strategies based on the genotypic values of crops. Theoretical and Applied Genetics. 2000;101(1-2):264–268. doi: 10.1007/s001220051478. [DOI] [Google Scholar]
- 7.Kang CW, Kim SY, Lee SW, Mathur PN, Hodgkin T, Zhou MD, Lee RJ. Selection of a core collection of Korean sesame germplasm by a stepwise clustering method. Breeding Science. 2006;56(1):85–91. doi: 10.1270/jsbbs.56.85. [DOI] [Google Scholar]
- 8.Li CT, Shi CH, Wu JG, Xu HM, Zhang HZ, Ren YL. Methods of developing core collections based on the predicted genotypic value of rice (Oryza sativa L.) Theoretical and Applied Genetics. 2004;108(6):1172–1176. doi: 10.1007/s00122-003-1536-1. [DOI] [PubMed] [Google Scholar]
- 9.Malosetti M, Abadie T. Sampling strategy to develop a core collection of Uruguayan maize landraces based on morphological traits. Genetic Resources and Crop Evolution. 2001;48(4):381–390. doi: 10.1023/A:1012003611371. [DOI] [Google Scholar]
- 10.Mosjidis JA, Klingler KA. Genetic diversity in the core subset of the US red clover germplasm. Crop Science. 2006;46(2):758–762. doi: 10.2135/cropsci2005.05-0076. [DOI] [Google Scholar]
- 11.Okpul T, Singh D, Gunua T, Wagih ME. Assessment of diversity using agro-morphological traits for selecting a core sample of Papua New Guinea taro (Colocasia esculenta (L.) Schott) collection. Genetic Resources and Crop Evolution. 2004;51(6):671–678. doi: 10.1023/B:GRES.0000024656.41571.09. [DOI] [Google Scholar]
- 12.Qiu LJ, Cao YS, Chang RZ, Zhou XA, Wang GX, Sun JY, Xie H, Zhang B, Li XH, Xu ZY, et al. Establishment of Chinese soybean (G. max) core collection. I. Sampling strategy. Scientia Agricultura Sinica. 2003;36(12):1442–1449. (in Chinese) [Google Scholar]
- 13.Rodiño AP, Santalla M, Ron AMD, Singh SP. A core collection of common bean from the Iberian peninsula. Euphytica. 2003;131(2):165–175. doi: 10.1023/A:1023973309788. [DOI] [Google Scholar]
- 14.Tanksley SD, McCouch SR. Seed bank and molecular maps: unlocking genetic potential from the wild. Science. 1997;277(5329):1063–1066. doi: 10.1126/science.277.5329.1063. [DOI] [PubMed] [Google Scholar]
- 15.Upadhyaya HD, Ortiz R. A mini core subset for capturing diversity and promoting utilization of chickpea genetic resources in crop improvement. Theoretical and Applied Genetics. 2001;102(8):1292–1298. doi: 10.1007/s00122-001-0556-y. [DOI] [Google Scholar]
- 16.Upadhyaya HD, Gowda CLL, Pundir RPS, Reddy VG, Singh S. Development of core subset of finger millet germplasm using geographical origin and data on 14 quantitative traits. Genetic Resources and Crop Evolution. 2006;53(4):679–685. doi: 10.1007/s10722-004-3228-3. [DOI] [Google Scholar]
- 17.van Hintum TJL. Hierarchical Approaches to the Analysis of Genetic Diversity in Crop Plants. In: Hodgkin T, Brown AHD, van Hintum TJL, et al., editors. Core Collections of Plant Genetic Resources. Chichester, UK: John Wiley and Sons; 1995. pp. 23–34. [Google Scholar]
- 18.Volk GM, Richards CM, Reilley AA, Henk AD, Forsline PL, Aldwinckle HS. Ex situ conservation of vegetatively propagated species: development of a seed-based core collection for Malus sieversii . Journal of the American Society for Horticultural Science. 2005;130(2):203–210. [Google Scholar]
- 19.Wang JC, Hu J, Zhang CF, Zhang S. Assessment on evaluating parameters of rice core collections constructed by genotypic values and molecular marker information. Rice Science. 2007;14(2):101–110. doi: 10.1016/S1672-6308(07)60015-8. [DOI] [Google Scholar]
- 20.Wang JC, Hu J, Xu HM, Zhang S. A strategy on constructing core collections by least distance stepwise sampling. Theoretical and Applied Genetics. 2007;115(1):1–8. doi: 10.1007/s00122-007-0533-1. [DOI] [PubMed] [Google Scholar]
- 21.Xu HM, Mei YJ, Hu J, Zhu J, Gong P. Sampling a core collection of island cotton (Gossypium barbadense L.) based on the genotypic values of fiber traits. Genetic Resources and Crop Evolution. 2006;53(3):515–521. doi: 10.1007/s10722-004-2032-4. [DOI] [Google Scholar]
- 22.Yan WG, Ruter JN, Bryant RJ, Bockelman HE, Fjellstrom RG, Chen MH, Tai TH, McClung AM. Development and evaluation of a core subset of the USDA rice germplasm collection. Crop Science. 2007;47(2):869–876. [Google Scholar]
- 23.Yang WQ, Liu LT, Lin HZ. Multivariate Statistical Analysis. Beijing, China: Higher Education Press; 1989. pp. 208–209. (in Chinese) [Google Scholar]
- 24.Zewdie Y, Tong NK, Bosland P. Establishing a core collection of capsicum using a cluster analysis with enlightened selection of accessions. Genetic Resources and Crop Evolution. 2004;51(2):147–151. doi: 10.1023/B:GRES.0000020858.96226.38. [DOI] [Google Scholar]
- 25.Zhu J, Weir BS. Diallel analysis for sex-linked and maternal effects. Theoretical and Applied Genetics. 1996;92(1):1–9. doi: 10.1007/BF00222944. [DOI] [PubMed] [Google Scholar]


