Abstract
Lumbar spinal stenosis is a frequent indication for spinal surgery. The predictive quality of treadmill testing and MRI for diagnostic verification is not yet clearly defined. Aim of the current study was to assess correlations between treadmill testing and MRI findings in the lumbar spine. Twenty-five patients with lumbar spinal stenosis were prospectively examined. Treadmill tests were performed and the area of the dural sac and neuroforamina was examined with MRI for the narrowest spinal segment. VAS and ODI were used for clinical assessment. The median age of the patients was 67 years. In the narrowest spinal segment the median area of the dural sac was 91 mm2. The median ODI was 66 per cent. The median walking distance in the treadmill test was 70 m. The distance reached in the treadmill test correlated with the area of the dural sac (Spearman’s ρ = 0.53) and ODI (ρ = −0.51), but not with the area of the neuroforamina and VAS. The distance reached in the treadmill test predicts the grade of stenosis in MRI but has a limited diagnostic importance for the level of clinical symptoms in lumbar spinal stenosis.
Keywords: Spinal stenosis, Treadmill test, MRI, Spine, Spinal canal
Introduction
Although lumbar spinal stenosis is one of the most common reasons for spinal interventions [12] nowadays, its clinical and radiological signs leading to the indication for surgery have not been clearly defined [1, 14, 15, 27].
The difficulty in finding the diagnosis lies in the frequent absence of clinical symptoms at rest, while enormous pain and limited function are described under physical strain. Static examinations such as forced reclination, only insufficiently portray the situation under strain. The results of additional diagnostics on the basis of X-ray, CT, MRI, Myelography and Myelo-CT are not sufficiently predictive either [2, 17]. In contrast, treadmill tests simulate the normal physical strains in patients’ day-to-day lives. The individual exercise capacity under standard conditions can be determined and at the same time the clinical status of the dynamic situation can be recorded [3, 4, 24].
A possible reason for the symptoms of the lumbar spinal stenosis is the ischaemia of the nerve roots, which are compressed by the osseous, ligamentous or discal structures [10, 16]. Axial strain and lordosis of the lumbar spinal canal reduce the width of the spinal canal and therefore also the degree of compression [8, 24].
Our hypothesis was that straining the lumbar spine in the treadmill test, causes compression and complaints with consequent test interruption more frequently in patients with a small spinal canal than in patients with a wide one. To our knowledge this has been hardly investigated [17]. We wanted to determine whether there is an association between the MRI-measured spinal canal area, the recorded walking distance in the treadmill test and the subjective functional impairment of the lumbar spine (Oswestry Disability Index, ODI [6]; Visual Analogue Scale, VAS [28]). A previously published study showed the smallest area of the dural sac as a strong predictor of walking ability (18).
Methods
Between January and June 2006, 30 patients with lumbar spinal stenosis were recruited. They had been admitted for surgical treatment by means of decompression with or without stabilisation. We included patients with low back and/or leg pain, which increased when they were walking. We excluded patients who did not give informed written consent, had clinically manifest peripheral arterial disease, polyneuropathy or who had other musculoskeletal impairments compromising the ability to walk, like gonarthrosis, coxarthrosis and rheumatoid arthritis.
Five of thirty patients could not be evaluated, so that 25 patients remained for prospective registration and complete documentation. Two of the excluded patients could not undergo an MRI examination because of pacemaker and known claustrophobia, respectively. The treadmill test of two others was incorrectly documented. The fifth excluded patient’s Oswestry Disability Index had too many missing values.
When the patients were admitted for surgery, the walking distance until the onset of pain, weakness or disesthesia leading to test interruption, was recorded. Before performing the treadmill test, patients were asked how far they would expect to be able to walk. The clinical complaints were measured with ODI. The pain was graded with VAS independently of the localisation in the back or legs. The neurological and orthopaedic status of all patients was recorded. All patients showed a positive extension test [13].
A standardised ambulatory treadmill test [3] (Model “OLYMPIC”, Heinz Kettler GmbH and Co., PF 1020, D-59463 Ense-Parsit) with a speed of 0.5 m/s was conducted within 6 weeks before the patients were admitted. It was administered under standardised conditions by a physiotherapist well acquainted with the test. After the onset of spinal claudication symptoms, each patient decided when to end the test. The physiotherapist did not encourage or influence the patient in any way. The pain, its location and neurological deficits at the end of the test were recorded.
The patients underwent MRI examination about 6 weeks before admission (T2-weighted transversal layers of 4 mm thickness, Siemens Symphony 1.5 Tesla). During the examination the patient adopted a standardised dorsal position with hips and knees bent over a wedge.
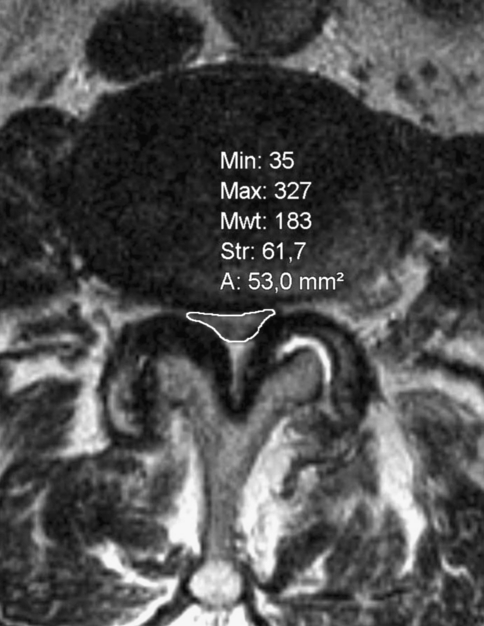
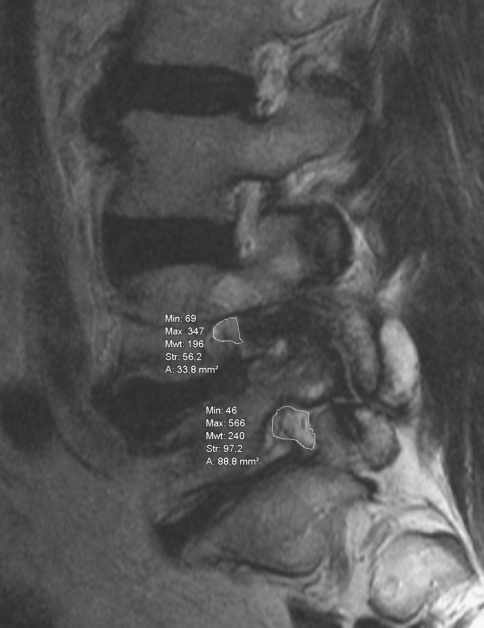
Using a picture archiving system (INOVIT, Radiology Software GmbH, Carl-Zeiss-Ring 13, D-85737 Ismaning) with integrated digital area measurement, the smallest neuroforaminal area and the smallest area of the dural sac were recorded by an experienced, independent orthopaedic examiner three times, and then the mean value of the three measurements was calculated. The smallest area was measured independently of the vertebral level or any anatomical structure (Figs. 1, 2). To determine this area, units per section were digitally calculated. Table 1 shows the number of affected segments and the rates of degenerative spondylolisthesis. While measuring, the gantry of the device was kept vertical to the virtual axis of the spinal canal. When measuring the neuroforaminal area, a slightly angular position of the sagittal plane to the axis of the foraminal exit could not be completely prevented, especially in cases with degenerative lumbar scoliosis.
Fig. 1.
Determination of the smallest area of the dural sac and the neuroforaminal area
Fig. 2.
Determination of the smallest area of the dural sac and the neuroforaminal area
Table 1.
Number of affected stenotic segments
| Level | L2/3 | L3/4 | L4/5 | L5/S1 |
|---|---|---|---|---|
| Number of segments with stenosis | 8 | 13 | 14 | 4 |
| Narrowest segments | 4 | 7 | 11 | 3 |
| Patients with deg. spondylolisthesis | 0 | 2 | 4 | 2 |
Spearman’s rho was used to calculate the correlations between the different measurements. Linear regressions were used to assess the relationship between distance walked on the treadmill and the smallest area of the dural sac and ODI, respectively. All statistical analyses were conducted using SAS 9.1 (SAS Institute Inc., Cary, NC).
Results
The median age of the 11 women and 14 men was 67 years (Interquartile range, IQR 60–72 years). Female median age was higher (69 years; IQR 62–73 years) than that of males (63.5 years; IQR 50–70 years). The median pain level of 7 on the VAS (IQR 6.5–8) and the ODI of 66 per cent (IQR 64–72) show the severity of the patients’ symptoms.
The median of the smallest dural cross sectional area (D-CSA) was 91 mm2 (IQR 67–135 mm2), the median of the smallest neuroforaminal cross sectional area (F-CSA) 43 mm2 (IQR 36–50). Thus, both measurements fulfil the radiological criteria of a lumbar spinal stenosis [22]. The median walking distances measured in the treadmill test was 70 m (IQR 30–130 m), the median patient expectation of walking distance 200 m (IQR 100–300 m).
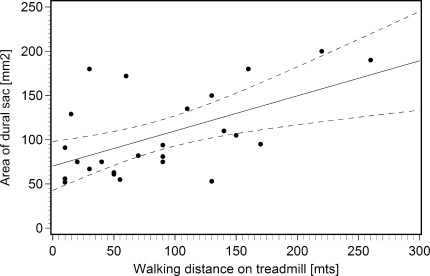
The D-CSA correlated with the measured walking distance (ρ = 0.53) and therefore confirmed the study hypothesis (Fig. 3), that a narrow spinal canal causes an earlier occurrence of the clinical complaints under physical stress. Linear regression analysis using D-CSA as the dependent variable revealed that an impairment of the walking distance of 50 m resulted in a reduction of the D-CSA of 19.8 mm2 (p = 0.003, R2 = 0.32).
Fig. 3.
Correlation between area of dural sac and measured walking distance in treadmill test, including regression line and 95% confidence intervals
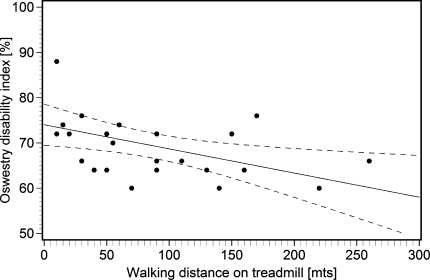
The measured walking distance in the treadmill test correlated with the impaired function (Fig. 4), as expressed by ODI score (ρ = −0.51). The results of the linear regression with ODI score as dependent variable showed that a reduction of walking distance of 50 m predicted a score increase of 2.7 per cent (p = 0.014, R2 = 0.24).
Fig. 4.
Correlation between impaired function and measured walking distance in treadmill test, including regression line and 95% confidence intervals
The D-CSA decreased with increasing age (ρ = −0.68). While the D-CSA was about 120 mm2 at the age of 60, it decreased by 30 mm2 per decade to 60 mm2 at the age of 80.
There was no relevant correlation between VAS and D-CSA (ρ = −0.08), or F-CSA (ρ = −0.11) and measured walking distance (ρ = −0.24) respectively.
There was a correlation between patient expectation of walking distance and measured walking distance (ρ = 0.62). The patients overestimated their possible walking distance by a factor of 3.
Discussion
Our study showed that the walking distance measured in the treadmill test correlates with the smallest dural sac area and the ODI. Also, the smallest dural sac area correlated with patient age.
The diagnosis of lumbar spinal stenosis is uncertain despite its high incidence. This because of its elusive symptoms and missing standards for the imaging analysis [11]. In particular, two-dimensional parameters in X-ray, CT, MRI, myelography or Myelo-CT do not allow conclusions about the severity of a stenosis [1, 2]. In the section diagram method, a D-CSA under 100 mm2 is considered pathological [22], whereas critical pressure peaks leading to nerve root ischaemia in the dural sac may be reached at a D-SCA of less than 75 mm2 [21].
Assessing a pathological threshold value for the spinal section is a problem [7]. Though no ethnical or height-related differences are known [8], physiological variations exist depending on level and height of the measured segment. There is a great interobserver variability in the measurement of the areas [23]. In the MRI, aberrance of the section plane from the ideal plane vertical to the spinal canal leads to measurement errors. In our study, this error was minimised by carefully following the ideal plane and by calculating the mean value of three measurements. The dimensions of the spinal canal strongly depend on the position: Standing or a forced lordosis to simulate the strain of an upright position reduced the spinal section by about 10% [8, 26]
Beside the relatively small sample size, a methodological problem of the current study is the missing observation of the stenosis formation and progression. Animal experiments show a greater nerve root damage with steeper pressure waves [19]. The close correlation between patient age and the measured dural sac area suggests that the slower the stenosis develops the later it becomes symptomatic.
To our knowledge, the influence of a multi-segmental stenosis on the clinical symptoms and walking distance has not yet been described in the literature and were therefore not included in our study. In animal experiments, bisegmental stenosis caused nerve root ischaemia at pressures of only 10 mmHg [25].
Due to the uncertainties of imaging and the clinical examination of the lumbar spinal stenosis, the walking distance is highly relevant in stenosis scores [6, 20]. While being replicable, the objectified walking distance with the treadmill test showed an imprecise self-estimation [29] by the patients and also little correlation with imaging [9, 17]. In addition to known measurement inaccuracies, several reasons may lead to the lack of correlation: The inclusion of two-dimensional radiological measurements and the evaluation of small patient groups with consequent low statistical power. The small number of patients in our group may also have prevented significant correlation between D-CSA and walking distance on the one hand, and the acute pain (VAS) on the other hand.
The treadmill test helps objectifying pre- and postsurgical clinical complaints and verifying a lumbar spinal stenosis by creating a situation of dynamic strain. Assessment of orthopaedic and neurological status by an independent examiner at the end of the test delivers additional diagnostic certainty.
Moreover, the treadmill test lets the patient experience his own physical limits. For instance, taller patients experienced the standardised velocity as rather too slow, whereas smaller patients experienced it as rather too fast. In addition, the treadmill test enables the examiner to attain a replicable postoperative assessment [5].
Conclusions
The treadmill test attains a high diagnostic value concerning lumbar spinal stenosis which is detectable in the MRI, but is only of limited value in judging the current symptoms.
As a conclusion of our results, we conduct the treadmill test with all patients with apparent or suspected lumbar spinal stenosis at our hospital.
References
- 1.Amundsen T, Weber H, Lilleas F, Nordal HJ, Abdelnoor M, Magnaes B. Lumbar spinal stenosis. Clinical and radiologic features. Spine. 1995;20(10):1178–1186. doi: 10.1097/00007632-199505150-00013. [DOI] [PubMed] [Google Scholar]
- 2.Bolender NF, Schonstrom NS, Spengler DM. Role of computed tomography and myelography in the diagnosis of central spinal stenosis. J Bone Joint Surg Am. 1985;67(2):240–246. [PubMed] [Google Scholar]
- 3.Deen HG, Jr, Zimmerman RS, Lyons MK, McPhee MC, Verheijde JL, Lemens SM. Measurement of exercise tolerance on the treadmill in patients with symptomatic lumbar spinal stenosis: a useful indicator of functional status and surgical outcome. J Neurosurg. 1995;83(1):27–30. doi: 10.3171/jns.1995.83.1.0027. [DOI] [PubMed] [Google Scholar]
- 4.Deen HG, Jr, Zimmerman RS, Lyons MK, McPhee MC, Verheijde JL, Lemens SM. Test-retest reproducibility of the exercise treadmill examination in lumbar spinal stenosis. Mayo Clin Proc. 2000;75(10):1002–1007. doi: 10.4065/75.10.1002. [DOI] [PubMed] [Google Scholar]
- 5.Deen HG, Zimmerman RS, Lyons MK, McPhee MC, Verheijde JL, Lemens SM. Use of the exercise treadmill to measure baseline functional status and surgical outcome in patients with severe lumbar spinal stenosis. Spine. 1998;23(2):244–248. doi: 10.1097/00007632-199801150-00019. [DOI] [PubMed] [Google Scholar]
- 6.Fairbank JC, Couper J, Davies JB, O’Brien JP. The Oswestry low back pain disability questionnaire. Physiotherapy. 1980;66(8):271–273. [PubMed] [Google Scholar]
- 7.Gouzien P, Cazalbou C, Boyer B, Darodes Tailly P, Guenec Y, Senecail B. Measurements of the normal lumbar spinal canal by computed tomography. Segmental study of L3-L4 and L4-L5 related to the height of the subject. Surg Radiol Anat. 1990;12(2):143–148. doi: 10.1007/BF01623341. [DOI] [PubMed] [Google Scholar]
- 8.Hamanashi C, Matukura N, Fujita M, Tomihara M, Tanaka S. Cross-sectional area of the stenotic lumbar dural tube measured from the transverse views of magnetic resonance imaging. J Spinal Disord. 1994;7(5):388–393. [PubMed] [Google Scholar]
- 9.Herno A, Airaksinen O, Saari T. Computed tomography after laminectomy for lumbar spinal stenosis. Patients’ pain patterns, walking capacity, and subjective disability had no correlation with computed tomography findings. Spine. 1994;19(17):1975–1978. doi: 10.1097/00007632-199409000-00019. [DOI] [PubMed] [Google Scholar]
- 10.Hida S, Naito M, Kubo M. Intraoperative measurements of nerve root blood flow during discectomy for lumbar disc herniation. Spine. 2003;28(1):85–90. doi: 10.1097/00007632-200301010-00020. [DOI] [PubMed] [Google Scholar]
- 11.Hildebrandt J, Müller G, Pfingsten M. Lendenwirbelsäule: Ursachen, Diagnostik und Therapie von Rückenschmerzen. 1. Auflage: Elsevier, Urban und Fischer; 2005. [Google Scholar]
- 12.Katz JN. Lumbar spinal fusion. Surgical rates, costs, and complications. Spine. 1995;20(24 Suppl):78S–83S. doi: 10.1097/00007632-199512151-00002. [DOI] [PubMed] [Google Scholar]
- 13.Katz JN, Dalgas M, Stucki G, Katz NP, Bayley J, Fossel AH, Chang LC, Lipson SJ. Degenerative lumbar spinal stenosis. Diagnostic value of the history and physical examination. Arthritis Rheum. 1995;38(9):1236–1241. doi: 10.1002/art.1780380910. [DOI] [PubMed] [Google Scholar]
- 14.Katz JN, Dalgas M, Stucki G, Lipson SJ. Diagnosis of lumbar spinal stenosis. Rheum Dis Clin North Am. 1994;20(2):471–483. [PubMed] [Google Scholar]
- 15.Kent DL, Haynor DR, Larson EB, Deyo RA. Diagnosis of lumbar spinal stenosis in adults: a metaanalysis of the accuracy of CT, MR, and myelography. AJR Am J Roentgenol. 1992;158(5):1135–1144. doi: 10.2214/ajr.158.5.1533084. [DOI] [PubMed] [Google Scholar]
- 16.Kobayashi S, Uchida K, Takeno K, Baba H, Suzuki Y, Hayakawa K, Yoshizawa H. Imaging of cauda equina edema in lumbar canal stenosis by using gadolinium-enhanced MR imaging: experimental constriction injury. AJNR Am J Neuroradiol. 2006;27(2):346–353. [PMC free article] [PubMed] [Google Scholar]
- 17.Moon ES, Kim HS, Park JO, Shin DE, Ha JW, Shim DJ, Kwak YH, Lee KI. Comparison of the predictive value of myelography, computed tomography and MRI on the treadmill test in lumbar spinal stenosis. Yonsei Med J. 2005;46(6):806–811. doi: 10.3349/ymj.2005.46.6.806. [DOI] [PMC free article] [PubMed] [Google Scholar]
- 18.Ogikubo K, Forsberg L, Hansson T. The relationship between the cross-sectional area of the cauda equina and the preoperative symptoms in central lumbar spinal stenosis. Spine. 2007;32(13):1423–1428. doi: 10.1097/BRS.0b013e318060a5f5. [DOI] [PubMed] [Google Scholar]
- 19.Olmarker K, Holm S, Rydevik B. Importance of compression onset rate for the degree of impairment of impulse propagation in experimental compression injury of the porcine cauda equina. Spine. 1990;15(5):416–419. doi: 10.1097/00007632-199005000-00013. [DOI] [PubMed] [Google Scholar]
- 20.Pratt RK, Fairbank JC, Virr A. The reliability of the Shuttle Walking Test, the Swiss Spinal Stenosis Questionnaire, the Oxford Spinal Stenosis Score, and the Oswestry Disability Index in the assessment of patients with lumbar spinal stenosis. Spine. 2002;27(1):84–91. doi: 10.1097/00007632-200201010-00020. [DOI] [PubMed] [Google Scholar]
- 21.Schonstrom N, Hansson T. Pressure changes following constriction of the cauda equina. An experimental study in situ. Spine. 1988;13(4):385–388. doi: 10.1097/00007632-198804000-00001. [DOI] [PubMed] [Google Scholar]
- 22.Schonstrom NS, Bolender NF, Spengler DM. The pathomorphology of spinal stenosis as seen on CT scans of the lumbar spine. Spine. 1985;10(9):806–811. doi: 10.1097/00007632-198511000-00005. [DOI] [PubMed] [Google Scholar]
- 23.Speciale AC, Pietrobon R, Urban CW, Richardson WJ, Helms CA, Major N, Enterline D, Hey L, Haglund M, Turner DA. Observer variability in assessing lumbar spinal stenosis severity on magnetic resonance imaging and its relation to cross-sectional spinal canal area. Spine. 2002;27(10):1082–1086. doi: 10.1097/00007632-200205150-00014. [DOI] [PubMed] [Google Scholar]
- 24.Takahashi K, Kagechika K, Takino T, Matsui T, Miyazaki T, Shima I. Changes in epidural pressure during walking in patients with lumbar spinal stenosis. Spine. 1995;20(24):2746–2749. doi: 10.1097/00007632-199512150-00017. [DOI] [PubMed] [Google Scholar]
- 25.Takahashi K, Olmarker K, Holm S, Porter RW, Rydevik B. Double-level cauda equina compression: an experimental study with continuous monitoring of intraneural blood flow in the porcine cauda equina. J Orthop Res. 1993;11(1):104–109. doi: 10.1002/jor.1100110112. [DOI] [PubMed] [Google Scholar]
- 26.Willen J, Danielson B, Gaulitz A, Niklason T, Schonstrom N, Hansson T. Dynamic effects on the lumbar spinal canal: axially loaded CT-myelography and MRI in patients with sciatica and/or neurogenic claudication. Spine. 1997;22(24):2968–2976. doi: 10.1097/00007632-199712150-00021. [DOI] [PubMed] [Google Scholar]
- 27.Yukawa Y, Lenke LG, Tenhula J, Bridwell KH, Riew KD, Blanke K. A comprehensive study of patients with surgically treated lumbar spinal stenosis with neurogenic claudication. J Bone Joint Surg Am. 2002;84-A(11):1954–1959. doi: 10.2106/00004623-200211000-00008. [DOI] [PubMed] [Google Scholar]
- 28.Zanoli G, Stromqvist B, Jonsson B. Visual analog scales for interpretation of back and leg pain intensity in patients operated for degenerative lumbar spine disorders. Spine. 2001;26(21):2375–2380. doi: 10.1097/00007632-200111010-00015. [DOI] [PubMed] [Google Scholar]
- 29.Zeifang F, Abel R, Schiltenwolf M. Possible conservative treatment methods for patients with spinal claudication. Orthopade. 2003;32(10):906–910. doi: 10.1007/s00132-003-0567-2. [DOI] [PubMed] [Google Scholar]


