Abstract
The aim of this work was to develop a low-cost automated system to measure the three-dimensional shape of the back in patients with scoliosis. The resulting system uses structured light to illuminate a patient’s back from an angle while a digital photograph is taken. The height of the surface is calculated using Fourier transform profilometry with an accuracy of ±1 mm. The surface is related to body axes using bony landmarks on the back that have been palpated and marked with small coloured stickers prior to photographing. Clinical parameters are calculated automatically and presented to the user on a monitor and as a printed report. All data are stored in a database. The database can be interrogated and successive measurements plotted for monitoring the deformity changes. The system developed uses inexpensive hardware and open source software. Accurate surface topography can help the clinician to measure spinal deformity at baseline and monitor changes over time. It can help the patients and their families to assess deformity. Above all it reduces the dependence on serial radiography and reduces radiation exposure when monitoring spinal deformity.
Keywords: Scoliosis, Back shape, Surface topography, Non-invasive monitoring
Introduction
Scoliosis is an abnormal lateral curvature of the spine, generally first noticed as a change in the shape of the back. The curvature usually results in axial vertebral rotation which produces an asymmetric rib hump on the back.
The traditional method for assessing scoliosis is the Cobb angle [8]. A radiograph of the spine is made in the coronal plane and the angle of any spinal curve is measured. This has a number of disadvantages. First, over a period of years, the patient will be exposed to a large dose of radiation, especially in early onset curves. There is evidence that this may increase the risk of developing breast cancer [17, 19]. Second, it has been increasingly recognised that cosmetic factors such as rib hump play a large part in the requirement for treatment [27]. The size of the rib hump is often more important to the patient than the radiological position of the spine and yet is not measured in standard radiographs. Third, there is considerable variability in the measurement of Cobb angle itself, inter-rater variability ranging from 5° to 10° [2, 23]. The availability of low-cost, radiation-free equipment to measure back topography is therefore a key element for decision making by both surgeon and patient.
Much work has been done on measuring the surface of the back for assessing the degree of deformity in scoliosis patients. Methods range from tactile measurements such as the scoliometer [7] and the spinal rotation meter [21] to optical methods such as moiré topography [1, 13] and structured light techniques, the most well known being ISIS (Integrated Shape Imaging System) [28], Quantec [12, 14, 20] and Jenoptik Formetric [9–11]. All were successfully applied to the monitoring of scoliosis and are still in use at some clinics, but they were no longer being actively marketed in the UK at the time this work began. There have also been considerable advances in computer technology and digital photography since these older systems were developed. Our aim was therefore to develop a new low-cost automated system, preferably using off-the-shelf components, where the developed software would be freely available to all.
This paper describes a structured light system for determining the degree of deformity in patients with scoliosis, monitoring the progress of their condition and assessing the effectiveness of any treatment given. The new system bases much of its clinically relevant measures on the work of Turner-Smith et al. in the 1980s [28–33] for the original ISIS; it has therefore been named ISIS2.
Materials and methods
Theory
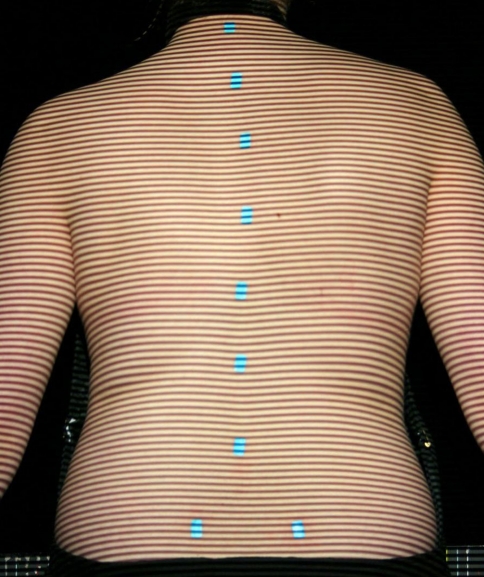
A pattern of parallel fringes projected onto a three-dimensional object is distorted by the object’s shape. This distortion contains information about the distance (height) of the surface of the object away from a flat reference plane. When an image of such an object is acquired by a digital camera, the pixel locations of the object give its x and y dimensions and the phase of the fringe pattern at each pixel contains the height information perpendicular to the plane of the image (Fig. 1). The problem of finding the height distribution therefore reduces to one of finding the fringe phase distribution over the object. The method used here for calculating the phase distribution is Fourier transform profilometry (FTP).
Fig. 1.
Example of patient image with fringes projected onto the back; landmark markers can be seen
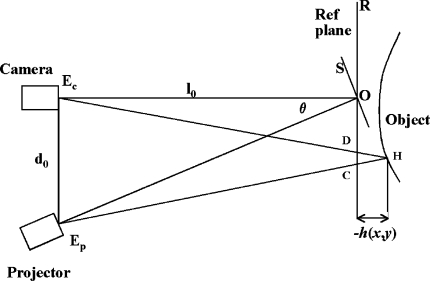
The system uses the crossed-optical-axis geometry as shown in Fig. 2. The optical axes of the camera and the fringe projector cross at point O on the reference plane R, from which the height h(x,y) of the object surface is measured. The camera and projector are at distance l0 from the reference plane and separated from each other by distance d0.
Fig. 2.
Crossed-optical-axis geometry used in ISIS2; the symbols are explained in the text
The height distribution can be expressed as a function of phase [25]:
 |
1 |
where f0 is the spatial carrier fringe frequency and
 is the phase shift caused by the object.
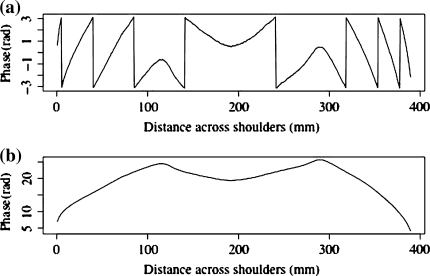
Details of the fundamental concepts of FTP can be found elsewhere [18, 24, 25]. Briefly, each column of data from the patient and the reference plane images is Fourier transformed, resulting in a spatial frequency function. The spatial frequency data are filtered to retain the frequencies around the fringe frequency and eliminate all higher harmonics and the zero peak. Optimal choice of windowing before the FFT and in the frequency domain was established in earlier work [3, 5]. The filtered patient and reference plane data are then inverse Fourier transformed back to the spatial domain and combined to obtain the phase data. Because phase is calculated from a tangent function which is multi-valued, all the phase values lie between +π and −π; discontinuities occur at the points where the function flips from the minimum to the maximum or vice versa, as shown in Fig. 3. This type of function is termed ‘wrapped’. Unwrapping consists of detecting the discontinuities and adding or subtracting 2π according to the sign of the phase change. In this application, unwrapping is done from the centre of the back outwards. The unwrapped phase values are then converted to height using Eq. 1. The problem of unwrapping in FTP is the equivalent of the registration of fringes in the ISIS, Quantec and Formetric systems. The big advantage of FTP, however, is that no interpolation between the locations of the fringes is needed because there is a phase value (and thus height also) for every pixel.
Fig. 3.
Example of phase unwrapping process; a Wrapped phase; b Unwrapped phase
Mechanical design
The mechanical part of the system consists of a camera/projector stand and a patient stand. The projector is mounted directly above the camera and projects a horizontal fringe pattern onto the patient’s back. The camera/projector arrangement is mounted on a telescopic actuator which allows the camera to be centred on the patient’s back regardless of patient height.
The patient stand is used to help minimise postural variations and provide the reference plane. It is a black tubular framework with adjustable crossbar, arm rests and footplate. The patient stands with the inner sides of the feet against the positioning blocks of the footplate so that the feet are directly below the anterior superior iliac spines. The use of the footplate has been found to improve the repeatability of lateral asymmetry measurements with the old ISIS system [6]. During measurement, the patient’s abdomen rests lightly against the crossbar at the height of the pelvis, with the arms supported on the arm rests away from the patient’s sides.
A black curtain hangs behind the frame so that the patient is silhouetted against a black background. This was found to be the optimum method of eliminating unwanted data outside the back.
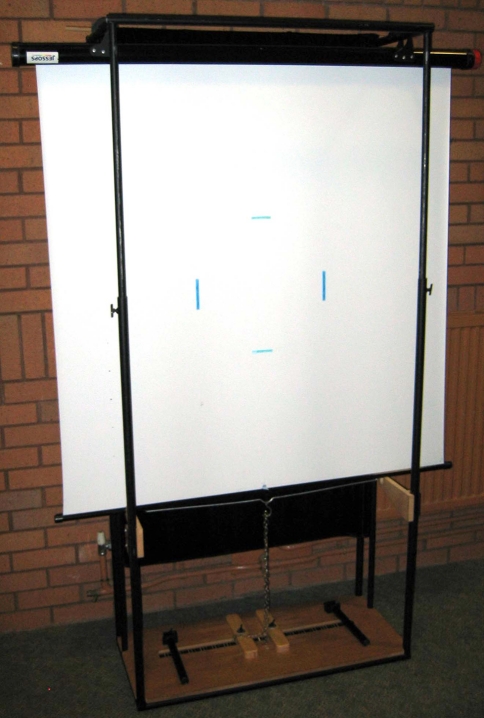
The reference plane is a retractable screen that is mounted above the patient’s head, along the top of the frame. During reference plane measurements the screen is pulled down (Fig. 4).
Fig. 4.
Patient stand with reference plane (screen); calibration markers can also be seen
Calibration
The distance between the camera imaging plane and the reference plane is 2,000 mm; the distance between the camera and projector is 500 mm. These distances are used in the analysis software in the conversion from phase to height. The reference plane has two parallel turquoise blue vertical lines drawn on it (Fig. 4). The positions of the mid-pixels of these two lines are detected and used to calculate the pixel size, typically around 0.5 mm by 0.5 mm. Most pixels of interest are, of course, not on the reference plane, but at various distances from the reference plane on the surface of the back (the reference plane falls approximately through the centre of the body). The true area covered by each pixel will decrease as the back height at that pixel increases. This effect generally leads to surface expansion in the plane of the image where pixels are assumed to be slightly bigger than they really are. The calculated height of the back is not affected by this error but the error does influence clinical parameters such as back length and angles, which use the pixel sizes. However, the errors in accepting a constant pixel size independent of pixel distance from the reference plane are approximately the same for every measurement; it is changes between measurements that are clinically important.
A vertical section from the centre of the central column of the reference plane photograph with fringes is used to calculate the fringe frequency. The error in the fringe frequency is estimated to be ±0.00032 fringes/mm and the fringe frequency is typically 0.16−0.19 fringes/mm, an error of ∼0.2% [3].
Previous work has shown that this level of accuracy in alignment and calibration means that the height of the back can be measured to ±1 mm [3]. This is found to be acceptable given the variation that will occur on the back during breathing and changes in posture.
Body landmarks and axes system
Turquoise stickers are used to mark bony landmarks on the patient’s back. This colour does not interfere with the calculation of the three-dimensional back surface and yet allows the locations of the markers to be detected. The stickers can always be detected regardless of skin colour (an improvement on the old ISIS system which experienced problems with darker skin colours).
The stickers are ∼9 × 15 mm2 and are used with the longer axis in the vertical direction. They are placed on the vertebra prominens, the lumbar dimples just below the posterior superior iliac spines and a number of spinous processes down the length of the spine, typically seven to twelve markers in total. More markers are used when there is more severe scoliotic deformity. The system detects the stickers automatically and does not need to be told how many are in situ.
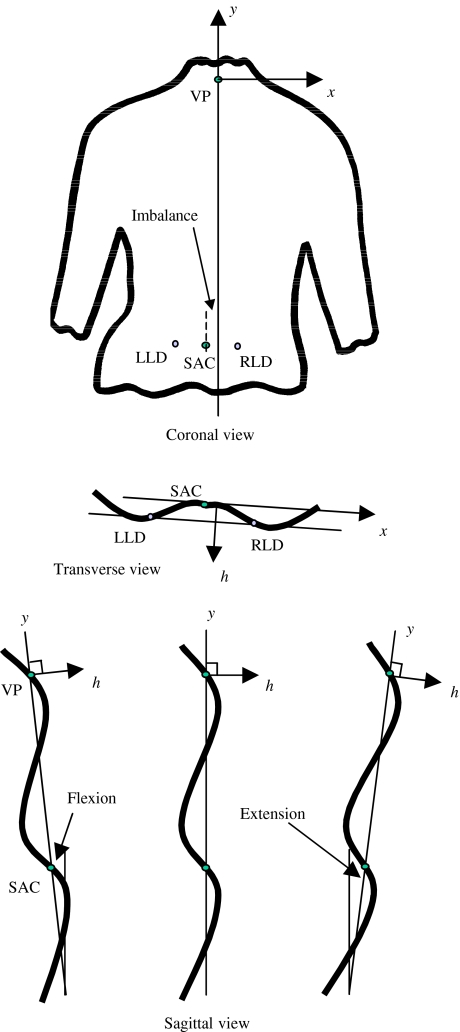
The (x,y) locations of the markers are determined by image processing. The height value for each (x,y) location is known from the surface height map. Thus, the three-dimensional positions of the bony landmarks on the surface of the back are known. The sacrum is assumed to lie midway between the lumbar dimples. The locations of the vertebra prominens and the lumbar dimples are used to transform the surface so that all data points are related to body axes rather than camera/reference plane axes. The back surface is rotated so that the two dimple markers lie at an equal height from the reference plane. The surface is then tilted so that the vertebra prominens lies directly above a line through the sacrum parallel to the line through the two lumbar dimples (Fig. 5). The x-axis is horizontal and lies parallel to the line between the two lumbar dimples in the transverse plane, positive to the right. The y-axis runs vertically in the coronal plane, positive upwards; in the sagittal plane the y-axis may be at a small angle to the vertical if there is extension or flexion in the stance of the patient. The h-axis is normal to the x-y plane and positive outwards from the back. The h = 0 plane includes both the vertebra prominens and the sacrum.
Fig. 5.
Body axes system; VP is vertebra prominens, SAC is sacrum, LLD is left lumbar dimple, RLD is right lumbar dimple
For the measurements, the patient has to remove the clothing from the upper body so that the back is exposed from the neck to the pelvis. Hair may need to be tied up. A black neckband and apron are worn to provide limits for the automatic cropping of the photograph. The lighting in the room is lowered during measurements.
Hardware and software design
The electronic hardware for the system consists of a telescopic actuator (Schumo, Affoltern am Albis, Switzerland) for adjusting camera/projector height, a standard 35 mm projector with a horizontal 100 lines per inch Ronchi grating (Edmund Optics, York, UK) and a digital camera (Canon, Reigate, UK). Once the hardware is switched on, all operator interaction with the system is carried out using a user interface running in SuperCard (Solutions Etcetera, Pollock Pines, USA) on an Apple Macintosh (Apple, Cupertino, USA) computer.
The user interface leads the user through the measurement procedure, from recording the patient details and taking the photographs to carrying out the analysis, displaying the clinical results and transferring the data to the FileMaker database (FileMaker, Santa Clara, CA, USA). Many checks are built in to the interface to ensure valid data. All data analysis is carried out in R [22]. Clinical reports in PDF format are generated from the R output using LaTeX [15].
Presentation of clinical parameters in ISIS2
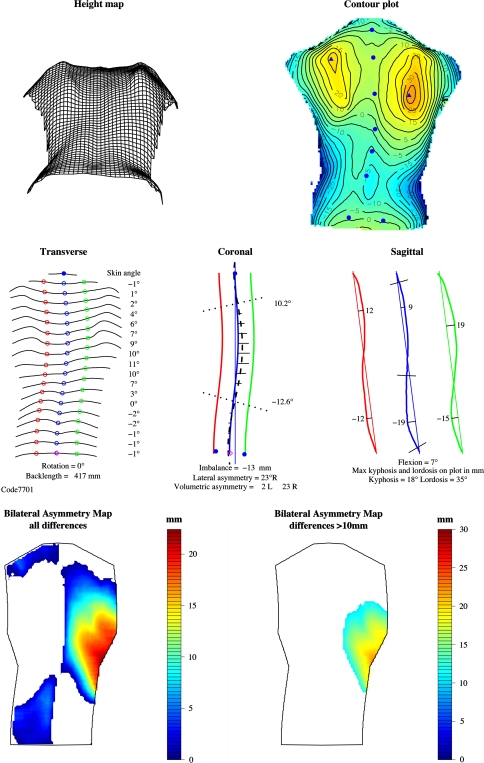
The printed report is based on the old ISIS report which has been shown to be clinically valuable [16, 34]. The report (Fig. 6) comprises the following components.
Fig. 6.
Example of ISIS2 report
Header (as ISIS)
This gives the date and time of measurement, the patient’s name, date of birth, sex and hospital/NHS identity number.
Height map (new)
This shows a wire-frame plot, giving an impression of the three-dimensional shape of the back. The back is viewed from below so that any rib humps are exaggerated.
Contour plot (new)
This plot represents the shape using contour lines and colour (blue lowest to red highest). The numbers on the contours are in mm, plotted every 5 mm. The marker locations (solid blue circles) and the most prominent points on the two shoulder blade areas (solid blue triangles) are indicated.
Transverse (modified from ISIS)
The shape of the transverse section at 19 equally spaced levels from the vertebra prominens to the sacrum is shown (compared with ten levels in ISIS). The rotation angle, back length and the skin angle at each section are also shown. The open blue circles indicate the location of the spine at each level. A solid blue circle indicates the vertebra prominens; a magenta diamond indicates the sacrum. The green and red circles are on the paramedian lines at 10% of the back length to the right and left of the spine. The skin angles are measured between the paramedian points at each level, i.e. over a width of 0.2*back length. The skin angle is positive when the right side is higher. The back length, rotation, maximum skin angle and minimum skin angle numerical parameters are stored in the database for longitudinal monitoring.
Coronal (as ISIS)
This plot shows a fifth order polynomial curve fitted through the spinous process markers (thick blue curve) and similar curves at the paramedian locations to the right (green) and left (red). A fine blue line is dropped vertically from the vertebra prominens (gravity line). The horizontal distance between this line and the sacrum gives a measure of the imbalance; its value is printed at the bottom of the plot. Imbalance is positive when the sacrum lies to the right of the vertical through the vertebra prominens. The heavy dashed black curve is calculated from the spinous processes curve and the skin angle at each transverse location (19 levels between vertebra prominens and sacrum); it gives an estimate of the line through the centres of the vertebrae following the ISIS methodology [31]. The angles of the perpendiculars to the points of inflection on this curve are calculated and used to compute the lateral asymmetry [simulated Cobb angle(s)]. The vertebra prominens and the lumbar dimples are shown as solid blue circles; the sacrum is a magenta diamond. The horizontal black lines give an indication of the difference in volume between the two sides of the back at each transverse level. These volumetric differences are normalised, summed and printed below the plot. The imbalance, lateral asymmetry and volumetric asymmetry numerical parameters are stored in the database for longitudinal monitoring. There may be one or two lateral asymmetry values, depending on whether a single or double curve has been found. Lateral asymmetry is the ISIS2 measure of coronal spinal curvature and is similar (but not identical) to radiographic Cobb angle.
Sagittal profile (modified from ISIS)
The sagittal sections through the vertebra prominens and paramedian locations to the right and left are shown. The straight line from the vertebra prominens to sacrum is presented at the angle of flexion/extension (as opposed to vertical in the old ISIS report). This makes the stance of the patient immediately obvious to the user without needing to read the value for flexion/extension printed below the curves. The location and magnitude of the maximum kyphosis and lordosis are shown on the curves in mm. The kyphosis and lordosis angles are also presented below the curves. The numerical values for flexion, maximum kyphosis and lordosis in mm, and kyphosis and lordosis angles in degrees are stored in the database for longitudinal monitoring.
Bilateral asymmetry maps (new)
These maps present the volumetric differences between the sides of the back. The left plot shows all differences between the two sides. If a part of the back is white it means that the other side is higher at that location. The differences are not normalised so that a smaller patient may well have smaller differences and yet have a worse curve. Normalisation is planned but more patient data are needed first. The right-hand plot shows only the differences >10 mm. Straight backs should show minimal colour in this plot and scoliotic backs should show more colour the worse the deformation is. Further data are needed to establish the usefulness of these bilateral asymmetry plots to the clinician.
Longitudinal monitoring plots (new)
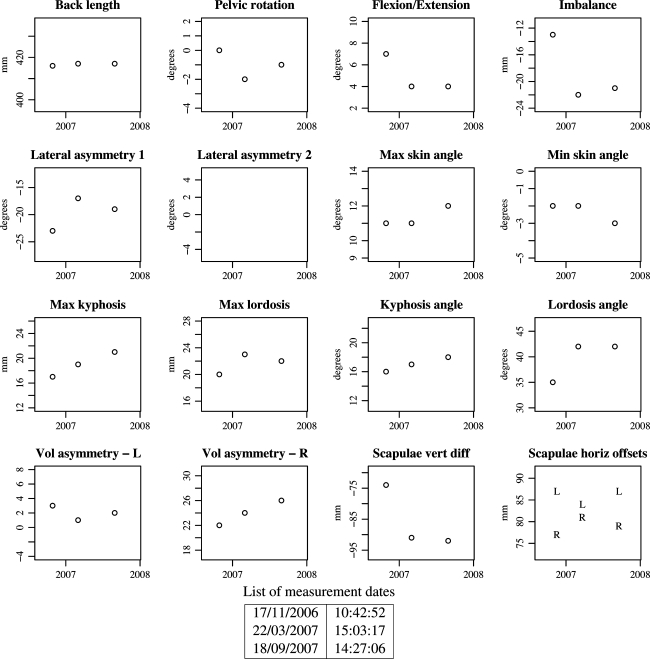
After two or more measurements have been stored for a patient, the numerical parameters can be plotted against time (Fig. 7). In this way, changes in the shape of the back can easily be monitored. Regular measurements of patients in the clinic have only been carried out over the last 12 months and so few patients have more than two sets of data for the monitoring plot. The example shown in Fig. 7 is from a patient with adolescent idiopathic scoliosis who is being monitored at 6-monthly intervals.
Fig. 7.
Example of clinical parameter monitoring plots
Results
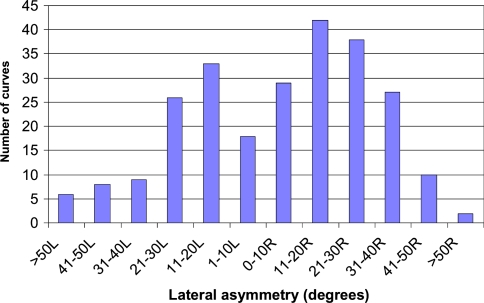
The system is now in regular use in the Nuffield Orthopaedic Centre. The radiographers find it easy to use and quick to carry out the surface topography measurements. A total of 168 patients (142 females, 26 males) have been measured, 28 of them on two occasions and 2 on three occasions (a total of 198 measurements). The mean age of the patients was 15.25 years (range 5.92–47.33). The lateral asymmetry clinical parameter (comparable with Cobb angle) ranged from 75° to the right to 78° to the left. The distribution of lateral curves is shown in Fig. 8.
Fig. 8.
Distribution of lateral asymmetry curves for the first 168 patients
A typical standard set of results for one patient is shown in Fig. 6 and a longitudinal monitoring plot for the same patient is shown in Fig. 7. These figures are the results that would be printed by the system.
Discussion
The new system, ISIS2, only requires the patient to stand still for the camera shutter time, typically 100 ms, a considerable improvement over the original ISIS scanner (∼2 s). This minimises problems with patient movement during the data acquisition time; this is especially important for younger patients. The time needed to analyse the photograph is also much shorter than previously (about 40 s compared to about 10 min for ISIS). The printing of the report takes a further minute but the operator may continue to work with the system while the printing is taking place. A patient can easily be measured in 10 min, including patient changing time and marking of the bony landmarks.
The transformation of the surface of the back to a body axes system rather than the laboratory system contributes to the reduced variability in parameters measured with ISIS2 compared to Quantec. At least one user of Quantec reports needing to average four measurements [12] to bring the variability in its parameters down to a reasonable level, presumably because patient stance and alignment to the laboratory axes is not taken into account.
Another advantage of ISIS2 over ISIS, Quantec and Formetric is that it requires no interpolation to get height data for every 0.5 × 0.5 mm2 pixel. ISIS, Quantec and Formetric all use interpolation.
Formetric does not use any body markers but utilises shape information to detect the positions of the vertebra prominens, the PSIS points and the spine line. Our experience has suggested that the PSIS points and some spinous markers are more easily found by palpation than automatically. However, this does have the disadvantage that an experienced operator is needed.
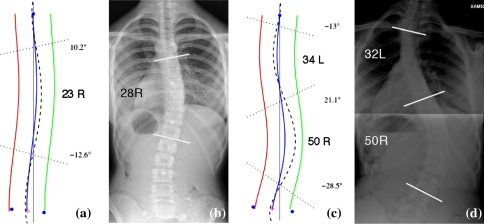
Lateral asymmetry is the parameter that is most likely to be of importance to spinal surgeons because of their familiarity with Cobb angle. Radiographs of two patients are shown in Fig. 9 along with their coronal curves measured with ISIS2. As can be seen from Fig. 9, there is good comparison between the ISIS2 estimate and the radiographic Cobb estimate for both these patients. However, this is not always the case for all patients. Our research to date indicates that there is good correlation (r = 0.84) between lateral asymmetry and Cobb angle but that a prediction of Cobb from lateral asymmetry is within 10° of the measured radiographic value in ∼80% of patients [4]. It must be borne in mind, however, that the variability in the measurement of Cobb angle itself is considerable, inter-rater variability ranging from 5° to 10° [2, 23]. The relationship between ISIS2 lateral asymmetry and radiographic Cobb angle will be limited for patients who are extremely obese or have heavy musculature because identifying the bony landmarks for marking will be more difficult. There will also be a limitation for patients with congenital curves that carry little rotation.
Fig. 9.
Comparison of ISIS2 coronal curve estimates with radiographic measurement; a Patient 1 ISIS2 lateral asymmetry; b Patient 1 radiographic Cobb angle; c Patient 2 ISIS2 lateral asymmetry; d Patient 2 radiographic Cobb angle
The purpose of the radiographic measurement is to monitor change in deformity. Even if lateral asymmetry cannot be used for the calculation of radiographic Cobb directly for all patients, it may very well be useful for monitoring the change in deformity. Further investigation into monitoring deformity with lateral asymmetry and into the differences between lateral asymmetry and Cobb angle is part of current research.
The new system provides additional data to simple radiographic examination, describing the surface of the back itself. Previous work on the old ISIS system showed that the rib hump may progress before the Cobb angle [26]. Further investigation of rib hump changes is also part of current research and is of clinical relevance.
Another advantage of the new system is that it has an easy means of monitoring changes in the shape of the back with its longitudinal monitoring plots, something which has not been available automatically from any past systems. Recently a new Formetric system which allows monitoring has been marketed but this was not available when this work began and is considerably more expensive than our system.
Our software is freely available under a standard open source licence. However, the hardware does need to be purchased. Advice on the hardware required is available from the authors on request.
Conclusions
A low-cost system has been developed to measure the three-dimensional shape of the back in patients with scoliosis to an accuracy of ±1 mm. Radiographers find the system quick and easy to use. The photographs of the patients and all clinical results are stored in a database and can be recalled at subsequent patient visits to allow automated monitoring of changes in the deformity. The system provides a consistent database for research purposes.
Acknowledgments
This work was supported by the ROH Orthopaedic Charity, Research and Teaching Centre, Royal Orthopaedic Hospital, Birmingham, UK. The work complies with the laws of the United Kingdom and has been approved by the Research Committee and the Chair of the Ethics Committee of the Royal Orthopaedic Hospital, Birmingham, UK. All patients gave their informed consent prior to their inclusion in the study.
References
- 1.Adair I, VanWijk M, Armstrong G. Moiré topography in scoliosis screening. Clin Orthop Relat Res. 1977;129:165–171. doi: 10.1097/00003086-197711000-00019. [DOI] [PubMed] [Google Scholar]
- 2.Adam C, Izatt M, Harvey J, Askin G. Variability in Cobb angle measurements using reformatted computerized tomography scans. Spine. 2005;30(14):1664–1669. doi: 10.1097/01.brs.0000169449.68870.f8. [DOI] [PubMed] [Google Scholar]
- 3.Berryman F (2004) Fourier transform profilometry for measuring back shape in scoliosis. PhD. School of Engineering and the Built Environment, University of Wolverhampton, Wolverhampton
- 4.Berryman F, Gardner A, Pynsent P, Fairbank J (2007) The relationship between Cobb angle and ISIS2 lateral asymmetry. In: Scoliosis Research Society eastern european regional meeting. Budapest, Hungary
- 5.Berryman F, Pynsent P, Cubillo J. The effect of windowing in Fourier transform profilometry applied to noisy images. Opt Lasers Eng. 2004;41(6):815–825. doi: 10.1016/S0143-8166(03)00061-7. [DOI] [Google Scholar]
- 6.Bettany J, Harrison D. The Stanmore footplate: an improved method in ISIS optical scanning. In: Alberti A, Drerup B, Hierholzer E, editors. Surface topography and spinal deformity. Stuttgart: Gustav Fischer Verlag; 1992. [Google Scholar]
- 7.Bunnell W. An objective criterion for scoliosis screening. J Bone Joint Surg. 1984;66-A(9):1381–1387. [PubMed] [Google Scholar]
- 8.Cobb J. Outline for the study of scoliosis. Am Acad Orthop Surg Instr Course Lect. 1948;5:261–275. [Google Scholar]
- 9.Drerup B, Hierholzer E. Back shape measurement using video rasterstereography and three-dimensional reconstruction of spinal shape. Clin Biomech. 1994;9:28–36. doi: 10.1016/0268-0033(94)90055-8. [DOI] [PubMed] [Google Scholar]
- 10.Drerup B, Hierholzer E. Assessment of scoliotic deformity from back shape asymmetry using an improved mathematical model. Clin Biomech. 1996;11(7):376–383. doi: 10.1016/0268-0033(96)00025-3. [DOI] [PubMed] [Google Scholar]
- 11.Frobin W, Hierholzer E. Video rasterstereography: a method for on-line measurement of body surfaces. Photogramm Eng Remote Sens. 1991;57:1341–1345. [Google Scholar]
- 12.Goldberg C, Kaliszer M, Moore D, Fogarty E, Dowling F. Surface topography, Cobb angles, and cosmetic change in scoliosis. Spine. 2001;26(4):E55–E63. doi: 10.1097/00007632-200102150-00005. [DOI] [PubMed] [Google Scholar]
- 13.Grivas T, Karras G, Katrabasas J, Papavasiliou N. Study of posterior trunk surface changes by age and sex using moiré topography. In: Sevastik J, Diab K, editors. Research into spinal deformities 1. Amsterdam: IOS Press; 1997. pp. 331–334. [Google Scholar]
- 14.Groves D, Curran P. An accurate, fast and cost effective method for the measurement of body shape and the assessment of spinal deformity. In: Alberti A, Drerup B, Hierholzer E, editors. Proceedings of the 6th international symposium on surface topography and spinal deformity. Stuttgart: Gustav Fischer; 1992. [Google Scholar]
- 15.Lamport L. LaTeX—a documentation preparation system. 2nd. Reading, Massachusetts: Addison Wesley; 1994. [Google Scholar]
- 16.Legaye J, Orban C, Lokietek W, Jacqumin N. The ISIS optic scanner: its use in the evaluation and control of spinal deviations (in French) Acta Orthop Belg. 1992;58(Suppl 1):66–72. [PubMed] [Google Scholar]
- 17.Levy A, Goldberg M, Mayo A, Hanley J, Poitras B. Reducing the lifetime risk of cancer from spinal radiographs among people with adolescent idiopathic scoliosis. Spine. 1996;21(13):1540–1548. doi: 10.1097/00007632-199607010-00011. [DOI] [PubMed] [Google Scholar]
- 18.Lin J, Su X. Two-dimensional Fourier transform profilometry for the automatic measurement of three-dimensional object shapes. Opt Eng. 1995;34(11):3297–3302. doi: 10.1117/12.212911. [DOI] [Google Scholar]
- 19.Morin Doody M, Lonstein J, Stovall M, Hacker D, Luckyanov N, Land C. Breast cancer mortality after diagnostic radiography: findings from the U.S. Scoliosis Cohort Study. Spine. 2000;25(16):2052–2063. doi: 10.1097/00007632-200008150-00009. [DOI] [PubMed] [Google Scholar]
- 20.Oxborrow N. Assessing the child with scoliosis: the role of surface topography. Arch Dis Child. 2000;83:453–455. doi: 10.1136/adc.83.5.453. [DOI] [PMC free article] [PubMed] [Google Scholar]
- 21.Pruijs J, Hageman M, Keesen W, Meer R, Wieringen J. Spinal rotation meter: development and comparison of a new device. Acta Orthop Belg. 1995;61(2):107–112. [PubMed] [Google Scholar]
- 22.R Development Core Team (2005) R: a language and environment for statistical computing. R Foundation for Statistical Computing, Vienna, http://www.r-project.org
- 23.Rosenfeldt M, Harding I, Hauptfleisch J, Fairbank J. A comparison of traditional protractor versus Oxford cobbometer radiographic measurement. Spine. 2005;30(4):440–443. doi: 10.1097/01.brs.0000153401.78638.cb. [DOI] [PubMed] [Google Scholar]
- 24.Su X, Chen W. Fourier transform profilometry: a review. Opt Lasers Eng. 2001;35(5):263–284. doi: 10.1016/S0143-8166(01)00023-9. [DOI] [Google Scholar]
- 25.Takeda M, Mutoh K. Fourier transform profilometry for the automatic measurement of 3-D object shapes. Appl Optics. 1983;22(24):3977–3982. doi: 10.1364/AO.22.003977. [DOI] [PubMed] [Google Scholar]
- 26.Theologis T, Fairbank J, Turner-Smith A, Pantazopoulos T. Early detection of progression in adolescent idiopathic scoliosis by measurement of changes in back shape with the Integrated Shape Imaging System scanner. Spine. 1997;22(11):1223–1228. doi: 10.1097/00007632-199706010-00010. [DOI] [PubMed] [Google Scholar]
- 27.Theologis T, Jefferson R, Simpson A, Turner-Smith A, Fairbank J. Quantifying the cosmetic defect of adolescent idiopathic scoliosis. Spine. 1993;18(7):909–912. doi: 10.1097/00007632-199306000-00016. [DOI] [PubMed] [Google Scholar]
- 28.Turner-Smith A. A television/computer three-dimensional surface shape measurement system. J Biomech. 1988;21(6):515–529. doi: 10.1016/0021-9290(88)90244-8. [DOI] [PubMed] [Google Scholar]
- 29.Turner-Smith A, Roguin B. Lateral asymmetry index. Oxford: Oxford Orthopaedic Engineering Centre; 1984. pp. 38–40. [Google Scholar]
- 30.Turner-Smith A, Harris J, Abery J, Osborne M. The assessment of scoliosis. Oxford: Oxford Orthopaedic Engineering Centre; 1981. pp. 41–47. [Google Scholar]
- 31.Turner-Smith A, Harris J, Houghton G, Jefferson R. A method for analysis of back shape in scoliosis. J Biomech. 1988;21(6):497–509. doi: 10.1016/0021-9290(88)90242-4. [DOI] [PubMed] [Google Scholar]
- 32.Turner-Smith A, Harris J, Zuiden L, Smith H, Fidler C. Analysis of back shape. Oxford: Oxford Orthopaedic Engineering Centre; 1983. pp. 43–51. [Google Scholar]
- 33.Turner-Smith A, Roger R, Harris J. Shape measurement and scoliosis. Oxford: Oxford Orthopaedic Engineering Centre; 1980. pp. 39–58. [Google Scholar]
- 34.Weisz I, Jefferson R, Turner-Smith A, Houghton G, Harris J. ISIS scanning: a useful assessment technique in the management of scoliosis. Spine. 1988;13(4):405–408. doi: 10.1097/00007632-198804000-00006. [DOI] [PubMed] [Google Scholar]


