Abstract
The objective of the present study was to assess the influence of decortication of the posterior elements of the vertebra (recipient bed) and the nature of the bone graft (cortical or cancellous bone) on graft integration and bone, cartilage and fiber neoformation in the interface between the vertebral recipient bed and the bone graft. Seventy-two male Wistar rats were divided into four experimental groups according to the presence or absence of decortication of the posterior vertebral elements and the use of a cortical or cancellous bone graft. Group I—the posterior elements were decorticated and cancellous bone used. Group II—the posterior elements were decorticated and cortical graft was used. Group III—the posterior elements were not decorticated and cancellous graft was used. Group IV—the posterior elements were not decorticated and cortical graft was used. The animals were killed 3, 6 and 9 weeks after surgery and the interface between the posterior elements and the bone graft was subjected to histomorphometric evaluation. Mean percent neoformed bone was 40.8% in group I (decortication and cancellous graft), 39.13% in group II (decortication and cortical graft), 6.13% in group III (non-decorticated and cancellous graft), and 9.27% in group IV (non-decorticated and cortical graft) for animals killed at 3 weeks (P = 0.0005). For animals killed at 6 weeks, the mean percent was 38.53% for group I, 40.40% for group II, 10.27% for group III, and 7.6% for group IV (P = 0.0005), and for animals killed at 9 weeks, the mean was 25.93% for group I, 30.6% for group II, 16.4% for group III, and 18.73% for group IV (P = 0.0026). The mean percent neoformed cartilage tissue was 8.36% for group I, 7.46% for group II, 11.1% for group III, and 9.13% for group IV for the animals killed at 3 weeks (P = 0.6544); 6.6% for group I, 8.07% for group, 7.47% for group III and 6.13% for group IV (P = 0.4889) for animals killed at 6 weeks, and 3.13% for group I, 4.06% for group II, 10.53% for group III and 12.07% for group IV (P = 0.0006) for animals killed at 9 weeks. Mean percent neoformed fibrous tissue was 11% for group I, 6.13% for group II, 26.27% for group III and 21.87% for group IV for animals killed at 3 weeks (P = 0.0008); 7.67% for group I, 7.1% for group II, 9.8% for group III and 10.4% for group IV (P = 0.7880) for animals killed at 6 weeks, and 3.73% for group I, 4.4% for group II, 6.67% for group III and 6.8% for group IV (P = 0.0214) for animals killed at 9 weeks. The statistically significant differences in percent tissue formation were related to decortication of the posterior elements. The use of a cortical or cancellous graft did not influence tissue neoformation. Ossification in the interface of the recipient graft bed was of the intramembranous type in the decorticated animals and endochondral type in the non-decorticated animals.
Keywords: Bone graft integration, Decortication, Histomorphometry, Osteogenesis, Spine
Introduction
The concept of decortication of the recipient graft bed in vertebral arthrodesis was first introduced by Hibbs in 1911 [9]. Decortication is the removal of the superficial part of the cortical bone that covers the posterior elements of the vertebra (spinous process, lamina and articular facet) and exposes vertebral cancellous bone, performed in order to accelerate bone graft integration with its recipient bed [4, 5]. Decortication increases tissue metabolism in the interface between bone graft and recipient bed by increasing the vascular supply to this region, accelerating bone graft integration with the recipient bed and triggering greater bone neoformation [4, 6]. The effect of decortication on bone graft integration has been observed in previous studies [8, 10, 13], although the mechanisms involved in osteogenesis in the interface between recipient bed and graft have not been fully clarified.
The objective of the present study was to evaluate the influence of decortication of the posterior elements of the vertebra (recipient bed) and of the nature of the bone graft (cortical or cancellous) on graft integration and bone, cartilage and fibrous tissue neoformation in the interface between the recipient bed and the graft.
Materials and methods
Seventy-two male Wistar rats weighing 300 g were used. All the aspects of this work were approved by the Ethics Committee of the Faculty of Medicine of Ribeirão Preto, University of São Paulo, Brazil. The animals were divided into four experimental groups of six rats each according to the decortication of the posterior vertebral elements and the nature of the bone graft in contact with the recipient bed (cortical or cancellous) (Table 1). In group I the posterior elements of the vertebra were decorticated and a cancellous bone graft was used; in group II the posterior elements of the vertebra were decorticated and a cortical bone graft was used; in group III no decortication was performed and a cancellous bone graft was used; and in group IV no decortication was performed and a cortical bone graft was used. The animals were killed 3, 6 and 9 weeks after the surgical procedure and placement of the bone graft.
Table 1.
Description of the experimental groups according to the presence or absence of decortication and the nature of the bone graft used
| Posterior elements | Bone graft | |
|---|---|---|
| Group I | Decorticated | Cancellous |
| Group II | Decorticated | Cortical |
| Group III | Not decorticated | Cancellous |
| Group IV | Not decorticated | Cortical |
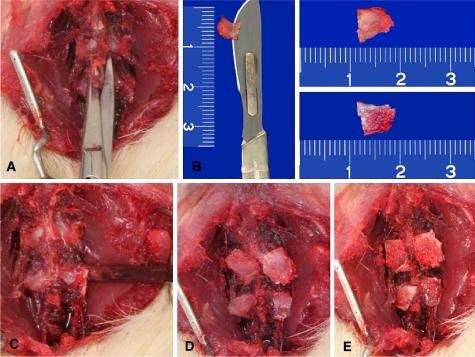
The animals were anesthetized with ketamine (60 mg/kg) and xylazine (5 mg/kg) by the intraperitoneal route. The first two lumbar vertebrae were exposed bilaterally by means of a posterior longitudinal incision. The spinous processes of these vertebrae were sectioned at the base, divided in half on the sagittal plane and used as bone grafts. One of the surfaces of the spinous process was used as a cortical graft and the opposite surface was used as a cancellous graft (Fig. 1). The posterior elements of the vertebra (lamina, articular facet, and transverse process) were decorticated with a fine osteotome only in group I and II animals. In group I and III the bone graft was put in place with its cancellous bone surface in contact with the lumbar vertebrae. In group II and IV animals the cortical surface of the bone graft was placed in contact with the recipient bed. After placement of the bone graft the surgical incision was closed with absorbable sutures (Fig. 1).
Fig. 1.
Photograph of the surgical stages of the experiment. a Exposure of the first two lumbar vertebrae and section at the base of the spinous processes. b The spinous processes were divided on the sagittal plane. Observe the surface of cortical bone (upper fragment) and cancellous bone (lower fragment). c Decortication of the posterior elements with a fine osteotome. d Apposition of the cancellous bone graft on the recipient bed. e Apposition of the cortical bone graft on the recipient bed
The animals were killed with an anesthetic overdose 3, 6 and 9 weeks after surgery and the operated vertebral segment was removed and processed histologically by fixation in 10% formalin and decalcification with 5% EDTA–Tris. The specimens were embedded in paraffin and 5-μm histological sections were stained with Masson trichrome. The sections were taken in transversal plane and processed histologically in a vertical position. The interface between the posterior elements and the bone graft was analyzed like a transversal section in the axial plane. The interface between the recipient bed and the bone graft was studied by histomorphometry in terms of quantity of neoformed bone, cartilage and fibrous tissue. The parallel line method was used for this study in order to calculate the percentage of the different neoformed tissues between each graduated parallel line at 100× magnification [15].
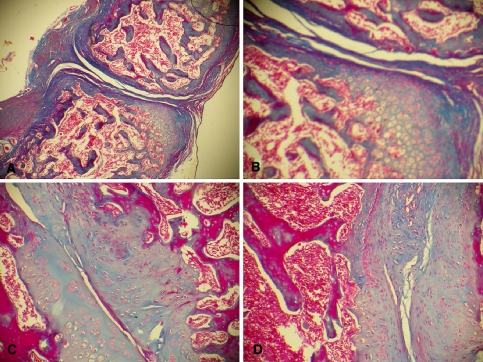
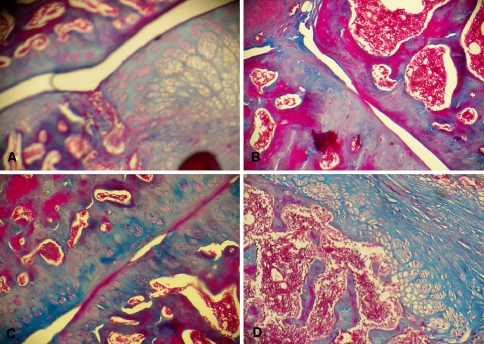
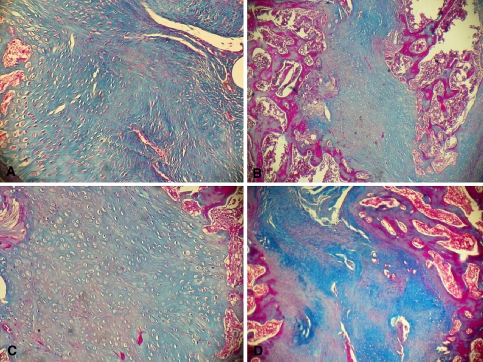
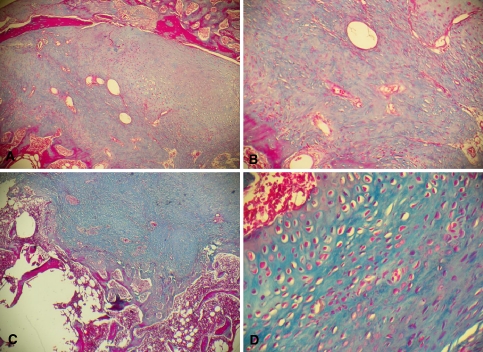
For histomorphometry, the total area of the histological section, which is rectangular in shape, was considered as reference for the calculation of tissue percentage. The tissues under study were identified on the basis of staining and morphological characteristics. Old bone tissue showed dark red staining, fibrous tissue showed dark blue staining, cartilage tissue light blue staining, and neoformed bone tissue showed intermediate blue staining between the light blue of cartilage tissue and the dark blue of fibrous tissue.
The total area of the histological section and the areas of bone, cartilage and fibrous tissue were calculated using a decimal scale ruler coupled to the objective of the microscope. The areas of the three neoformed tissues are reported as percent of the total area of the histological section, with 25 measurements being made in each section. Histomorphometric evaluation was performed by two different observers who were not aware of the surgical technique used in the animals.
In the statistical analysis for the comparison of the quantity of neoformed tissues in the interface the kurtosis test was used to assess the normality of the sample. The Kruskal–Wallis test was then used for statistical comparison involving more than two variables and the Mann–Whitney test was used to compare two variables. The level of significance was set at 5% in all analyses.
Results
At the different times of killing (3, 6 and 9 weeks), different proportions of neoformed bone tissue, cartilage tissue and fibrous tissue were observed in all histological sections studied (Table 2). The decimal ruler attached to the ocular lens was projected in the histologic section, and this section was divided into five equidistant parallel lines. The total area of the histologic section and the area of the three different tissues were calculated after 25 measurements in each section. In order to simplify our results, the area of each different tissue was divided by the total area of the histologic section, to obtain the area percentage.
Table 2.
Mean percentage of neoformed tissues between recipient bed and bone graft as determined by histomorphometry at the various times of killing
| Experimental group | 3 weeks | 6 weeks | 9 weeks | ||||||
|---|---|---|---|---|---|---|---|---|---|
| New bone (%) | Cartilage (%) | Fibroses (%) | New bone (%) | Cartilage (%) | Fibroses (%) | New bone (%) | Cartilage (%) | Fibroses (%) | |
| I | 40.87 ± 5.24 | 8.36 ± 1.08 | 11 ± 3.97 | 38.53 ± 14.13 | 6.6 ± 3.46 | 7.67 ± 5.12 | 29.53 ± 3.47 | 3.13 ± 1.3 | 3.73 ± 1.67 |
| II | 39.13 ± 7.27 | 7.46 ± 0.85 | 6.13 ± 1.78 | 40.40 ± 13.90 | 8.07 ± 1.74 | 7.1 ± 3.16 | 30.60 ± 10.48 | 4.06 ± 1.68 | 4.4 ± 1.33 |
| III | 6.13 ± 2.13 | 11.10 ± 6.03 | 26.27 ± 7.25 | 10.27 ± 5.17 | 7.47 ± 3.27 | 9.8 ± 7.54 | 16.4 ± 6.07 | 10.53 ± 4.75 | 6.67 ± 2.77 |
| IV | 9.27 ± 4.06 | 9.133 ± 3.84 | 21.87 ± 12.7 | 7.6 ± 3.53 | 6.13 ± 2.08 | 10.4 ± 5.59 | 18.73 ± 5.73 | 12.07 ± 2.75 | 6.8 ± 2.49 |
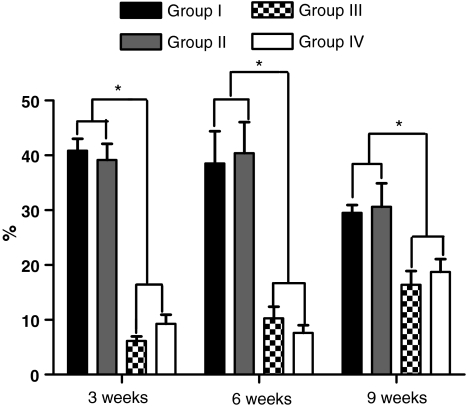
The mean percentage of neoformed bone was 40.87% in group I, 39.13% in group II, 6.13% in group III, and 9.27% in group IV in the animals killed 3 weeks after surgery. A statistically significant difference in the quantity of neoformed bone was observed among the four groups (P = 0.0005, Kruskal–Wallis test), which was due to the decortication of the posterior elements (P = 0.0022, Mann–Whitney test). No significant difference was observed between groups I and II (P = 0.9372) or between groups III and IV (P = 0.1797) regarding the type of graft used (Fig. 2). In the animals killed 6 weeks after surgery, the mean percentage of neoformed bone was 38.53% in group I, 40.40% in group II, 10.27% in group III, and 7.6% in group IV. A significant difference was observed between the four groups (P = 0.0005), which was due to decortication of the posterior elements (P = 0.0022) and not to the type of graft used between groups I and II (P = 0.4848) and between groups III and IV (P = 0.3939) (Fig. 2). In the animals killed 9 weeks after surgery, the mean percentage of neoformed bone was 29.53% in group I, 30.6% in group II, and 18.73% in group IV. A significant difference was observed among the four groups (P = 0.0026), which was due to decortication between groups I and III (P = 0.0022), I and IV (P = 0.0087), II and III (P = 0.0087), and II and IV (P = 0.0152), and which was not related to the type of graft used between groups I and II (P = 0.6991) and III and IV (P = 0.5887) (Fig. 2).
Fig. 2.
Graph illustrating the percentage of neoformed bone in the different experimental groups at 3, 6 and 9 weeks after bone graft placement. The asterisk indicates a statistically significant difference between the decorticated and non-decorticated groups
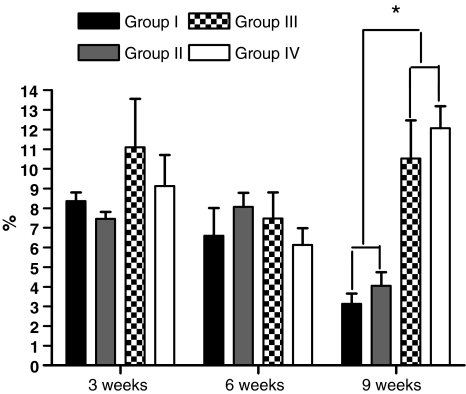
The mean percentage of neoformed cartilage tissue was 8.36% in group I, 7.46% in group II, 11.1% in group III, and 9.13% in group IV in the animals killed 3 weeks after surgery, with no significant difference between the four groups (P = 0.6544) (Fig. 3). In the animals killed 6 weeks after surgery, the mean percentage of neoformed cartilage tissue was 6.6% in group I, 8.07% in group II, 7.47% in group III, and 6.13% in group IV, with no significant difference between groups (P = 0.4889) (Fig. 3). In the animals killed 9 weeks after surgery the mean percentage of neoformed cartilage tissue was 3.13% in group I, 4.06% in group II, 10.53% in group III, and 12.07% in group IV, with a significant difference between groups (P = 0.0006). The difference was due to decortication of the posterior elements (P = 0.0022) and was not related to the type of graft used (P = 0.5887) between groups I and II and P = 0.2403 between groups III and IV (P = 0.2403) (Fig. 3).
Fig. 3.
Graph illustrating the percentage of cartilage in the different experimental groups at 3, 6 and 9 weeks after bone graft placement. The asterisk indicates a statistically significant difference between the decorticated and non-decorticated groups
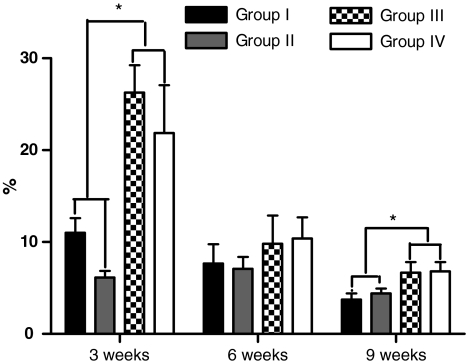
For the animals killed 3 weeks after surgery, the mean percentage of neoformed fibrous tissue was 11% in group I, 6.13% in group II, 26.27% in group III, and 21.87% in group IV. A significant difference was observed among the groups studied (P = 0.0008) and was due to decortication in the comparisons among groups I and II and group III (P = 0.0022), between groups I and IV (P = 0.0152), between groups II and IV (P = 0.0043), and between groups I and II. No significant difference was observed between groups III and IV (P = 0.2403) (Fig. 4). For the animals killed 6 weeks after surgery, the mean percentage of neoformed fibrous tissue was 7.67% in group I, 7.1% in group II, 9.8% in group III, and 10.4% in group IV, with no significant difference between groups (P = 0.7880) (Fig. 4). For the animals killed 9 weeks after surgery, the mean percentage of neoformed fibrous tissue was 3.73% in group I, 4.4% in group II, 6.67% in group III, and 6.8% in group IV, with a significant difference between groups (P = 0.0214). This difference was due to decortication of the posterior elements (P = 0.0260 among group I and groups III and IV, and P = 0.0411 among group II and groups III and IV). There was no significant difference in terms of the type of graft used between groups I and II (P = 0.4848), or between groups III and IV (P = 0.9372) (Fig. 4).
Fig. 4.
Graph illustrating the percentage of fibrous tissue in the different experimental groups at 3, 6 and 9 weeks after bone graft placement. The asterisk indicates a statistically significant difference between the decorticated and non-decorticated groups
A difference was observed in the amount of neoformed tissue in the interface of the bone graft and the recipient bed at the three time points analyzed. The amount of neoformed bone tissue differed significantly between the decorticated and non-decorticated groups at all the time points studied, while the amount of cartilage tissue differed between these groups at 9 weeks and the amount of fibrous tissue differed at 3 and 9 weeks. No significant difference in the amount of neoformed tissue was observed regarding the use of a cortical or cancellous graft at any time after surgery.
Decorticated animals presented an ossification pattern of the intramembranous type in the interface between the recipient bed and the bone graft, whereas the non-decorticated groups presented a predominantly endochondral ossification pattern (Figs. 5, 6, 7, 8).
Fig. 5.
Photomicrographs of the interface of the non-decorticated group with a cancellous graft (group III). Observe the pattern of endochondral ossification. a Section from an animal killed 3 weeks after surgery, showing the formation of cartilage tissue, little contact between the surfaces in the interface and the formation of fibrous tissue around the interface (Masson trichrome, ×40). b Same section as in a at higher magnification (Masson trichrome, ×100) showing the partial filling of the interface with fibrous tissue and the presence of a cartilage mold that is being gradually replaced with bone tissue being formed at the periphery of the cartilage matrix. c Animal killed 6 weeks after surgery. Note the better contact between the surfaces in the interface and the gradual replacement of cartilage tissue with compact bone tissue (Masson trichrome, ×100). d Section from an animal killed 9 weeks after surgery. Observe the marked replacement of cartilage tissue with compact bone tissue, with a small amount of chondrocytes remaining at the periphery of the compact bone surfaces (Masson trichrome, ×100)
Fig. 6.
Photomicrograph of the interface of the non-decorticated group with a cortical graft (group IV). Note the pattern of endochondral ossification. a Section from an animal killed 3 weeks after surgery. Note the little contact between the surfaces in the interface and the presence of cartilage tissue with hypertrophic chondrocytes (Masson trichrome, ×40). b Section from an animal killed 6 weeks after surgery. Note the presence of cartilage tissue and little contact between the interfaces (Masson trichrome, ×100). c Animal killed 9 weeks after surgery. Note the presence of cartilage tissue and a better contact between surfaces (Masson trichrome, ×100). d Section from an animal killed 6 weeks after surgery. Note the pattern of endochondral ossification with the formation of cartilage tissue with hypertrophic chondrocytes and the gradual replacement of cartilage tissue with compact bone tissue (Masson trichrome, ×100)
Fig. 7.
Photomicrograph of the interface of the decorticated group with a cancellous graft (group I). Note the model of predominant intramembranous ossification. a Section from an animal killed 3 weeks after surgery. Note the direct neoformation of a great quantity of compact bone filling the entire interface. Observe the great quantity of blood vessels at the periphery of the interface (Masson trichrome, ×100). b Section from an animal killed 6 weeks after surgery. Note the formation of compact bone in the entire interface and the presence of areas of bone remodeling at the two extremities of the interface (Masson trichrome, ×25). c Same section as in b at higher magnification (Masson trichrome, ×100). Note the formation of compact bone with irregularly distributed osteoblasts (Masson trichrome, ×100). d Section from an animal killed 9 weeks after surgery. Note the complete contact between interfaces, with areas of bone remodeling at the periphery of the interfaces (Masson trichrome, ×40)
Fig. 8.
Photomicrograph of the interface of the decorticated group with a cortical graft (group II). Note the predominant model of intramembranous ossification. a Section from an animal killed 3 weeks after surgery. Note the marked neoformation of compact bone in the entire interface (Masson trichrome, ×40). b Same section as in a at higher magnification. Note the direct formation of irregularly distributed osteoblasts and the large quantity of blood vessels (Masson trichrome, ×100). c Section from an animal killed 6 weeks after surgery. Note the presence of large amounts of neoformed compact bone and an area of bone remodeling (Masson trichrome, ×40). d Section from an animal killed 9 weeks after surgery. Note the presence of osteoblasts distributed in an orderly manner around the blood vessel and of osteoblasts and osteocytes irregularly distributed in the rest of the histological section (Masson trichrome, ×100)
Discussion
Autologous cancellous bone grafts are the graft modality most frequently used in posterior arthrodesis of the human spine. They are considered to be the first choice of bone graft due to their osteoconductive, osteoinducing and osteogenic properties, with their integration with the recipient bed occurring through a cascade of cellular and molecular events [11]. Bone graft integration in vertebral arthrodesis is related to local and systemic factors and the recipient graft bed acts as an important local factor for graft integration [2].
Decortication of the recipient graft bed exposes the elements of bone marrow and accelerates bone integration [6]. The biological factors involved in this phenomenon are not fully known [14]. Mesenchymal cells are believed to be recruited to differentiate into chondroblasts and osteoblasts when stimulated by local factors such as bone morphogenic protein, platelet-derived growth factor, interleukim, fibroblast growth factor, insulin-like growth factor, granulocyte-colony-stimulating factors and granulocyte-macrophage colony stimulating factors [11].
The hypothesis of stimulation of cell differentiation in the graft interface by decortication of the recipient bed was supported by the different proportion of neoformed tissue observed in the decorticated and non-decorticated groups. The exposure of medullary elements altered the amount of neoformed tissue, especially bone tissue, regardless of the use of a cancellous or cortical graft.
The only factor that interfered with the neoformation of the three different types of tissue in the interface between recipient bed and bone graft in all four experimental groups at 3, 6 and 9 weeks after surgery was the decortication of the posterior elements. The ability of induction and acceleration of bone formation in decorticated areas has been observed experimentally [6, 8].
In the present study, the decorticated animals showed greater bone neoformation. Other histological studies with markers of vascular neoformation have indicated that the initial vascular supply for the arthrodesis mass originates from the decorticated transverse processes and not from the adjacent soft tissues [3]. In addition, decortication of the posterior elements places the bone graft in direct contact with cells of the reticuloendothelial system, with osteoinducing and osteogenic factors present in the blood stream [3]. In posterior spinal arthrodesis the bone graft suffers a process of necrosis and reabsorption, attracting cells of the reticuloendothelial system. These cells have the ability to transform into progenitor cells of the osteoblast lineage [7]. The direct contact of the bone graft with the raw area in the decorticated groups studied here permitted a greater abundance of inducing and osteogenic factors such as bone morphogenic proteins in the interface between the posterior bed and the graft. These factors stimulate both the recruitment of more osteogenic cells and neovascularization [12]. The greater quantity of neoformed bone tissue with a smaller amount of cartilage and fibrous tissue in the interface of the decorticated groups appears to be more advantageous for bone graft integration since the bone bridge is formed more rapidly, guaranteeing greater resistance for bone graft integration [8].
Decortication modified not only the quantity of neoformed tissues but also the osteogenesis process for bone graft integration. Osteogenesis on the interface differed between decorticated and non-decorticated animals. In the group of decorticated animals, osteogenesis occurred by the mechanism of intramembranous and endochondral ossification, with a predominance of the intramembranous type, leading to a more exuberant and a faster bone neoformation [12]. In contrast, in the non-decorticated group there was a prevalence of endochondral ossification, with slower bone neoformation.
Bone tissue neoformation was the parameter most affected by decortication of the recipient bed, with fibrous tissue being also influenced at the extreme time points (3 and 9 weeks), and cartilage tissue being affected only at the late time point (9 weeks). Decorticated animals presented less fibrous tissue than non-decorticated animals at 3 and 9 weeks because they mainly presented endochondral ossification for bone graft integration. This type of ossification is slower and bone graft stability is lower compared to intramembranous ossification and for this reason endochondral ossification occurs with a greater quantity of associated fiber tissue. Zimmermann et al. [16] demonstrated that a greater formation of fibrous tissue occurs in situations of instability. The fact that endochondral ossification is slower also explains the greater amount of cartilage in non-decorticated animals at 9 weeks. At this time of killing, the decorticated animals had a better-integrated graft in a more advanced process of bone remodeling, while the non-decorticated animals were still in a process of endochondral ossification for graft integration.
The greater abundance of oxygen on the decorticated interface may induce ossification of intramembranous origin. Under conditions of low oxygen concentration, the model of endochondral ossification tends to occur [1]. The increased supply of bone morphogenic proteins for the interface may be another possible stimulus for the occurrence of intramembranous ossification [12].
In the decorticated groups in which the model of intramembranous ossification predominated, graft integration was more rapid and the process of bone remodeling started earlier. The model of intramembranous ossification also explains the more rapid bone neoformation in these animals, with a smaller quantity of cartilage and fibrous tissue. The earlier beginning of bone remodeling in decorticated animals may also be related to the reduction of neoformed bone at the end of 9 weeks. The slower bone formation occurring in the endochondral ossification model explains the increasing bone neoformation values in non-decorticated animals over the 9-week period, as well as the greater amount of cartilage tissue at the end of this period. This means that the non-decorticated animals were still undergoing a process of bone graft integration during the ninth postoperative week, with a delay compared to decorticated animals whose bone graft was better integrated at the end of this period, with the animals being in a stage of bone remodeling.
The Wistar rat experimental model used in this study has several advantages such as allowing a rapid healing period, animals easily lodged and fed, resistance to climate variation, low cost, and besides, being routinely used in other experimental conditions involving bone reconstruction. It must be recognized that whereas the rat animal model does not entirely simulate the biologic and mechanical circunstances of the human spine. Using this model, it is possible to simulate the general concept of bone graft integration in the posterior spine (i.e. surgical modification of spinal anatomy and structure to create a properly environment for the bone graft integration). This experimental model focused on histological process of bone graft incorporation, and was able to identify two different biologic models of bone graft incorporation. Our study gives support to clinical practice and its result may help to explain why there is a better bone graft incorporation in the decorticated human spine.
Decortication of the bone graft recipient bed favorably affects the histological process of integration by accelerating graft integration with the recipient bed, with a greater production of neoformed bone tissue and a predominance of intramembranous ossification in the interface between bone graft and recipient bed.
References
- 1.Boden SD. Overview of the biology of lumbar spine fusion and principles for selecting a bone graft substitute. Spine. 2002;27:S26–S31. doi: 10.1097/00007632-200208151-00007. [DOI] [PubMed] [Google Scholar]
- 2.Boden SD, Grob D, Damien C. Neo-osteo bone growth factor for posterolateral lumbar spine fusion: results from a nonhuman primate study and a prospective human clinical pilot study. Spine. 2004;29(5):504–514. doi: 10.1097/01.BRS.0000101446.26071.EB. [DOI] [PubMed] [Google Scholar]
- 3.Boden SD, Moskovitz PA, Morone MA, Toribitake Y. Video-assisted lateral intertransverse process arthrodesis. Validation of a new minimally invasive lumbar spinal fusion technique in the rabbit and nonhuman primate (rhesus) models. Spine. 1996;21(22):2689–2697. doi: 10.1097/00007632-199611150-00020. [DOI] [PubMed] [Google Scholar]
- 4.Boden SD, Schimandle JH, Hutton WC. An experimental lumbar intertransverse process spinal fusion model. Radiographic, histologic, and biomechanical healing characteristics. Spine. 1995;20(4):412–420. doi: 10.1097/00007632-199502001-00003. [DOI] [PubMed] [Google Scholar]
- 5.Burchardt H. The biology of bone graft repair. Clin Orthop Relat Res. 1983;174:28–42. [PubMed] [Google Scholar]
- 6.Conti OJ, Pastorello MT, Defino HLA. Bone decortication in spinal graft integration -an experiemental study. Acta Ortop Bras. 2006;14(2):67–71. doi: 10.1590/S1413-78522006000200001. [DOI] [Google Scholar]
- 7.Cunningham BW, Shimamoto N, Sefter JC, Dmitriev AE, Orbegoso CM, McCarthy EF. Osseointegration of autograft versus osteogenic protein-1 in posterolateral spinal arthrodesis: emphasis on the comparative mechanisms of bone induction. Spine J. 2002;2(1):11–24. doi: 10.1016/S1529-9430(01)00170-X. [DOI] [PubMed] [Google Scholar]
- 8.Foster MR, Allen MJ, Schoonmaker JE, Yuan HA, Kanazawa A, Park SA. Characterization of a developing lumbar arthrodesis in a sheep model with quantitative instability. Spine J. 2002;2(4):244–250. doi: 10.1016/S1529-9430(02)00189-4. [DOI] [PubMed] [Google Scholar]
- 9.Hibbs RA. An operation for progressive spinal deformities. N Y Med J. 1911;93:1013–10166. [Google Scholar]
- 10.Ishikawa S, Shin HD, Bowen JR, Cummings RJ. Is it necessary to decorticate segmentally instrumented spines to achieve fusion. Spine. 1994;19:1686–1690. doi: 10.1097/00007632-199408000-00006. [DOI] [PubMed] [Google Scholar]
- 11.Khan SN, Cammisa FP, Jr, Sandhu HS, Diwan AD, Girardi FP, Lane JM. The biology of bone grafting. J Am Acad Orthop Surg. 2005;13(1):77–86. [PubMed] [Google Scholar]
- 12.Romith M, Delécrin J, Heyman D, Passuti N. The vertebral interbody grafting site’s low concentration in osteogenic progenitors can greatly benefit from addition of iliac crest bone marrow. Eur Spine J. 2005;14:645–648. doi: 10.1007/s00586-004-0827-9. [DOI] [PMC free article] [PubMed] [Google Scholar]
- 13.Sandhu HS, Kanim LE, Toth JM, Kabo JM, Liu D, Delamarter RB. Experimental spinal fusion with recombinant human bone morphogenetic protein-2 without decortication of osseous elements. Spine. 1997;22(11):1171–1180. doi: 10.1097/00007632-199706010-00001. [DOI] [PubMed] [Google Scholar]
- 14.Vaccaro AR, Chiba K, Heller JG, Patel TC, Thalgott JS, Truumees E. Bone grafting alternatives in spinal surgery. Spine J. 2002;2:206–215. doi: 10.1016/S1529-9430(02)00180-8. [DOI] [PubMed] [Google Scholar]
- 15.Weibel ER, Kistler GS, Scherle WF. Practical stereological methods for morphometric cytology. J Cell Biol. 1966;30:23–38. doi: 10.1083/jcb.30.1.23. [DOI] [PMC free article] [PubMed] [Google Scholar]
- 16.Zimmermann CE, Thurmüller P, Troulis MJ, Perrot DH. Histology of the porcine distraction wound. Int J Oral Maxillofac Surg. 2005;34:411–419. doi: 10.1016/j.ijom.2004.09.002. [DOI] [PubMed] [Google Scholar]


