

Abstract
Acyl-coenzyme A binding protein (ACBP) has been proposed to transport fatty acyl-CoAs intracellularly, facilitating their metabolism. In this study, a new mouse recombinant ACBP was produced by insertion of a histidine (his) tag at the C-terminus to allow efficient purification by Ni-affinity chromatography. The his-tag was inserted at the C-terminus since ACBP is a small molecular size (10 kDa) protein whose structure and activity are sensitive to amino acid substitutions in the N-terminus. The his tag had no or little effect on ACBP structure or ligand binding affinity and specificity. His-ACBP bound the naturally-occurring fluorescent cis-parinaroyl-CoA with very high affinity (Kd=2.15 nM), but exhibited no affinity for non-esterified cis-parinaric acid. To determine if the presence of the C-terminal his tag altered ACBP interactions with other proteins, direct binding to hepatocyte nuclear factor 4α (HNF-4α), a nuclear receptor regulating transcription of genes involved in lipid metabolism, was examined. His-ACBP and HNF-4α were labeled with Cy5 and Cy3, respectively, and direct interaction was determined by a novel fluorescence resonance energy transfer (FRET) binding assay. FRET analysis showed that his-ACBP directly interacted with HNF-4α (intermolecular distance of 73 Å) at high affinity (Kd=64-111 nM) similar to native ACBP. The his-tag also had no effect on ACBPs ability to interact with and stimulate microsomal enzymes utilizing or forming fatty acyl CoA. Thus, C-terminal his-tagged-ACBP maintained very similar structural and functional features of the untagged native protein and can be used in further in vitro experiments that require pure recombinant ACBP.
Keywords: acyl-CoA binding protein, cis-parinaroyl-CoA, fluorescence ligand binding, FRET
INTRODUCTION
Acyl coenzyme A binding protein (ACBP) is a member of a large family of lipid binding proteins ubiquitously expressed in all eukaryotic organisms [11]. These proteins have remarkably high affinities (1-20 nM Kds) and selectivity for binding medium and long-chain fatty acyl coenzyme A thioesters (C14-C22) [8,10,12,18] and have been proposed to have important roles in intracellular transport and transacylation of fatty acyl-CoAs (rev. in [8,15,31]. Based on in vitro studies, the primordial role of ACBP has been thought to maintain a cytosolic pool of acyl-CoAs protected from acyl-CoA hydrolases, thus making acyl-CoAs available to several cytoplasmic membrane-bound organelles involved in lipid metabolism, such as to: endoplasmic reticulum (ER) for transacylation to cholesteryl esters, triacylglycerides, or glycerophospholipids [4,5,15,21]; mitochondria for transacylation to acylcarnitines for oxidation [1,3,34]; and the Golgi complex for regulating vesicle budding to form transport vesicles [32,33]. At the nuclear membrane and in the nuclear matrix, ACBP may modulate gene expression, as indicated by ACBP-specific transactivation and proximity to nuclear receptors such as hepatocyte nuclear factor-4 α (HNF-4α) in fixed cells [31]. ACBP overexpression in yeast cells [23], mammalian cells in culture [41], and transgenic animals [18] generally indicated that ACBP is a lipogenic protein which induces high levels of lipid synthesis and accumulation, especially of triglycerides. These data are in agreement with ACBP gene expression being upregulated by lipogenic transcription factors such as sterol-regulatory element binding protein (SREBP) in the liver [35,39] and by PPARγ during adipocyte differentiation from fibroblasts upon insulin stimulation [17,28]. ACBP is also found at abnormally high levels in tumor cells that exhibit very high rates of lipid synthesis as well as proliferation [6,14,16,25,40]. Conversely, ACBP suppression results in reduced cellular growth rates, abnormal fatty acyl-CoA composition, vesicle accumulation, and membrane defects in yeast [13,36]; inhibition of adipocyte differentiation [27]; and lethality in some types of mammalian cells [9].
Because production and isolation of endogenous native ACBP from liver and recombinant ACBP with native amino acid sequence are laborious with a low-yield [4], a new method was developed in which a recombinant mouse histidine-tagged ACBP (his-ACBP) was prepared. Insertion of the his-tag at the C-terminus was chosen since: (i) the N-terminus of ACBP undergoes post-translational processing to remove the initiating methionine, followed by N-acetylation of the serine residue [26], (ii) amino acid substitutions in the N-terminal region alter ACBP activity [14]. By placing the his-tag at the C-end of ACBP molecule, the post-translational processing, structure, and functional activity of ACBP were not significantly altered. These studies now make available pure recombinant C-terminal his-ACBP for further use in vitro to examine ligand and protein interactions as well as for studies of direct incorporation of labeled ACBP and targeting in living cells.
MATERIALS AND METHODS
Materials
The pET21b plasmid was purchased from Novagen, EMD Biosciences, Inc. (LaJolla, CA) and a pGEM vector was from Promega, Madison, WI). DNA electrophoresis chemicals and restriction enzymes were obtained from New England BioLabs, Inc. (Beverly, MA). BioGel P4 resin was from Bio-Rad (Hercules, CA) and Ni-CAM resin, protease inhibitor cocktail, and β-galactosidase were acquired from Sigma (St-Louis, MO). BCA protein assay kit was from Pierce Biotechnology Inc. (Rockford, IL). Recombinant mouse ACBP with identical amino acid sequence as native ACBP was produced as described previously [4]. Full length hepatic nuclear factor-4α (HNF-4α) was expressed in E. coli and purified as previously described [29-31,37]. Cis-parinaric acid (naturally-fluorescent fatty acid analogue), was obtained from Molecular Probes, InVitrogen (Eugene, OR). Cis-parinaroyl-CoA (natural-fluorescent fatty acyl CoA analogue) was synthesized as described earlier [12,30]. Cy3 and Cy5 were from Amersham Biosciences Corp. (Piscataway, NJ). Glycerol-3-phosphate was from Sigma (St. Louis, MO). [14C]Oleoyl CoA was from New England Nuclear (Boston, MA). [9,10-3H(N)]Oleic acid (10 Ci/mmol) was from Amersham (Arlington Heights, IL).
Cloning of C-end histidine-tagged mouse ACBP and expression in E. coli
Mouse ACBP cDNA was inserted into the NdeI/XhoI cloning site of the pET21b plasmid: i) mouse ACBP cDNA from a pgk plasmid [4] was amplified by PCR using primers introducing NdeI (CATATG) and XhoI (CTCGAG) restriction sites at the 5′ and 3′ ends of the PCR product, respectively: 5′-GCGCCATATGTCTCAGGCTGAATTTG-3′ as sense primer, and 5′-CCGGCTCGAGTATTCCGTATTTCTTCTTTAGC-3′ as antisense primer (Integrated DNA Technologies, Inc., Coralville, IA); ii) the ACBP PCR product was cloned into the pGEM-T vector, cut from pGEM with NdeI/XhoI, and ligated into the NdeI/XhoI cloning site of pET21b (containing the his-tag); iii) BL21 E. coli cells were transformed with pET21b plasmid containing mouse ACBP cDNA, positive clones were selected and grown on large scale for his-tagged ACBP purification. The nucleotide sequence of mouse ACBP cDNA in pET21b plasmid was validated by DNA sequencing (Gene Technologies Lab, Texas A&M University College Station, TX). The cDNA from PCR and plasmids were run in 1% agarose gels in Tris-Acetate-EDTA (TAE) buffer, against 100 bp and 1 kb DNA ladders.
Purification of his-ACBP
Separation of his-ACBP from cell lysate was performed by affinity chromatography on Ni-CAM resin (Sigma, St-Louis, MO) by a batch method. Briefly, 10 g of BL21 cells expressing his-ACBP were suspended in buffer A consisting of 20 mM TRIS-HCl, pH 7.4, 0.3 M NaCl, 1mM DTT and protease inhibitor cocktail (Sigma, St. Louis, MO). The cell suspension was sonicated with 20% pulsar power, 1 min on / 2 min off for one hour, on ice, by using a 550 Sonic Dismebrator from Fisher Scientific, Inc. (Pittsburgh, PA). The resultant cell lysate was centrifuged at 12000 x g to separate cellular debris from soluble proteins. A 4 ml aliquot of Ni-CAM resin (Sigma, St. Louis, MO) was pre-equilibrated in the same buffer, added to the cell lysate supernatant, followed by incubation at 4° C for two hours. The resin was separated by centrifugation at 1000 x g and washed with 50 ml buffer B (20 mM TRIS-HCl, pH 7.4). His-ACBP was then eluted from the resin with 5 ml each of 10 mM, 30 mM, and 150 mM imidazole in buffer B. Protein concentration was determined in each elution fraction, and degree of his-ACBP purity was assessed by SDS-PAGE in 14% acrylamide gels according to a Bio-Rad procedure [24]. Gels were Coomassie blue stained or silver stained with the Silver Stain Plus kit per the manufacturer’s instructions (Bio-Rad Laboratories, Hercules, CA) to determine purity. Western blotting of his-ACBP was performed by using locally-produced rabbit polyclonal antiserum raised against native rat liver ACBP [31].
Determination of his-ACBP ligand affinity and specificity: Fluorescence ligand binding assay
The ligand binding affinity and specificity of his-ACBP were characterized with cis-parinaroyl-coenzyme A, and cis-parinaric acid as bound and unbound ligands, respectively, as previously described [12,30]. Briefly, 30 nM his-ACBP was titrated with 2.5-300 nM cis-parinaroyl CoA or with 5-1000 nM cis-parinaric acid, and fluorescence emission spectra were recorded from 380-440 nm upon excitation of ligand at 310/320 nm. Fluorescence emission spectra were obtained using a photon counting fluorimeter (PC1, ISS Inc. Urbana, IL). Maximum fluorescence intensities at each titration point were plotted versus ligand concentrations after subtraction of corresponding control values in which his-ACBP was not present. Bmax and Kd values were obtained by curve fitting, using SigmaPlot software (SYSTAT, San Jose, CA), and fitting to the one site binding saturation option of the program.
Determination of number his-ACBP fatty acyl CoA binding sites: reverse titration and fluorescent ligand spectral parameters
Reverse titration was performed by adding increasing concentrations of his-ACBP (4-400 nM) to a constant amount of cis-parinaroyl-CoA (50 nM), and recording fluorescence emission spectra of ligand from 380 nm to 440 nm, with excitation at 320 nm. Maximum fluorescence intensities at each titration point were plotted versus his-ACBP to cis-parinaroyl-CoA molar ratio to determine number of binding sites per molecule of protein.
Cis-parinaroyl-CoA absorbance spectral parameters were used to confirm the number of binding sites. This assay is based on the previous finding that cis-parinaric acid absorption parameters can be used to determine number of binding sites per molecule of albumin [2]. Since cis-parinaroyl-CoA is a thioester of cis-parinaric acid and maintains its absorbance spectroscopic properties, its absorbance spectral parameter were similarly used for comparison of his-ACBP bound and free (in the absence of protein) cis-parinaroyl-CoA. Thus, 4 μM cis parinaroyl-CoA in 20 mM potassium phosphate buffer pH 7.4 were titrated with 0.43 to 16 μM his-ACBP, over a range of molar ratios of 0.11 to 4. Cis-parinaroyl-CoA absorbance spectra were taken to determine maximum optical densities at valley 1 and peak 2 (see Results, Fig. 5A). Ratios of valley 1 over peak 2 absorption intensities were calculated and plotted versus moles his-ACBP/ moles of cis-parinaroyl-CoA ratios at each titration point. Peak 2 wavelengths versus his-ACBP/ cis-parinaroyl-CoA molar ratios were also plotted to provide number of ligand binding sites per his-ACBP molecule. As a control, the same experiment was also performed with cis-parinaric acid, the non-preferred ligand [12].
Figure 5. Interaction of his-ACBP with HNF-4α by FRET.
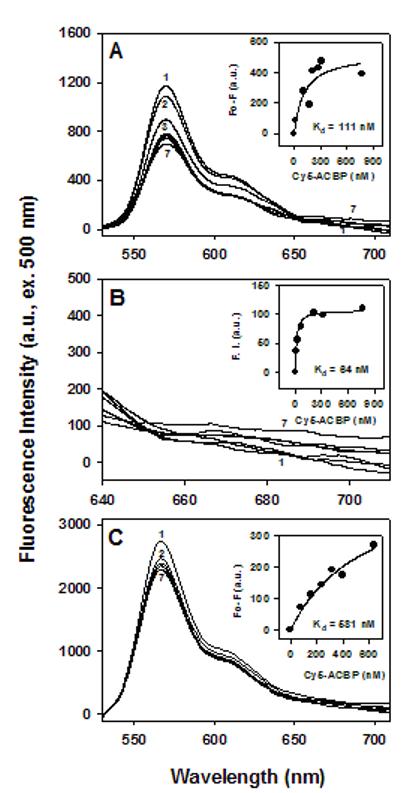
Cy3-HNF-4α (200 nM) and Cy3-β-galactosidase (200 nM, negative control) were titrated with increasing Cy5-his-ACBP (5 nM to 2 μM) as described in Methods. A. Emission spectra of Cy3-HNF-4α/Cy5-his-ACBP with donor Cy3 excitation at 500 nm; inset, quenching of donor Cy3 fluorescence vs acceptor Cy5-his-ACBP concentrations. B. Close-up of spectra in A, 640-750 nm range; inset, sensitized emission intensity for acceptor Cy5-his-ACBP vs Cy5-his-ACBP concentration. C. Emission spectra of Cy3-β-galactosidase excited at 500 nm; inset, quenching in Cy3 versus Cy5-his-ACBP concentrations.
Circular dichroism (CD) analysis of his-tagged ACBP compared to untagged ACBP recombinant protein with native amino acid sequence
Far UV CD spectra of untagged recombinant mouse ACBP [4] and his-ACBP were measured in 30 mM phosphate buffer, pH 7.4 using a spectropolarimeter (J-710, Jasco, Baltimore, MD) and a 1mm cuvette. Spectra were recorded from 260 to 190 nm at 50 nm/min, with a time constant of 1 sec and a bandwidth of 2 nm. An average of 10 scans were run for each CD profile. Percentage composition of secondary structures was calculated by using CDPRO software as described [7,38].
Fluorescence labeling of his-ACBP and hepatocyte nuclear factor-4a (HNF-4a) with Cy5 and Cy3
HNF4α protein was fluorescently labeled with Cy3, and ACBP and his-ACBP were fluorescently labeled with Cy5, using commercially available labeling kits (Amersham Inc. Pittsburgh, PA) following the manufacturers’ instructions. Generally, 0.5 mg protein was incubated with dye/DMSO in a 1:5 -1:10 protein/dye molar ratio, in phosphate buffer saline (PBS), pH 8.5, stirring for one hour at room temperature. After removing possible aggregates by a brief centrifugation at 20,000 x g, the dye/protein conjugate was isolated from unreacted dye by gel-exclusion chromatography using BioGel resins (i.e. BioGel P4 for Cy5-his-ACBP, and P10 for Cy3-HNF-4α). Qualitative determination of final dyed protein products were performed by SDS-PAGE and western blotting. The molecular size of dye-protein conjugates and dye-to-protein molar ratios were determined by mass spectrometry (Mass Spectrometry Laboratory, Texas A&M University).
Binding affinity of his-ACBP for hepatic nuclear factor-4α (HNF-4α): fluorescence resonance energy transfer (FRET) based binding assay
A constant amount of Cy3-HNF-4α (200 nM) was titrated with increasing concentrations of Cy5-his-ACBP or Cy5-ACBP (5 nM to 2 μM) in L&C buffer (20 mM Tris-HCl, pH 8.0, 0.3 M NaCl), and emission spectra of Cy3 and Cy5 from 510 to 800 nm, with excitation of Cy3 at 500 nm were recorded. Control experiments in which the same concentrations of Cy5-his-ACBP or Cy5-ACBP were added in the absence of Cy3-HNF-4α were also run and taken into calculations. The Cy3 maximum emission intensities at 570 nm and Cy5 maximum sensitized emission at 700 nm were plotted against Cy5-his-ACBP concentrations, so that two binding curves were obtained, one from quenching of Cy3, and the other from sensitized emission of Cy5 due to FRET. ACBP/HNF-4α binding affinity data were obtained by determination of Kd values.
Intermolecular distance between his-ACBP and HNF-4α: FRET between Cy5-his-ACBP and Cy3-HNF-4α
FRET data from the preceding section were also used to calculate intermolecular distance basically as described earlier [31], except that FRET was measured between Cy5-his-ACBP or Cy5-ACBP and Cy3-HNF4α when bound together as a complex. FRET efficiency values were calculated from quenching of Cy3 fluorescence emission and appearance of Cy5 sensitized emission, and inserted into the following equations [22]: Eq= 1-(FDA/FD) (equation 1), and Ese= (FAD/FA)/(εA/εD) (equation 2), where Eq is FRET efficiency calculated from quenching data, Ese is FRET efficiency calculated from sensitized emission data, FDA is fluorescence intensity of donor in the presence of acceptor, FD is fluorescence intensity of donor in the absence of acceptor, FAD is fluorescence of acceptor in the presence of donor, FA is fluorescence of acceptor in the absence of donor, εA is molar absorbance coefficient of acceptor at excitation wavelength (500 nm), and εD is molar absorbance coefficient of donor (Cy3) at excitation wavelength (500 nm). To estimate the specificity of ACBP/HNF-4α interaction, the same experiment was applied to an unrelated protein, β-galactosidase, in the place of HNF-4α.
Microsomal glycerol-3-phosphate acyltransferase (GPAT)
The effect of his-tagging on the ability to stimulate fatty acyl CoA incorporation into phosphatidic acid by microsomal glycerol-3-phosphate acyltransferase (rate limiting step in phosphatidate synthesis) was carried out as described previously [20] with 10 μM or 20μM ACBP or his-ACBP, and ddH2O as control. Each reaction mixture contained 40μM [14C]Oleoyl CoA. After the reaction, the lipids were extracted with hexane/2-propanol mixture (3:2, v/v) and separated by thin layer chromatography. Bands corresponding to phosphatidic acid were scraped and counted by liquid scintillation counting. Values represent the mean ± SE (n=3 or 4).
Microsomal acyl coenzyme A synthetase (ACS)
The effect of ACBP and his-ACBP on rat liver microsomal fatty acyl-CoA synthetase activity was assayed as described previously [19] with 20 μM ACBP or his-ACBP, and ddH2O as control. The reaction was initiated by addition of 5 μCi [3H]/μmol (50 μM) oleic acid in a total volume of 200 μl and allowed to proceed at room temperature for 30min. The reaction was stopped by extraction with 800 μl CHCl3/MeOH (2:1, v/v). The aqueous phase was counted by liquid scintillation counting. Values represent the mean ± SE (n=4).
RESULTS AND DISCUSSION
Cloning, expression and purification of histidine-tagged ACBP (his-ACBP)
The his tag was inserted at the C-terminus because the N-terminus of ACBP undergoes post-translational processing to remove initiating methionine, followed by N acetylation of the following serine residue [26]. By placing his tag at the C end of the molecule, post-translational processing was not impaired. PCR amplification and restriction enzyme digestion of his-ACBP cDNA in pGEM and pET21b vectors was consistent with the presence of his-ACBP cDNA (Fig. 1A). cDNA sequencing confirmed the expected nucleotide sequence of his-ACBP DNA cloned in pET21b and its corresponding translation into amino acids (Fig. 1B). The amino acid sequence of histidine-tagged ACBP was identical to mouse native (endogenous) and recombinant ACBP with native amino acid sequence [4], except for additional L (leucine) and E (glutamic acid) that were formed in the process of histidine tagging.
Figure 1. Mouse recombinant his-ACBP cloning and purification.

A. Agarose gels of the his-ACBP PCR product, his-ACBP PCR fragment cloned into pGEM-T vector, and his-ACBP subcloned into pET21b vector: HMW, high molecular weight marker (1kb); LMW, low molecular weight marker (100bp); H-ACBP-PCR, PCR product encoding his-ACBP cDNA; pGEM-H-ACBP, his-ACBP PCR fragment T-A cloned into the pGEM-T plasmid: 1, 1μg of uncut plasmid; 2, 1μg of Xho I/Nde I cut plasmid; pET21b-H-ACBP refers to his-ACBP cDNA cloned into pET21b plasmid: 3, 1μg of Xho I -cut plasmid; 4, 1μg of Xho I/Nde I digested plasmid. B. DNA sequence of mouse ACBP cDNA inserted into pET21b vector and its amino acid translation. C. SDS-PAGE gel and Western blotting of his-ACBP expressed in BL21 E. coli cells in the absence (lanes 1 and 3, respectively) and presence of IPTG (lanes 2 and 4, respectively). For SDS-PAGE and Coomassie staining, 20 μg of total protein was loaded per lane, while 10 μg of total protein per lane was used for Western blotting. D. Representative Coomassie stained SDS-PAGE gel showing his-ACBP in E. coli cell lysate (lane 1, 25 μg protein) and elution fraction after Ni-column (lane 2, 2 μg protein). SDS-PAGE gel of purified his-ACBP silver stained to determine purity: 3, protein marker; 4, ultra low range protein marker; 5, 1μg of his-ACBP; 6, 2μg of his-ACBP; 7, 5μg of his-ACBP.
The pET21b-ACBP plasmid was highly expressed in E. coli BL21 under IPTG induction (Fig. 1C). SDS-PAGE of E. coli cell lysate in the presence (Fig. 1C, lane 2), but not absence (Fig. 1C, lane 1) of IPTG demonstrated a high level of his-ACBP expression with molecular weight ∼11 kDA. Western blotting of E. coli cell lysate in the presence (Fig. 1C, lane 4), but not absence (Fig. 1C, lane 3) of IPTG confirmed that antigenic activity was preserved after his-tagging and that the ∼11 kDa protein was his-ACBP.
His-ACBP was further isolated by one-step affinity chromatography on Ni-CAM resin, and large amounts of highly purified protein were produced (Fig. 1D). SDS-PAGE images of proteins before (Fig. 1D, lane 1) and after (Fig. 1D, lane 2) affinity purification, as well as silver staining of increasing concentrations of purified his-ACBP (Fig. 1E), showed no additional bands, suggesting the protein was pure. The exact molecular weight of his-ACBP was 10975.97 Da by mass spectrometry analysis (Methods). This molecular weight is only slightly larger (<10%) than mouse endogenous or recombinant ACBP. His-ACBP was further characterized to ensure that addition of the C-terminal his-tag did not adversely affect structural and functional properties of ACBP, as described in the following sections.
Structural analysis of his-ACBP versus native ACBP: absorbance spectroscopy, circular dichroism (CD), and fluorescence spectroscopy
The structure of his-tagged ACBP was compared to mouse ACBP by analysis of absorbance, circular dichroism (CD), and fluorescence spectroscopy. The UV absorbance spectra of equal amounts of his-ACBP versus ACBP were >90% similar, demonstrating maximal absorption at 280 nm (Fig. 2A), consistent with both molecules containing the same number of aromatic amino acids: two Trp and three Tyr residues per molecule. Circular dichroic (CD) spectra of his-ACBP and ACBP were superimposable (Fig. 2B), demonstrating that no changes were introduced in the secondary structure by addition of the histidine groups. Fluorescence emission spectra had overall similar maxima, whether the proteins were excited at 280 nm for excitation of both Tyr and Trp residues (Fig. 2C) or at 295 nm for excitation of Trp only (Fig. 2D). The <6% decrease in fluorescence emission intensity at 335 nm with excitation at 280 nm concomitant with <6% increase of fluorescence emission intensity near 350 nm with excitation at 295 nm suggested a minimally altered orientation of the Tyr and Trp residues in his-ACBP that would slightly favor internal energy transfer from Tyr to Trp.
Figure 2. Structural characteristics of his-ACBP vs untagged ACBP: UV absorbance, CD and fluorescence spectra.
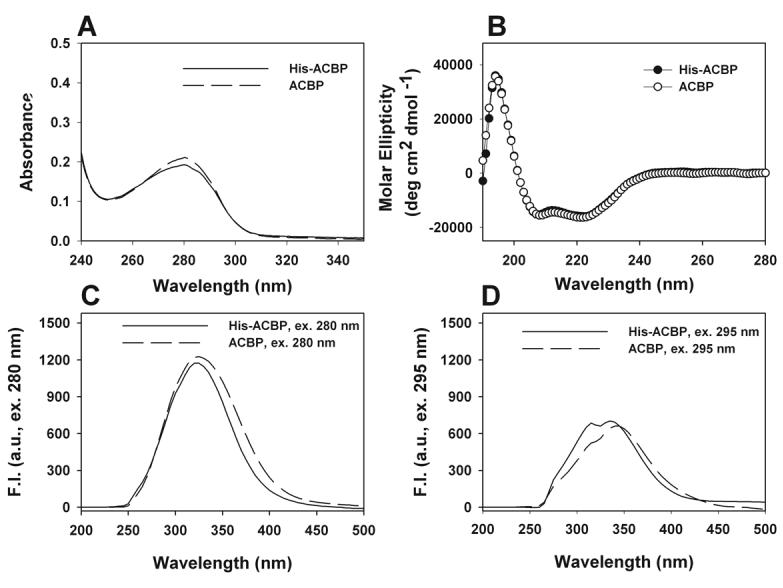
A. UV-Vis spectra of 5μM his-ACBP (solid) and 5μM untagged ACBP (dashed). B. Far UV CD spectra of his-tagged ACBP (solid) and ACBP (open). All CD studies were performed with 4μM protein. C. Fluorescence emission spectra of 200nM his-ACBP (solid) and 200nM ACBP (dashed) with excitation at 280 nm. D. Fluorescence emission spectra of 200nM his-ACBP (solid) and 200nM ACBP (dashed) with excitation at 295 nm.
Taken together, these data indicate that addition of the his-tag to ACBP did not alter secondary structure and minimally altered the Try and Trp orientation of this protein.
Determination of ligand binding affinity and specificity of his-ACBP: fluorescence binding assay with a cis-parinaroyl-CoA and cis-parinaric acid
Since modifications of the N-terminus of ACBP are known to alter ligand binding affinity and function (rev. [14], it was important to determine the effect of C-terminal modification by the his-tag. His-ACBP exhibited saturation binding upon addition of increasing amounts of cis-parinaroyl-CoA (cPNCoA), a naturally-occurring fluorescent long chain fatty acyl CoA (representative binding curve, Fig. 3A). Analysis of multiple binding curves showed that his-ACBP had high affinity for cPNCoA (Kd=2.15 ± 0.89 nM,). However, his-ACBP did not exhibit saturation binding of the free fatty acid form, cis-parinaric acid (cPNA, inset of Fig. 3A). The affinity and specificity of his-ACBP for cPNCoA and lack of saturation binding with cPNA were consistent to that seen with endogenous and recombinant ACBP with native amino acid sequence [4], indicating that the C-terminal his-tag did not significantly change ligand affinity or specificity of the protein.
Figure 3. Affinity and number of binding sites of his-ACBP with cis-parinaroyl-CoA (cPNCoA) and cis-parinaric acid (cPNA).

Scatter plot and curve fitting of maximal fluorescence intensity (ex 310 nm, em 410 nm) with increasing of cPNCoA (A) and cPNA (A inset) in presence of 30nM his-ACBP. Reverse titrations of constant amounts (50nM) of cPNCoA (B) and cPNA (B inset) with increasing concentrations of his-ACBP indicated saturation at a molar ratio of 1 with cPNCoA, and nonspecific binding for cPNA. C. UV spectra of cPNCoA (4 μM) in potassium phosphate buffer pH 7.4 (solid), cPNCoA spectra with increasing his-ACBP (0.4-16 μM) are represented by dashed and dotted lines. D. Ratios of absorbance of valley 1 (V1)/peak 2 (P2) from spectra in C plotted vs protein/ligand molar ratio. E. Wavelengths of peak 2 (P2) in C plotted vs protein/ligand molar ratio.
Number of ligand binding sites in his-ACBP: reverse titration
Native ACBP, and recombinant ACBP with native amino acid sequence [4] both have a single ligand binding site. To determine the number of ligand binding sites in his-ACBP, a constant amount of ligand was titrated with increasing concentrations of protein by two independent reverse titration methods:
First, fluorescence emission spectra of bound ligand were obtained with increasing protein. This reverse titration of cPNCoA showed an increase in maximal fluorescence emission intensity with excitation at 310 nm when plotted against an increasing molar ratio of added his-ACBP (representative curve, Fig. 3B). Binding saturation occurred at a molar ratio of 1, demonstrating that his-ACBP had a single cPNCoA binding site per his-ACBP molecule. The same experiment using non-esterified cis-parinaris acid (cPNA) indicated only nonspecific binding of cPNA to his-ACBP (Inset of Fig. 3B).
Second, changes in absorbance spectral parameters of cPNCoA in the presence of increasing concentrations of his-ACBP were measured (Methods). Cis-parinaroyl-CoA, the CoA thioester of cis-parinaric acid, changed its absorbance spectral parameters when bound to his-ACBP (Fig. 3C). The UV absorbance spectra of cPNCoA in the absence of his-ACBP (Fig. 3C, upper solid line) and in the presence of increasing concentrations of his-ACBP (Fig. 3C, lower dashed lines, shorter dashes corresponding to higher concentrations of protein) exhibited three major peaks (P1, P2, P3) and two valleys (V1, V2). Increasing concentrations of his-ACBP reduced absorbance of all three peaks of cPNCoA and red-shifted wavelengths of the absorption maxima: from 294 nm to 297 nm for peak 1, from 307 to 311 nm for peak 2, and from 321 to 326 nm for peak 3 (Fig. 3C). When ratios of absorption intensities at V1 to P2 were plotted versus his-ACBP to cPNCoA molar ratio (Fig. 3D), a single maximum at molar ratio of 1 was obtained, indicating a single ligand binding site per protein molecule. This ratio was confirmed by plotting the wavelength values corresponding to P2 versus his-ACBP to cPNCoA molar ratio (Fig. 3E), which demonstrated a red shift up to molar ratio of 1, and no further shifting beyond 1, again indicating one cPNCoA molecule bound per protein. In a similar experiment using cPNA (data not shown), neither cPNA absorption maximal intensities nor the wavelengths of these maxima were altered in the presence of his-ACBP. These differences between cPNCoA and cPNA in their spectral parameter changes with his-ACBP point out that his-ACBP specifically binds one long chain fatty acyl-CoA at one binding site, but had no specific binding site for the corresponding unesterified fatty acid
In summary, his-ACBP had a single binding site with specificity for cPNCoA, but not cPNA, consistent with endogenous (native) ACBP and recombinant ACBP containing native amino acid sequence, both of which had one ligand binding site with specificity for fatty acyl CoA, but not free fatty acid [4]. Thus the presence of the C-terminal his-tag did not alter the number of ligand binding sites or ligand specificity in the ACBP molecule.
Structural and functional characterization of small fluorophore -labeled his-ACBP
His-ACBP was fluorescent labeled with Cy5 (Methods). Absorbance and fluorescence parameters of the dye were not altered by coupling to his-ACBP (data not shown). Mass spectrometric analysis demonstrated that each his-ACBP molecule was covalently labeled with 1-2 dye molecules (not shown). Chemical labeling of his-ACBP with Cy5 did not result in intermolecular cross-linkage, as demonstrated by SDS-PAGE (Fig. 4A). Likewise, chemical labeling of his-ACBP with Cy5 did not result in altered antigenicity as demonstrated by western-blotting with anti-mouse ACBP (Fig. 4B).
Figure 4. Structural and functional characterization of Cy5-labeled his-ACBP.
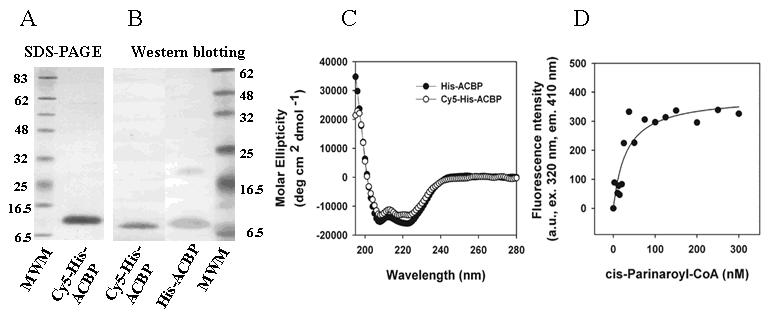
A. SDS-PAGE of Cy5-his-ACBP and his-ACBP. B. Western blotting of Cy5-his-ACBP and his-ACBP, 500ng of protein per lane. C. Far UV CD spectrum of his-ACBP and Cy5-his-ACBP. All CD studies were performed with 4μM protein. D. Titration and binding curve of Cy5-his-ACBP with cis-parinaroyl-CoA.
To determine structural and functional properties, Cy5-his-ACBP was examined by circular dichroism (CD) and ligand binding. CD spectra of Cy5-his-ACBP and his-ACBP were very similar (representative spectra, Fig. 4C). While quantitative analysis of secondary structure composition (α-helix, β-sheet, turn, random coil) were basically unchanged by Cy5 labeling, Cy5-his-ACBP exhibited a somewhat reduced binding affinity for cPNCoA (Kd =30.9 nM, Fig. 4D) as compared to unlabeled his-ACBP. Nevertheless, the Kd remained in the low nanomolar range, indicating significantly strong binding, as seen with endogenous and recombinant ACBP [4]. Similar studies were run on Cy3-labeled-HNF-4α, demonstrating that a dye:protein molar ratio of 1:1 ensured protein secondary structure and ligand affinity preservation (data not shown).
ACBP binding with hepatic nuclear factor 4α (HNF4α) by fluorescence resonance energy transfer (FRET)
While interaction of ACBP and HNF4α has been inferred by indirect methods [31], direct interaction and binding affinity remained to be shown. To more directly demonstrate binding between these proteins, a new in vitro FRET assay was developed to measure their affinity and intermolecular distance. HNF-4α and his-ACBP were labeled with a FRET-pair of fluorophores: Cy3 (FRET donor) and Cy5 (FRET acceptor), respectively, and Cy5-ACBP was used as a control. A constant amount of Cy3-HNF-4α was then titrated with increasing concentrations of Cy5-his-ACBP or Cy5-ACBP. At each titration point, Cy3-HNF-4α was excited (500 nm) and the fluorescence emission spectra of Cy3-HNF-4α and Cy5-his-ACBP were measured (Methods). Adding increasing concentrations of Cy5-his-ACBP, reduced fluorescence emission intensity of Cy3-HNF-4α(Fig. 5A), while Cy5-his-ACBP sensitized emission intensity increased (Fig. 5B). Diminished donor emission concomitant with increased acceptor sensitized emission indicates energy transfer during binding (FRET) due to close molecular proximity and molecular interaction of the two proteins.
Affinity (Kd) of binding between his-ACBP and HNF-4α was determined by plotting maximum fluorescence emission intensities of Cy3 (Fig. 5A, inset) and Cy5 (Fig. 5B, inset) against Cy5-his-ACBP concentrations and curve-fitting the scatter plots. The resultant binding curves best fit one-site binding indicating a Kd=111.4 nM (Table 1). From the sensitized emission spectra, a Kd=64.4 nM was obtained. These affinities are similar to those obtained for FRET between ACBP and HNF-4α (Table 1).
Table I. Binding affinity and FRET parameters for interaction between Cy3-HNF4α and Cy5-his-ACBP or Cy5-ACBP.
| Cy3 Quenching | Cy5 Sensitized emission | |||
|---|---|---|---|---|
| Interacting proteins | Kd (nM) | R2/3 (Å) | Kd (nM) | R2/3 (Å) |
| Cy3-HNF4α + Cy5-his-ACBP | 111.4 ± 10.2 | 73.4 ± 6.5 | 64.4 ± 4.3 | 74.0 ± 6.7 |
| Cy3-HNF4α + Cy5-ACBP | 137.0 ± 11.3 | 63.8 ± 2.6 | 28.4 ± 1.6 | 58.0 ± 5.9 |
| Cy3-βGalactosidase + Cy5-his-ACBP | 5700 ± 450 | ≫100 | 5900 ±520 | ≫100 |
All parameters were calculated from FRET curves as presented in Fig. 5 (Methods). Kd, dissociation constant in nM; R2/3, actual distance between Cy3 donor molecules on HNF4α and Cy5 acceptor molecules on ACBP, in angstroms. SD values from n=3.
The emission spectra also allowed calculation of intermolecular distances between Cy3-HNF-4α and Cy5-ACBP, which were 64 Å and 58 Å, as calculated from Cy3 quenching and Cy5 sensitized emission, respectively (Table 1). The distance between Cy3-HNF-4αand Cy5-his-ACBP, 73 Å to 74 Å, also showed close molecular interaction, although slightly further apart than for the ACBP without the his-tag (Table 1). Similar experiments performed with Cy5-his-ACBP binding to Cy3-β-galactosidase as negative control resulted in significantly less binding (probably nonspecific binding) as demonstrated by: weak quenching (Fig. 5C), nearly linear instead of a hyperbolic titration curve (Fig. 5C, inset), three orders of magnitude weaker affinity (Kd near 6 μM, Table 1), and an intermolecular distance greater than 100 Å. Thus, insertion of a his tag at the C-terminus of ACBP did not disrupt interaction with HNF-4α.
ACBP interaction with microsomal enzymes stimulating formation of fatty acyl CoA (ACS) and utilization of fatty acyl CoA (GPAT)
ACBP stimulates not only the formation of fatty acyl CoA by microsomal acyl CoA synthase (ACS) [19], but also the transacylation of fatty acyl CoA to phosphatidic acid by glycerol-3-phosphate acyltransferase (GPAT), the rate limiting step in glyceride synthesis [20]. Therefore, the effect of the C-terminal his tag on the ability of ACBP to stimulate GPAT and ACS was examined. As expected, ACBP significantly enhanced the activity of GPAT and ACS (Table 2). Likewise, his-ACBP similarly enhanced microsomal GPAT and ACS activity (Table 2). In both cases the effects of his-ACBP vs ACBP were not significantly different.
Table 2. Effect of his-tagging on ACBP enhancement of microsomal glycerol-3-phosphate acyltransferase (GPAT) and acyl CoA synthetase (ACS).
| ACBP | μM | GPAT (pmol/min/mg microsomal protein) | ACS (% fatty acid converted to fatty acyl CoA) |
|---|---|---|---|
| None | 176 ± 22 | 21.6 ± 0.4 | |
| ACBP | 10 | 564 ± 118 | ND |
| ACBP | 20 | 574 ± 79 | 30.8 ± 0.1 |
| His-ACBP | 10 | 620 ± 128 | ND |
| His-ACBP | 20 | 628 ± 56 | 30.0 ± 0.6 |
ND, not determined. Values represent the Mean ± SE, n=3 or 4.
In summary, a one-step method for higher yield and less labor-intensive production of large quantities of ACBP was developed. Mouse recombinant ACBP with C-terminal his tag was produced. The C-terminal his-tag did not significantly alter ACBP structure, ligand binding, or interaction with other protein functions. FRET analysis between Cy5-His-ACBP and Cy3-HNF4α established for the first time that ACBP forms a high affinity (Kd=64-111 nM) complex (intermolecular distance near 73 Å) with the nuclear receptor HNF-4α in vitro. To our knowledge these data represent the first demonstration of high-affinity direct binding between a nuclear receptor and a soluble lipid binding protein. The functional significance of these in vitro findings is underscored by the fact that the small size of ACBP (10kDa) allows this protein to readily pass through nuclear pores (accommodate molecules as large as 40-50 kDa) for interaction with and transactivation of HNF-4α [31]. Thus, the mouse recombinant ACBP with C-terminal his tag should be suitable for screening ligands, chemical labeling, determining interactions with other proteins, uptake into living cells (facilitated by polyarginine peptides or microinjection), and imaging of ACBP intracellular targeting and interactions with other proteins in living cells.
Acknowledgements
This work was supported in part by the USPHS, NIH DK41402 (FS, ABK), NIH K99 award DK77573 (HAH), and GM72041 (Project 2, ABK,FS). We thank Aude Vespa for technical help.
Abbreviations
- ACBP
acyl coenzyme A binding protein
- FRET
fluorescence resonance energy transfer
- HNF-4α
hepatocyte nuclear factor-4α
- LCFA
long chain fatty acid
- LCFA-CoA
long chain fatty acyl CoA.
Footnotes
Publisher's Disclaimer: This is a PDF file of an unedited manuscript that has been accepted for publication. As a service to our customers we are providing this early version of the manuscript. The manuscript will undergo copyediting, typesetting, and review of the resulting proof before it is published in its final citable form. Please note that during the production process errors may be discovered which could affect the content, and all legal disclaimers that apply to the journal pertain.
REFERENCES
- 1.Abo-Hashema KAH, Cake MH, Lukas MA, Knudsen J. The interaction of acyl CoA with acyl CoA binding protein and carnitine palmitoyltransferase I. Int. J. Biochem. & Cell Biol. 2001;33:807–815. doi: 10.1016/s1357-2725(01)00049-8. [DOI] [PubMed] [Google Scholar]
- 2.Berde CB, Hudson BS, Simoni RD, Sklar LA. Human serum albumin. Spectroscopic studies of binding and proximity relationships for fatty acids adn bilirubin. J. Biol. Chem. 1979;254:391–400. [PubMed] [Google Scholar]
- 3.Bhuiyan AKMJ, Pande SV. Carnitine palmitoyltransferase activies: effects of serum albumin, ACBP, and FABP. Mol. Cell. Biochem. 1994;139:109–116. doi: 10.1007/BF01081733. [DOI] [PubMed] [Google Scholar]
- 4.Chao H, Martin G, Russell WK, Waghela SD, Russell DH, Schroeder F, Kier AB. Membrane charge and curvature determine interaction with acyl CoA binding protein (ACBP) and fatty acyl CoA targeting. Biochemistry. 2002;41:10540–10553. doi: 10.1021/bi0259498. [DOI] [PubMed] [Google Scholar]
- 5.Chao H, Zhou M, McIntosh A, Schroeder F, Kier AB. Acyl CoA binding protein and cholesterol differentially alter fatty acyl CoA utilization by microsomal acyl CoA: cholesterol transferase. J. Lipid Res. 2003;44:72–83. doi: 10.1194/jlr.m200191-jlr200. [DOI] [PubMed] [Google Scholar]
- 6.Chapkin RS, Clark AE, Davidson LA, Schroeder F, Zoran DL, Lupton JR. Dietary fiber differentially alters cellular fatty acid binding protein expression in exfoliated colonocytes during tumor development. Nutrition and Cancer. 1998;32:107–122. doi: 10.1080/01635589809514727. [DOI] [PubMed] [Google Scholar]
- 7.Compton LA, Johnson WC., Jr. Analysis of protein circular dichroism spectra for secondary structure using a simple matrix multiplication. Analytical Biochemistry. 1986;155:155–167. doi: 10.1016/0003-2697(86)90241-1. [DOI] [PubMed] [Google Scholar]
- 8.Faergeman NJ, Knudsen J. Role of long-chain fatty acyl-CoA esters in the regulation of metabolism and in cell signalling. Biochem. J. 1997;323:1–12. doi: 10.1042/bj3230001. [DOI] [PMC free article] [PubMed] [Google Scholar]
- 9.Faergeman NJ, Knudsen J. Acyl CoA binding protein is an essential protein in mammalian cell lines. Biochem. J. 2002;368:679–682. doi: 10.1042/BJ20021413. [DOI] [PMC free article] [PubMed] [Google Scholar]
- 10.Faergeman NJ, Sigurskjold BW, Kragelund BB, Andersen KV, Knudsen J. Thermodynamics of ligand binding to acyl-coenzyme A binding protein studied by titration calorimetry. Biochemistry. 1996;35:14118–14126. doi: 10.1021/bi960545z. [DOI] [PubMed] [Google Scholar]
- 11.Faergeman NJ, Wadum MCT, Feddersen S, Burton BB, Knudsen J. Acyl CoA binding proteins: structural and functional conservation over 2000 MYA. Mol. Cell. Biochem. 2006 doi: 10.1007/s11010-005-9040-3. in press. [DOI] [PubMed] [Google Scholar]
- 12.Frolov AA, Schroeder F. Acyl coenzyme A binding protein: conformational sensitivity to long chain fatty acyl-CoA. J. Biol. Chem. 1998;273:11049–11055. doi: 10.1074/jbc.273.18.11049. [DOI] [PubMed] [Google Scholar]
- 13.Gaigg B, Neergard TB, Schneiter R, Hansen JK, Faergeman NJ, Jensen NA, Andersen JR, Friis J, Sandhoff K, Knudsen J. Depletion of acyl CoA binding protein affects sphingolipid synthesis and causes vesicle accumulation and membrane defects in S. cerevisiae. Mol. Biol. Cell. 2001;12:1147–1160. doi: 10.1091/mbc.12.4.1147. [DOI] [PMC free article] [PubMed] [Google Scholar]
- 14.Gossett RE, Edmondson RD, Jolly CA, Cho TH, Russell DH, Knudsen J, Kier AB, Schroeder F. Structure and function of normal and transformed murine acyl CoA binding proteins. Arch. Biochem. Biophys. 1998;350:201–213. doi: 10.1006/abbi.1997.0521. [DOI] [PubMed] [Google Scholar]
- 15.Gossett RE, Frolov AA, Roths JB, Behnke WD, Kier AB, Schroeder F. Acyl Co A binding proteins: multiplicity and function. Lipids. 1996;31:895–918. doi: 10.1007/BF02522684. [DOI] [PubMed] [Google Scholar]
- 16.Gossett RE, Schroeder F, Gunn JM, Kier AB. Expression of fatty acyl CoA binding proteins in colon cells: response to butyrate and transformation. Lipids. 1997;32:577–585. doi: 10.1007/s11745-997-0073-5. [DOI] [PubMed] [Google Scholar]
- 17.Hellendie T, Grontved L, Jensen SS, Kiilerich P, Rietveld L, Albrektsen T, Boysen MS, Nohr J, Larsen LK, Fleckner J, Stunnenberg HG, Kristiansen K, Mandrup S. The gene encoding the acyl CoA binding protein is activated by peroxisome proliferator activated receptor gamma through an intronic response element functionally conserved between humans and rodents. J. Biol. Chem. 2002;277:26821–26830. doi: 10.1074/jbc.M111295200. [DOI] [PubMed] [Google Scholar]
- 18.Huang H, Atshaves BP, Frolov A, Kier AB, Schroeder F. Acyl-coenzyme A binding protein expression alters liver fatty acyl coenzyme A metabolism. Biochemistry. 2005;44:10282–10297. doi: 10.1021/bi0477891. [DOI] [PubMed] [Google Scholar]
- 19.Jolly CA, Hubbell T, Behnke WD, Schroeder F. Fatty acid binding protein: stimulation of microsomal phosphatidic acid formation. Arch. Biochem. Biophys. 1997;341:112–121. doi: 10.1006/abbi.1997.9957. [DOI] [PubMed] [Google Scholar]
- 20.Jolly CA, Murphy EJ, Schroeder F. Differential influence of rat liver fatty acid binding protein isoforms on phospholipid fatty acid composition: phosphatidic acid biosynthesis and phospholipid fatty acid remodeling. Biochim. Biophys. Acta. 1998;1390:258–268. doi: 10.1016/s0005-2760(97)00186-0. [DOI] [PubMed] [Google Scholar]
- 21.Jolly CA, Wilton DA, Schroeder F. Microsomal fatty acyl CoA transacylation and hydrolysis: fatty acyl CoA species dependent modulation by liver fatty acyl CoA binding proteins. Biochim. Biophys. Acta. 2000;1483:185–197. doi: 10.1016/s1388-1981(99)00170-5. [DOI] [PubMed] [Google Scholar]
- 22.Kenworthy AK. Imaging protein-protein interactions using fluorescence resonance energy transfer microscopy. Methods. 2001;24:289–296. doi: 10.1006/meth.2001.1189. [DOI] [PubMed] [Google Scholar]
- 23.Knudsen J, Faergeman NJ, Skott H, Hummel R, Borsting C, Rose TM, Andersen JS, Hojrup P, Roepstorff P, Kristiansen K. Yeast acyl-CoA-binding protein: acyl-CoA-binding affinity and effect on intracellular acyl-CoA pool size. Biochem. J. 1994;302:479–485. doi: 10.1042/bj3020479. [DOI] [PMC free article] [PubMed] [Google Scholar]
- 24.Laemmli UK. Cleavage of structural proteins during the assembly of the head of bacteriophage T4. Nature (London) 1970;227:680–685. doi: 10.1038/227680a0. [DOI] [PubMed] [Google Scholar]
- 25.Lee BC, Cha K, Avraham HK. Microarray analysis of differentiallly expressed genes associated with human ovarian cancer. Int. J. Cancer. 2004;24:847–851. [PubMed] [Google Scholar]
- 26.Mandrup S, Jepsen R, Skott H, Rosendal J, Hojrup P, Kristiansen K, Knudsen J. Effect of heterologous expression of acyl-CoA-binding protein on acyl-CoA level and composition in yeast. Biochem. J. 1993;290:369–374. doi: 10.1042/bj2900369. [DOI] [PMC free article] [PubMed] [Google Scholar]
- 27.Mandrup S, Sorensen RV, Hellendie T, Nohr J, Baldursson T, Gram C, Knudsen J, Kristiansen K. Inhibition of 3T3-L1 adipocyte differentiation by expression of ACBP anti-sense RNA. J. Biol. Chem. 1998;273:23897–23903. doi: 10.1074/jbc.273.37.23897. [DOI] [PubMed] [Google Scholar]
- 28.Neess D, Kiilerich P, Sandberg MB, Hellendie T, Nielsen R, Mandrup S. ACBP-, a PPAR and SREBP modulated housekeeping gene. Mol. Cell. Biochem. 2006;284:149–157. doi: 10.1007/s11010-005-9039-9. [DOI] [PubMed] [Google Scholar]
- 29.Petrescu A, Huang H, Hertz R, Bar-Tana J, Schroeder F, Kier AB. Role of regulatory F-domain in hepatocyte nuclear factor-4alpha ligand specificity. J. Biol. Chem. 2005;280:16714–16727. doi: 10.1074/jbc.M405906200. [DOI] [PubMed] [Google Scholar]
- 30.Petrescu AD, Hertz R, Bar-Tana J, Schroeder F, Kier AB. Ligand specificity and conformational dependence of the hepatic nuclear factor-4alpha (HNF-4a) J. Biol. Chem. 2002;277:23988–23999. doi: 10.1074/jbc.M201241200. [DOI] [PubMed] [Google Scholar]
- 31.Petrescu AD, Payne HR, Boedeker AL, Chao H, Hertz R, Bar-Tana J, Schroeder F, Kier AB. Physical and functional interaction of acyl CoA binding protein (ACBP) with hepatocyte nuclear factor-4alpha (HNF4alpha) J. Biol. Chem. 2003;278:51813–51824. doi: 10.1074/jbc.M303858200. [DOI] [PubMed] [Google Scholar]
- 32.Pfanner N, Glick BS, Arden SR, Rothman JE. Fatty acylation promotes fusion of transport vesicles with Golgi cisternae. J. Cell Biol. 1990;110:955–961. doi: 10.1083/jcb.110.4.955. [DOI] [PMC free article] [PubMed] [Google Scholar]
- 33.Pfanner N, Orci L, Glick BS, Amherdt M, Arden SR, Malhotra V, Rothman JE. Fatty acyl CoA is required for budding of transport vesicles from Golgi cisternae. Cell. 1989;59:95–102. doi: 10.1016/0092-8674(89)90872-6. [DOI] [PubMed] [Google Scholar]
- 34.Rasmussen JT, Rosendal J, Knudsen J. Interaction of acyl-CoA binding protein (ACBP) on processes for which acyl-CoA is a substrate, product or inhibitor. Biochem. J. 1993;292:907–913. doi: 10.1042/bj2920907. [DOI] [PMC free article] [PubMed] [Google Scholar]
- 35.Sandberg MB, Bloksgaard M, Duran-Sandoval D, Duval C, Staels B, Mandrup S. The gene encoding for ACBP is subject ot metabolic regulatio by both SREBP and PPAR-alpha in hepatocytes. J. Biol. Chem. 2005;280:5258–5266. doi: 10.1074/jbc.M407515200. [DOI] [PubMed] [Google Scholar]
- 36.Schjerling CK, Hummel R, Hansen JK, Borsting C, Mikkelsen J, Kristiansen K, Knudsen J. Disruption of the gene encoding the acyl-CoA-binding protein (ACB1) Perturbs acyl-CoA metabolism in Saccharomyces cerevisiae. J. Biol. Chem. 1996;271:22514–22521. doi: 10.1074/jbc.271.37.22514. [DOI] [PubMed] [Google Scholar]
- 37.Schroeder F, Huang H, Hostetler HA, Petrescu AD, Hertz R, Bar-Tana J, Kier AB. Stability of fatty acyl CoA thioester ligands of hepatocyte nuclear factor -4alpha and peroxisome proliferator-activated receptor alpha. Lipids. 2005;40:559–568. doi: 10.1007/s11745-005-1416-y. [DOI] [PubMed] [Google Scholar]
- 38.Sreerama N, Woody RW. Structural composition of beta-I and beta-II proteins. Protein Science. 2003;12:384–388. doi: 10.1110/ps.0235003. [DOI] [PMC free article] [PubMed] [Google Scholar]
- 39.Swinnen JV, Alen P, Heyns W, Verhoenen G. Identification of Diazepam-binding Inhibitor/Acyll-CoA-binding Protein as a Sterol Regulatory Element-binding Protein-responsive. J Biol Chem. 1998;273:19938–19944. doi: 10.1074/jbc.273.32.19938. [DOI] [PubMed] [Google Scholar]
- 40.Swinnen JV, Esquenet M, Rosseels J, Claessens F, Rombauts W, Heyns W, Verhoeven G. A human gene encoding diazepam-binding inhibitor/acyl-CoA binding protein: transcription and hormonal regulation in the androgen-sensitive human prostatic adenocarcinoma cell line LNCaP. DNA Cell Biol. 1996;15:197–208. doi: 10.1089/dna.1996.15.197. [DOI] [PubMed] [Google Scholar]
- 41.Yang Y, Pritchard PH, Bhuiyan J, Seccombe DW, Moghadasian MH. Overexpression of acyl CoA binding protein and its effects on the flux of free fatty acids in McA-RH 7777 cells. Lipids. 2001;36:595–600. doi: 10.1007/s11745-001-0762-0. [DOI] [PubMed] [Google Scholar]