

Abstract
To determine the role of intracellular Ca2+ in compaction, the first morphogenetic event in embryogenesis, we analyzed preimplantation mouse embryos under several decompacting conditions, including depletion of extracellular Ca2+, blocking of Ca2+ channels, and inhibition of microfilaments, calmodulin, and intracellular Ca2+ release. Those treatments induced decompaction of mouse morulae and simultaneously induced changes in cytosolic free Ca2+ concentration and deregionalization of E-cadherin and fodrin. When morulae were allowed to recompact, the location of both proteins recovered. In contrast, actin did not change its cortical location with compaction nor with decompaction-recompaction. Calmodulin localized in areas opposite to cell–cell contacts in eight-cell stage embryos before and after compaction. Inhibition of calmodulin with trifluoperazine induced its delocalization while morulae decompacted. A nonspecific rise of intracellular free Ca2+ provoked by ionomycin did not affect the compacted shape. Moreover, the same decompacting treatments when applied to uncompacted embryos did not produce any change in intracellular Ca2+. Our results demonstrate that in preimplantation mouse embryos experimentally induced stage-specific changes of cell shape are accompanied by changes of intracellular free Ca2+ and redistribution of the cytoskeleton-related proteins E-cadherin, fodrin, and calmodulin. We conclude that intracellular Ca2+ specifically is involved in compaction and probably regulates the function and localization of cytoskeleton elements.
Extracellular calcium is crucial during the preimplantation development of mammalian embryos because of its role in cell–cell adhesion (1–5). Intracellular free calcium ([Ca2+]i) plays a pivotal role in triggering early events related to fertilization, namely, oocyte maturation, cortical granule exocytosis, and egg activation (6–19). However, little is known about the role of [Ca2+]i during the following steps of mammalian development. Indirect evidence for a regulatory role was provided in experiments where development of mouse embryos was delayed by treatments with calcium channel blockers or with an inhibitor of calmodulin (20). It was only recently that [Ca2+]i changes were studied directly during early mouse development. An endogenous increase in Ca2+-releasing activity leading to Ca2+ transients was observed during the first mitotic division (21). Moreover, the rate of cavitation and cell division was either accelerated or delayed by experimentally induced elevation or reduction of [Ca2+]i, respectively (22–24). Stacheki and Armant (24) suggested that in mouse embryos, inositol 1,4,5-trisphosphate-sensitive and ryanodine-sensitive Ca2+ stores exist at the morula stage and that calmodulin is involved in mediating the Ca2+ signaling effects to its distal targets.
Despite these temporal effects, no other developmental events have been examined so far under conditions where [Ca2+]i has been manipulated and therefore the physiological significance of [Ca2+]i during early development is currently unknown.
Besides cell divisions the main features of preimplantation mouse development are compaction and blastulation of the morula. Throughout this period the embryo differentiates and two cell populations can be recognized in the blastocyst, the inner cell mass, and the trophoblast. The differentiation of the trophoblast into an epithelium starts with the process of compaction. Compaction, a crucial event of early development, occurs within 2–3 hr at the eight-cell stage, when loosely associated blastomeres flatten against each other. Thereby the intercellular space is reduced and the contour of the embryo changes from lobulated to spherical (25). During compaction a number of cellular changes occur within the embryo that ensure the subsequent establishment of the trophectoderm (26–28). These changes include the formation of tight junctions (29, 30), gap junctions (31, 32), and cytoskeletal connections (33) between blastomeres, as well as regionalization of different cytoskeletal components and enzymes at the cell contacts generating spatial heterogenity and polarity of the embryo (34–39). Furthermore, it has been demonstrated that compaction is mediated by microfilaments, microtubules (40–43), protein kinase C (44), and E-cadherin (2–4), a transmembrane calcium-dependent cell adhesion glycoprotein anchored to the cytoskeleton through catenins (45, 46). Because cycloheximide does not inhibit compaction it is assumed that the process depends on the rearrangement of existing proteins rather than on their synthesis (47).
A number of reports suggest that one of the main cellular effectors of [Ca2+]i is the cytoskeleton. For example, Ca2+/calmodulin regulates the assembly of microtubules and the link of actin to microtubules (48–55).
Here, we hypothesize that [Ca2+]i is involved in preimplantation mouse development by regulating the function and localization of cytoskeleton elements. The process of compaction provides an excellent model to test this hypothesis. To study the role of [Ca2+]i during compaction we used the well-established decompacting-recompacting assay, which is based on the fact that this process can be experimentally reversed (20, 29, 40, 42, 56), in combination with calcium imaging techniques. We find that various decompacting treatments induced increase of [Ca2+]i. Simultaneously, deregionalization of E-cadherin, fodrin, and calmodulin occurred. The results support our hypothesis that the mechanism to maintain the compacted shape is regulated by [Ca2+]i, presumably acting on the cytoskeleton.
MATERIALS AND METHODS
Collection and Culture of Embryos.
Mouse embryos were obtained from CF1 or ICR females mated with males of the same strain. Female mice were superovulated by i.p. injections with 5 units of pregnant mares’ serum gonadotrophin (Sigma) and 44 hr later with 4 units of human chorionic gonadotropin (hCG; Sigma). After the hCG injection, females were placed in cages with males and examined the next morning for the presence of vaginal plugs. Animals were killed by cervical dislocation. Embryos were flushed at 48 hr post-hCG from the oviduct with M 2 medium (57) supplemented with 4 mg/ml BSA (Sigma). They were cultured in microdrops of M 16 supplemented medium (57) under mineral oil in an humidified atmosphere of 5% CO2 in air at 37°C until the required stage of development was reached.
Treatments.
Batches of 65-hr post-hCG embryos were monitored every 15 min under an inverted light microscope to score compaction. To have synchronized populations, only embryos that compacted within 1 hr were selected and used for each decompacting assay. In the decompacting experiments, the end of the period of selection is time zero postcompaction (approximately 68 hr post-hCG). All experiments were performed with groups of more than 20 embryos and repeated four times. The media used were M 16 for conventional light microscopy to monitor compaction or M 2 for laser scanning confocal microscopy and calcium imaging. Both M 16 and M 2 contained 1.71 mM calcium. Embryos were exposed to the following treatments: medium in which sodium replaces calcium containing 0.5 mM EGTA; medium in which calcium concentration had been reduced to 0.171 mM containing 0.3 mM verapamil; and medium containing 0.5 μg/ml cytochalasin D (CCD), 0.1–100 μM trifluoperazine (TFP), 100 μg/ml 3,4,5-trimethoxybenzoic acid 8-(diethylamino)octyl ester (TMB-8), and 1 μM ionomycin. In some of the treatments the medium contained 0.1% dimethyl sulfoxide, which alone did not affect development or [Ca2+]i in control experiments. All reagents were obtained from Sigma.
Calcium Imaging.
The zona pellucida was removed with Tyrode′s acid solution (Sigma) at 69 hr post-hCG, and embryos then were allowed to recover under normal culture conditions for at least 3 hr. To load blastomeres with the fluorescent calcium indicator, uncompacted or compacted morulae were incubated at 37°C for 1 hr in M 16 medium containing 10 μM of the cell-permeant acetoxymethyl ester form of fluo-3 (fluo-3-AM, Molecular Probes) and 0.02% pluronic F127 (Molecular Probes). Loaded embryos developed normally until blastula stage, indicating that [Ca2+]i chelated by fluo-3 was below the requirements for compaction, cell division, and cavitation. Embryos loaded with fluo-3 were allowed to attach to the dish in M 2 medium until M 2 medium supplemented with BSA was added. Specimens were viewed by using water immersion objectives (×20 numerical aperture 0.4 or ×40, numerical aperture 0.75, Zeiss) in a BioRad MRC-600 laser scanning confocal unit mounted over a Nikon Optiphot upright microscope. A krypton-argon laser was used for excitation at 488 nm, and signals emitted above 515 nm wavelength were collected. A perfusion system was used to change the medium during the experiments. During the observations, temperature was maintained at 37°C with a heat-controlled stage.
Images of temporal series (BioRad software version 4.61) were acquired by using minimum laser power and time exposure to avoid cell damage. As a control at the end of each experiment, the embryos were cultivated until blastulation was observed. Because fluo-3 is a nonratioable dye and its fluorescence increases nonlinearly with the level of [Ca2+]i, we used fluo-3 fluorescence signals as a semiquantitative indication of relative changes of [Ca2+]i (increase or decrease) though not to estimate absolute [Ca2+]i (58). In control experiments the distribution of the fluorescent probe was examined by the exposure of loaded embryos to digitonin 0.1%; the homogeneous decrease of the signal indicated that fluo-3 was not compartimentalized in the blastomeres. To detect changes of [Ca2+]i, fluo-3-loaded embryos were observed by time lapse. The appropriate frequency of observations (30 sec for ionomycin, 1 min for EGTA and verapamil, and 2 min for CCD, TFP, and TMB-8) was determined in preliminary experiments. During acquisition of calcium images, decompaction was monitored continuously by light microscopy. After data acquisition, representative images from the start, middle, and end of the decompaction process were selected. The intensity of the fluorescence is shown in a pseudocolor scale with blue representing low [Ca2+]i and red representing high [Ca2+]i.
Immunofluorescence.
Untreated or treated embryos were fixed for 1 hr at room temperature (RT) in 3.7% paraformaldehyde in M 2 culture medium. After washing, fixed embryos were incubated for 1 hr with 0.1 M glycine in PBS with 0.3 mg/ml BSA (PBS-BSA). Cells were permeabilized for 15 min at RT in 0.1% Triton X-100 in PBS. After washing with PBS-BSA, specimens were processed for fluorescent double staining in the following combinations, E-cadherin and actin, E-cadherin and fodrin, and E-cadherin and calmodulin. The samples were incubated for 1 hr at 37°C with the appropriate first antibodies followed by 1-hr incubation at 37°C with second antibodies, or with rhodamin-phalloidin. A rat monoclonal anti-uvomorulin (1:100) was used to detect E-cadherin; a rabbit polyclonal anti-bovine fodrin (1:40) was used to detect fodrin (59); a goat polyclonal anti-calmodulin (1:100) was used to detect calmodulin, and tetramethylrhodamine B isothiocyanate (TRITC)-conjugated phalloidin (1:20) was used to detect actin. The second antibodies used were biotin-conjugated anti-rat IgG (1:40) followed by fluorescein isothiocyanate-conjugated extravidin (1:40), TRITC-conjugated anti-rabbit IgG (1:40), or TRITC-conjugated anti-goat IgG (1:40). For negative controls a monoclonal anti-glutamate receptor antibody or secondary antibodies alone were used. Unless otherwise noted, all reagents were obtained from Sigma. After incubations and washing steps, the zona pellucida was removed mechanically by gentle pipetting. Specimens were mounted onto slides and observed by laser scanning confocal microscopy (LSM 410, Zeiss) at 488 and 543 nm wavelengths.
RESULTS
Time Course of Decompaction.
Before the study of changes in [Ca2+]i and localization of E-cadherin, fodrin, actin, and calmodulin, the time course of decompaction caused by the various treatments was defined. To deplete extracellular calcium we used EGTA; to interfere with the intracellular calcium regulation we used a calcium channel blocker (verapamil), a calmodulin inhibitor (TFP), and an intracellular Ca2+ antagonist (TMB-8); to interfere with the cytoskeleton we used an inhibitor of microfilaments (CCD). Fig. 1 summarizes the time course of decompaction induced by these various treatments in synchronized populations of morulae. Calcium depletion of culture medium by EGTA (0.5 mM) or prevention of calcium influx with verapamil (0.3 mM), both induced complete decompaction within 15 min in all morulae observed (Fig. 1A). To obtain such an effect with verapamil, extracellular calcium was reduced from 1.71 mM to 0.171 mM, a concentration that did not affect compaction in control experiments. Calcium concentration in the medium diminished to 0.02 mM did not cause any effect on compaction. By using the microfilament inhibitor CCD (0.5 μg/ml), we observed complete decompaction only after 45 min (Fig. 1A).
Figure 1.

Effect of various treatments on compaction. Batches of more than 20 synchronized compacted mouse morulae were exposed at 2 hr postcompaction (approximately 70 hr post-hCG, see Materials and Methods) to (A) extracellular calcium deprivation with 0.5 mM EGTA (○), 0.3 mM verapamil (•), or 0.5 μg/ml CCD (x) or (B) 0.1 μM TFP (○), 1 μM TFP (•), 10 μM TFP (□), 100 μM TFP (■), 100 μg/ml TMB-8 (+), or 1 μM ionomycin (x). Arrows indicate the beginning of treatments. In A, drugs were applied the minimum time until decompaction of all embryos occurred (filled bar, EGTA and verapamil; empty bar, CCD), then embryos were allowed to recover in fresh normal medium and recompaction was scored.
After these treatments, embryos were allowed to recover in fresh, normal medium. Although recompaction occurred in all embryos observed, they differed in the time course of recompaction, varying from 15 min after CCD to 3–4 hr after EGTA and verapamil treatments (Fig. 1A). Decompaction also was observed in a dose-dependent manner by using TFP (0.1–100 μM) or TMB-8 (100 μg/ml) (Fig. 1B). Recompaction after these two treatments was very slow, and the embryos blastulated with delay, except at highest TFP concentration (100 μM), which inhibited blastulation. Only embryos that decompacted within less than 1 hr as an effect of 10 μM TFP or 100 μg/ml TMB-8 were used for calcium imaging and immunostaining. It is of note that the calcium ionophore ionomycin (1 μM) did not cause any effect on compaction (Fig. 1B).
Changes of Calcium During Decompaction.
To determine whether the various treatments used affect [Ca2+]i while inducing decompaction (Fig. 2A), we observed the process in fluo-3-loaded morulae by time-lapse laser scanning confocal microscopy. Chelating extracellular calcium by EGTA resulted in a sustained and rather homogeneous increase of [Ca2+]i during the process of decompaction (Fig. 2B). The samples were scanned through the z axes in different focal planes but no waves or initiation sites for the increase of calcium were detectable. As a consequence, the following measurements were made at a representative equatorial plane of the embryos. Decompaction with 0.3 mM verapamil induced a similar effect of increased [Ca2+]i, coincident with the time course of decompaction (Fig. 2C). When morulae were exposed to 10 μM TFP, [Ca2+]i started to increase immediately, reaching the highest level observed, although decompaction was slower compared with the other treatments (Fig. 2D). An increase of [Ca2+]i also was induced by decompacting morulae with 100 μg/ml TMB-8 (Fig. 2E). A different pattern of [Ca2+]i changes was observed when decompaction was produced by CCD; this treatment induced an initial increase of [Ca2+]i, peaking at 15 min, but was followed by a continuous decrease of [Ca2+]i to basal level (Fig. 2F).
Figure 2.
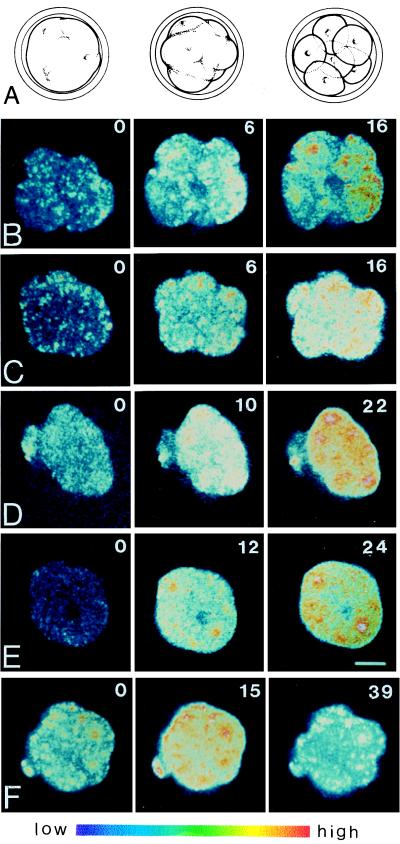
Changes of [Ca2+]i in response to decompacting treatments. Fluo-3-AM-loaded compacted morulae were observed by confocal microscopy to image changes of [Ca2+]i (B–F) while the state of compaction was monitored by transmitted light microscopy (A, diagram of the decompacting process). Embryos were exposed to extracellular calcium deprivation with 0.5 mM EGTA (B), 0.3 mM verapamil (C), 10 μM TFP (D), 100 μg/ml TMB-8 (E), and 0.5 μg/ml CCD (F). Numbers indicate time in min after treatment was applied. Note the higher fluorescence signals in nuclei of decompacting embryos. Experiments were repeated more than four times. The color bar indicates [Ca2+]i from low (blue) to high (red). (Bar = 25 μm.)
We observed that during decompaction the increase of the fluorescent calcium-signal in the nucleus was consistently exceeding that of the cytosol (e.g., Fig. 2 B and E), which is in line with findings in sea urchin embryos (16), mouse oocytes (17), and neurons (60).
No spontaneous changes of [Ca2+]i were detected in fluo-3-loaded morulae that were kept under control conditions and observed for 30 min (Fig. 3). Although the basal level of [Ca2+]i varied slightly between embryos, it was not related to the degree of compaction (Figs. 2 and 3A).
Figure 3.
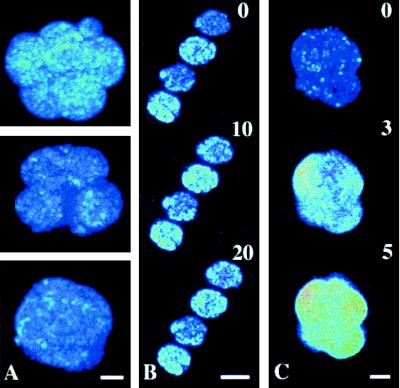
Confocal microscopy of fluo-3-AM-loaded morulae. The intensity of fluorescence slightly varied between resting embryos, but not in correlation with the stage of compaction (A). No changes in [Ca2+]i were detected in early uncompacted morulae exposed to extracellular calcium deprivation with 0.5 mM EGTA (B). Increase of [Ca2+]i because of 1 μM ionomycin did not affect the compacted stage (C). Numbers indicate time in min after treatment was applied. [Bars = 25 μm (A and C) and 50 μm (B).]
No changes of [Ca2+]i were detected in early uncompacted morulae exposed for up to 45 min to calcium-free medium (Fig. 3B), or medium containing either 0.3 mM verapamil, 0.5 μg/ml CCD, 10 μM TFP, or 100 μg/ml TMB-8. This finding suggests that the increases in [Ca2+]i (compare with Fig. 2) caused by the treatments used were stage-specific effects caused by compaction.
It is of note that decompaction is not a result of a nonspecific rise of [Ca2+]i because when compacted embryos were exposed to 1 μM ionomycin, the level of [Ca2+]i increased but the compacted state was maintained during the following 4-hr observation (Fig. 3C).
Effect of Decompacting Treatments on the Localization of E-cadherin, Fodrin, and Actin.
Because the calcium-dependent cell adhesion molecule E-cadherin is involved in compaction and linked to the cytoskeleton, we have examined its localization as well as the localization of the cytosketelon components fodrin and actin under the same conditions that induced decompaction and [Ca2+]i changes. During compaction, E-cadherin colocalized with fodrin in the areas of cell contacts (Fig. 4). When morulae were decompacted by depletion of calcium in the culture medium with EGTA, E-cadherin was deregionalized from the cell surface, whereas fodrin deregionalized partially to the polar cortex (Fig. 5 A and C). After recompaction, the distribution of E-cadherin and fodrin recovered and showed a location comparable to compacted embryos (compare Fig. 5 B and D with Fig. 4 B and D). The same effect on the distribution of E-cadherin and fodrin also was observed after decompaction-recompaction with verapamil, CCD, TFP, and TMB-8 (not shown).
Figure 4.

Distribution of E-cadherin (A and B) and fodrin (C and D) in early uncompacted (A and C) and compacted (B and D) morulae. Double-immunofluorescence shows that E-cadherin and fodrin colocalized in contact areas after compaction. More than 20 embryos were observed by confocal microscopy. (Bar = 25 μm.)
Figure 5.

Distribution of E-cadherin (A and B) and fodrin (C and D) in a morula decompacted by effect of 10-min exposure to extracellular Ca2+-deprivation with 0.5 mM EGTA (A and C) and in a recompacted morula after the same treatment (B and D). Note that E-cadherin delocalized to the cytoplasm and fodrin partially to the polar cortex (arrow heads) by the effect of decompaction. The location of E-cadherin and fodrin recovered when recompaction was allowed. More than 10 embryos were observed by confocal microscopy. (Bar = 25 μm.)
In contrast, the distribution of actin filaments did not change during normal compaction nor during the decompaction-recompaction assay with EGTA, verapamil, CCD, TFP, or TMB-8 (Fig. 6). A disruption of the actin cortex was observed in areas that presumably were cell–cell contacts before decompaction only with CCD (Fig. 6C).
Figure 6.
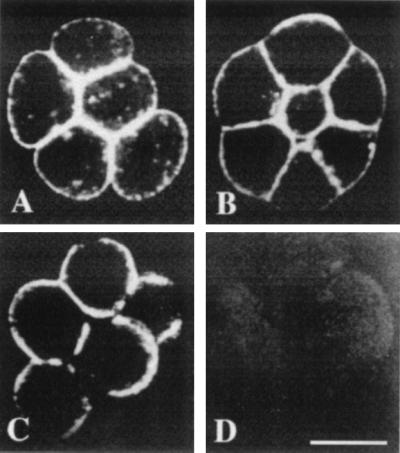
Distribution of actin in uncompacted (A), compacted (B), and decompacted (C) morulae. Decompaction was induced by 0.5 μg/ml CCD. Note the disruption of actin cortex in the former cell–cell contact areas. (D) Negative control using unrelated monoclonal anti-glutamate receptor antibody after incubation with fluorescein isothiocyanate-conjugated secondary antibody. More than 10 embryos were observed by confocal microscopy. (Bar = 25 μm.)
Effect of TFP on the Distribution of Calmodulin.
Calmodulin is known to be one of the primary downstream effectors for Ca2+. In the preimplatation mouse embryo, calmodulin is located in areas opposite to cell–cell contacts from the two-cell stage onward (R.P., G.S., and M.H., unpublished work). However, its distribution did not change with compaction. When embryos were decompacted by TFP (10 μM) the distribution of calmodulin became less restricted, showing a more homogeneous distribution throughout the cytoplasm, although a higher intensity still was detected at apical poles (Fig. 7).
Figure 7.

Distribution of calmodulin (A and B) and E-cadherin (C and D) in a morula during the process of compaction (A and C) and after decompaction with 10 μM TFP (B and D). Calmodulin was located in areas opposite cell contacts in morulae. Decompaction with TFP resulted in delocalization of calmodulin. More than 10 embryos were observed by confocal microscopy. (Bar = 25 μm.)
DISCUSSION
In preimplantation embryos [Ca2+]i is involved in cell division and in the rate of cavitation (24). In the present study, we provide experimental evidence for a role of [Ca2+]i in compaction, the first morphogenetic event in preimplantation mammalian development. The results show that various decompacting treatments, simultaneously with the induction of cell shape change, induced an increase of [Ca2+]i and redistribution of cytoskeletal-related proteins. Treatments were selected to interfere with the compacted cell shape via different routes. The calcium chelator EGTA is thought to interfere with the calcium-dependent cell adhesion, although in our experiments it also affected [Ca2+]i. Verapamil interferes with calcium influx by blocking voltage-gated channels; TFP inhibits the calcium-dependent protein calmodulin; TMB-8 acts as [Ca2+]i antagonists and also as an inhibitor of protein kinase C; and CCD alters polymerization of actin microfilaments. Finally, to induce a nonspecific increase of [Ca2+]i, embryos were treated with ionomycin, which did not modify the cell shape.
Decompaction Assay.
Instead of directly observing the process of compaction, we used the decompacting-recompacting assay. This approach has the advantage that batches of morulae previously were synchronized with respect to compaction, thus reducing variations reflecting differences in individual developmental clocks. In addition, natural compaction of a morula occurs within 2–3 hr as a gradual process of extension of the cell contacts, whereas decompaction occurs within minutes, depending on the decompacting treatment applied, and thus allowing more accurate observations. Although in this study decompaction-recompaction was experimentally induced, it also occurs spontaneously to blastomeres of mouse embryos undergoing mitosis. Division of adherent cells is characterized by dramatic cytoskeletal rearrangements, controlled by Ca2+ ions, while the cells round up and traction force appears in the furrow without relaxation of the adherent poles (52, 61, 62). Preimplantation mouse embryos are free entities formed by blastomeres that adhere only between themselves but not to a substratum. In such a situation, and assuming a similarity with mitosis, compaction can be explained as the result of cytoskeleton activity that may include contraction of the poles, where myosin, actin, and calmodulin are located, and relaxation of the contact areas while cell–cell adhesion progresses. Perhaps there is even a feedback loop whereby [Ca2+]i and other ions regulate the organization and functioning of the cytoskeleton. If correct, perhaps the cytoskeletal rearrangements during decompaction even might have ionic consequences.
Decompaction Induces Deregionalization.
Compaction was shown to be mediated by accumulation and clustering of E-cadherin in the cell contact areas of eight-cell stage embryos (4). Here, we observed that different treatments inducing decompaction of mouse morulae, simultaneously induced increases of [Ca2+]i and deregionalization of E-cadherin and fodrin. E-cadherin is a transmembrane protein with cell–cell adhesion function in which the intracellular domain is connected to cytoskeleton (45, 46, 63–65). In some cell types the presence of E-cadherin/ankyrin and E-cadherin/fodrin complexes have been detected, and it has been proposed that E-cadherin leads to morphogenesis, differentiation, and polarization of epithelia by defining restricted cortical domains (66–71). Therefore, it is likely that E-cadherin is not connected only to the cytoskeleton but also that its location is controlled by cytoskeletal functions and thus mediated by [Ca2+]i. The colocalization of E-cadherin and fodrin in compacted morulae and delocalization of both with decompacting treatments suggest a possible link between the two molecules in the mouse embryo.
The cell–cell adhesion function of the extracellular domain of E-cadherin is mediated by extracellular calcium (5). In our experiments deregionalization of E-cadherin was induced by decompacting treatments either in normal (CCD, TFP, and TMB-8), reduced (verapamil), or absent (EGTA) extracellular calcium concentration, suggesting that the deregionalization of E-cadherin during decompaction is not caused by a loss of the adhesion function.
As opposed to E-cadherin and fodrin, the cortical location of actin did not change with compaction nor with decompaction. However, when morulae were decompacted with CCD, a disruption of the actin cortex was observed only in former contact areas. The same pattern of actin distribution was observed by decompaction with latrunculin (not shown), a drug that also inhibits microfilaments (72). There are evidences that within the surface membrane and its associated cytocortex a CCD-resistant core of actin filaments exists, which may function as a memory trace polarity during mitosis (73). The stabilization of that cytocortex core could be explained by the presence of actin-binding proteins of the ERM family of which ezrin was shown to segregate specifically into the surface pole (39, 75, 76). Calmodulin also was regionalized in the areas opposite to cell contacts of compacted morulae. The same location has been reported for myosin (35, 74). Inhibition of calmodulin with TFP induced its delocalization whereas morulae decompacted and [Ca2+]i rose. In nonmuscle cells, Ca2+-calmodulin causes contraction of cytoskeleton by stimulating kinases that phosphorylate myosin (77). Ca2+-calmodulin also induced depolymerization and inhibited locally the assembly of microtubules (78). It has been suggested that microtubules are opposing resistance against compaction of the mouse morula (43), and in fibroblast, the assembly of microtubules exerts an opposite force to contraction (79). Therefore, release of Ca2+ from calmodulin may cause relaxation of the cytoskeleton, but also polymerization of tubulin and thus decompaction.
Origin of [Ca2+]i-Increase.
The intracellular origin of calcium that rises during decompaction with the EGTA treatment is evident. Comparable observations have been described in mouse oocytes and other cell systems. Parthenogenesis of the mouse can be induced not only by microinjecting calcium into the oocyte, but also by incubating them in a calcium-free medium that also may reflect an effect of increasing [Ca2+]i (6). In mast cells intracellular stores of calcium can be depleted by EGTA and when normal medium is restored, an influx current of calcium is produced (80). Decompaction with the calcium channel blocker verapamil, the calmodulin inhibitor TFP, the [Ca2+]i antagonist TMB-8, and the microfilament inhibitor CCD also resulted in a rise of [Ca2+]i. Nevertheless, we cannot deduce the origin of [Ca2+]i because of the presence of extracellular calcium. However, the comparable time course of decompaction and pattern of [Ca2+]i rise induced by verapamil and EGTA may be indicative of a similar cellular response to the absence of calcium influx either caused by depletion of extracellular calcium or blocking of Ca2+ channels. The effects of TMB-8 are attributed to its action as [Ca2+]i antagonist (9) rather than to inhibition of protein kinase C (81) because H-7, another inhibitor of the enzyme, did not affect compaction (R.P., unpublished observation).
In all experiments, [Ca2+]i increased homogeneously, and we did not detect a starting region, which suggests that calcium was released from multiple store sites. In mouse oocytes and mouse embryos, Ca2+ stores have been reported that are regulated by the inositol-trisphosphate receptor and also by the ryanodine receptor (24, 82, 83). However, caffeine, which induces release of calcium from ryanodine-sensitive stores (84), did not provoke [Ca2+]i changes in preimplantation mouse embryos or decompaction (24).
A higher [Ca2+]i rise was detected in the nuclei of mouse morulae during decompaction, but nuclear-cytosolic gradients in resting embryos were not observed. Nuclear-cytosolic calcium gradients also have been detected in sea urchin embryo (16), mouse oocyte (17), rat hepatocytes (85), and vertebrate neurons (59). In the mouse oocyte, Carroll et al. (17) believe that this gradient may be an artifactual observation dependent on the method of dye loading. We cannot exclude this possibility, but our observation also may indicate a lower nuclear Ca2+ buffering in the mouse morulae.
Calcium oscillations seem to be relevant not only for fertilization but also for development because they are detected during the first mitotic division (17, 18). When induced at the right frequency, they can cause parthenogenetic development of mammalian oocytes to the blastocyst stage (12, 86). If Ca2+ oscillations occurred during the decompacting assays at a frequency higher than 15 sec, we would not be able to detect them because of the frequency of the time-lapse observations performed.
Although we cannot distinguish what is the source that leads to [Ca2+]i changes during decompaction, we conclude that Ca2+ is specifically involved in compaction, because a nonspecific rise in [Ca2+]i provoked by Ca2+ ionophore did not affect the compacted morulae. Furthermore, the same decompacting treatments when applied to earlier uncompacted morulae did not produce such an effect in [Ca2+]i. We conclude that it is not the global rise of [Ca2+]i that caused decompaction, but its release from a store in a local vicinity to a cytoskeleton-related structure involved in compaction or from calcium-binding proteins like calmodulin associated to the cytoskeleton.
Acknowledgments
This article is dedicated to the memory of Prof. Dr. Luis Izquierdo. We thank V. E. Centonze and F. Espinoza for technical assistance. This work was supported by grants from Fondo Nacional de Desarrollo Científico y Technológico (FONDECYT) and Centro de Equipamiento Mayor (CEM)/Fund for Fostering Scientific and Technological Development (FONDEF). R.P. was supported by Fundación Andes.
ABBREVIATIONS
- [Ca2+]i
intracelluar Ca2+
- hCG
human chorionic gonadotropin
- CCD
cytochalasin D
- TFP
trifluoperazine
- TMB-8
3,4,5trimethoxybenzoic acid 8-(diethylamino)octyl ester
References
- 1. Ducibella T, Anderson E. Dev Biol. 1979;73:46–58. doi: 10.1016/0012-1606(79)90136-2. [DOI] [PubMed] [Google Scholar]
- 2.Ducibella T. Dev Biol. 1980;79:356–366. doi: 10.1016/0012-1606(80)90121-9. [DOI] [PubMed] [Google Scholar]
- 3.Hyafil F, Babinet C, Jacob F. Cell. 1981;26:447–454. doi: 10.1016/0092-8674(81)90214-2. [DOI] [PubMed] [Google Scholar]
- 4.Vestweber D, Gossler A, Boller K, Kemler R. Dev Biol. 1987;124:451–456. doi: 10.1016/0012-1606(87)90498-2. [DOI] [PubMed] [Google Scholar]
- 5.Ringwald M, Schuh R, Vestweber D, Eistetter H, Lottspeich F, Engel J, Dölz R, Jähnig F, Epplen J, Mayer S, et al. EMBO J. 1987;6:3647–3653. doi: 10.1002/j.1460-2075.1987.tb02697.x. [DOI] [PMC free article] [PubMed] [Google Scholar]
- 6.Fulton B P, Whittingham D G. Nature (London) 1978;273:149–150. doi: 10.1038/273149a0. [DOI] [PubMed] [Google Scholar]
- 7.Cuthbertson K S R, Cobbold P H. Nature (London) 1985;316:541–542. doi: 10.1038/316541a0. [DOI] [PubMed] [Google Scholar]
- 8.Hafner M, Petzelt C, Nobiling R, Pawley J, Kamp D, Schatten G. Cell Motil Cytoskel. 1988;9:271–277. doi: 10.1002/cm.970090309. [DOI] [PubMed] [Google Scholar]
- 9.Silver R B. Dev Biol. 1989;131:11–26. doi: 10.1016/s0012-1606(89)80034-x. [DOI] [PubMed] [Google Scholar]
- 10.Colonna R, Tatone C, Malgaroli A, Eusebi L, Mangia F. Gamete Res. 1989;24:171–183. doi: 10.1002/mrd.1120240205. [DOI] [PubMed] [Google Scholar]
- 11.Felici M D, Dolci S, Siracusa G. J Exp Zool. 1991;260:401–405. doi: 10.1002/jez.1402600314. [DOI] [PubMed] [Google Scholar]
- 12.Vitullo A D, Ozil J P. Dev Biol. 1992;151:128–136. doi: 10.1016/0012-1606(92)90220-b. [DOI] [PubMed] [Google Scholar]
- 13.Tombes R M, Simerly C, Borisy G C, Schatten G. J Cell Biol. 1992;117:799–811. doi: 10.1083/jcb.117.4.799. [DOI] [PMC free article] [PubMed] [Google Scholar]
- 14.Kline D, Kline J T. Dev Biol. 1992;149:80–89. doi: 10.1016/0012-1606(92)90265-i. [DOI] [PubMed] [Google Scholar]
- 15.Bement W M. J Exp Zool. 1992;263:382–397. doi: 10.1002/jez.1402630406. [DOI] [PubMed] [Google Scholar]
- 16.Stricker S A, Centonze V E, Paddock S W, Schatten G. Dev Biol. 1992;149:370–380. doi: 10.1016/0012-1606(92)90292-o. [DOI] [PubMed] [Google Scholar]
- 17.Carroll J, Swann K, Whittingham D, Whitaker M. Development (Cambridge, UK) 1994;120:3507–3517. doi: 10.1242/dev.120.12.3507. [DOI] [PubMed] [Google Scholar]
- 18.Kono T, Carroll J, Swann K, Whittingham D G. Development (Cambridge, UK) 1995;121:1123–1128. doi: 10.1242/dev.121.4.1123. [DOI] [PubMed] [Google Scholar]
- 19.Lefèvre B, Pesty A, Testart J. Exp Cell Res. 1995;218:166–173. doi: 10.1006/excr.1995.1144. [DOI] [PubMed] [Google Scholar]
- 20.Bilozur M, Powers D. Exp Cell Res. 1982;142:39–45. doi: 10.1016/0014-4827(82)90406-2. [DOI] [PubMed] [Google Scholar]
- 21.Kono T, Jones K T, Bos-Mikich A, Whittingham D G, Carroll J. J Cell Biol. 1996;132:915–923. doi: 10.1083/jcb.132.5.915. [DOI] [PMC free article] [PubMed] [Google Scholar]
- 22.Stacheki J J, Yelian F D, Schultz J F, Leach R E, Armant D R. Biol Reprod. 1994;50:1–9. doi: 10.1095/biolreprod50.1.1. [DOI] [PubMed] [Google Scholar]
- 23.Stacheki J J, Yelian F D, Leach R E, Armant D R. J Reprod Fertil. 1994;101:611–617. doi: 10.1530/jrf.0.1010611. [DOI] [PubMed] [Google Scholar]
- 24.Stacheki J J, Armant D R. Development (Cambridge, UK) 1996;122:2485–2496. doi: 10.1242/dev.122.8.2485. [DOI] [PubMed] [Google Scholar]
- 25.Mulnard J C. Arch Biol. 1967;78:107–138. [PubMed] [Google Scholar]
- 26.Dizio S M, Tasca R J. Dev Biol. 1987;59:198–205. doi: 10.1016/0012-1606(77)90254-8. [DOI] [PubMed] [Google Scholar]
- 27.Wiley L M. Dev Biol. 1984;105:330–342. doi: 10.1016/0012-1606(84)90290-2. [DOI] [PubMed] [Google Scholar]
- 28.Wiley L M, Kidder G M, Watson A J. BioEssays. 1990;12:67–73. doi: 10.1002/bies.950120204. [DOI] [PubMed] [Google Scholar]
- 29.Ducibella T, Anderson E. Dev Biol. 1975;47:45–58. doi: 10.1016/0012-1606(75)90262-6. [DOI] [PubMed] [Google Scholar]
- 30.Fleming T P, Hay M. Development (Cambridge, UK) 1991;113:295–304. doi: 10.1242/dev.113.1.295. [DOI] [PubMed] [Google Scholar]
- 31.Lo C W, Gilula N B. Cell. 1979;18:411–422. doi: 10.1016/0092-8674(79)90060-6. [DOI] [PubMed] [Google Scholar]
- 32.Goodall H, Johnson M H. J Embryol Exp Morph. 1984;79:53–76. [PubMed] [Google Scholar]
- 33.Mayor R, Pey R, Izquierdo L. Roux Arch Dev Biol. 1989;198:233–241. doi: 10.1007/BF00375910. [DOI] [PubMed] [Google Scholar]
- 34.Izquierdo L, Ebensperger C. J Embryol Exp Morph. 1982;69:115–126. [PubMed] [Google Scholar]
- 35.Sobel S. Dev Biol. 1983;100:207–213. doi: 10.1016/0012-1606(83)90212-9. [DOI] [PubMed] [Google Scholar]
- 36.Johnson M H, Maro B. J Embryol Exp Morph. 1984;82:97–117. [PubMed] [Google Scholar]
- 37.Houliston E, Pickering S J, Maro B. J Cell Biol. 1987;104:1299–1308. doi: 10.1083/jcb.104.5.1299. [DOI] [PMC free article] [PubMed] [Google Scholar]
- 38.Sepúlveda S, Izquierdo L. Dev Biol. 1990;139:363–369. doi: 10.1016/0012-1606(90)90305-3. [DOI] [PubMed] [Google Scholar]
- 39.Louvet S, Aghion J, Santa-Maria A, Mangeat P, Maro B. Dev Biol. 1996;177:568–579. doi: 10.1006/dbio.1996.0186. [DOI] [PubMed] [Google Scholar]
- 40.Pratt H P M, Chakraborty J, Surani M A H. Cell. 1981;26:279–292. doi: 10.1016/0092-8674(81)90310-x. [DOI] [PubMed] [Google Scholar]
- 41.Sutherland A E, Calarco-Gillam P G. Dev Biol. 1983;100:328–338. doi: 10.1016/0012-1606(83)90227-0. [DOI] [PubMed] [Google Scholar]
- 42.Izquierdo L, Lopez T, Panuncio A. Arch Biol Med Exp. 1984;17:29–39. [PubMed] [Google Scholar]
- 43.Winkel G K, Ferguson J E, Takeichi M, Nuccitelli R. Dev Biol. 1990;138:1–15. doi: 10.1016/0012-1606(90)90171-e. [DOI] [PubMed] [Google Scholar]
- 44.Maro B, Pickering S J. J Embryol Exp Morph. 1984;84:217–232. [PubMed] [Google Scholar]
- 45.Ozawa M, Baribault H, Kemler R. EMBO J. 1989;8:1711–1717. doi: 10.1002/j.1460-2075.1989.tb03563.x. [DOI] [PMC free article] [PubMed] [Google Scholar]
- 46.Ozawa M, Ringwald M, Kemler R. Proc Natl Acad Sci USA. 1990;87:4246–4250. doi: 10.1073/pnas.87.11.4246. [DOI] [PMC free article] [PubMed] [Google Scholar]
- 47.McLachlin J R, Caveney S, Kidder G M. Dev Biol. 1983;98:155–164. doi: 10.1016/0012-1606(83)90344-5. [DOI] [PubMed] [Google Scholar]
- 48.Schliwa M. J Cell Biol. 1976;70:527–540. doi: 10.1083/jcb.70.3.527. [DOI] [PMC free article] [PubMed] [Google Scholar]
- 49.Schliwa M, Euteneuer U, Bulinski J C, Izant J G. Proc Natl Acad Sci USA. 1981;78:137–1041. doi: 10.1073/pnas.78.2.1037. [DOI] [PMC free article] [PubMed] [Google Scholar]
- 50.Lee Y C, Wolff J. J Biol Chem. 1984;259:1226–1230. [PubMed] [Google Scholar]
- 51.Kotani S, Nishida E, Kumagai H, Sakai H. J Biol Chem. 1985;260:10779–10783. [PubMed] [Google Scholar]
- 52.Petzelt C, Hafner M. In: The Cell Biology of Fertilization. Schatten H, Schatten G, editors. San Diego: Academic; 1989. pp. 341–359. [Google Scholar]
- 53.Hafner M, Petzelt C. Nature (London) 1987;330:264–266. doi: 10.1038/330264a0. [DOI] [PubMed] [Google Scholar]
- 54.Correas I, Padilla R, Avila J. Biochem J. 1990;269:61–64. doi: 10.1042/bj2690061. [DOI] [PMC free article] [PubMed] [Google Scholar]
- 55.Matus A. J Cell Sci. 1991;15:61–67. doi: 10.1242/jcs.1991.supplement_15.9. [DOI] [PubMed] [Google Scholar]
- 56.Pratt H P M, Ziomek C A, Reeve W J D, Johnson M H. J Embryol Exp Morph. 1982;70:113–132. [PubMed] [Google Scholar]
- 57.Hogan B, Beddington R, Constantini F, Lacy E. Manipulating the Mouse Embryo: A Laboratory Manual. Plainview, NY: Cold Spring Harbor Lab. Press; 1994. [Google Scholar]
- 58.Stricker S A. In: Three-Dimensional Confocal Microscopy: Volume Investigation of Biological Systems. Stevens J K, Mills L R, Trogadis J E, editors. San Diego: Academic; 1992. pp. 281–300. [Google Scholar]
- 59.Schatten H, Cheney R, Balczon R, Willard M, Cline C, Simerly C, Schatten G. Dev Biol. 1986;118:457–466. doi: 10.1016/0012-1606(86)90016-3. [DOI] [PubMed] [Google Scholar]
- 60.Hernandez-Cruz A, Sala F, Adams P R. Science. 1990;247:858–862. doi: 10.1126/science.2154851. [DOI] [PubMed] [Google Scholar]
- 61.Sanger J M, Dome J S, Hock R S, Mittal B, Sanger J W. Cell Motil Cytoskeleton. 1994;27:26–40. doi: 10.1002/cm.970270104. [DOI] [PubMed] [Google Scholar]
- 62.Burton K, Taylor D L. Nature (London) 1997;385:450–454. doi: 10.1038/385450a0. [DOI] [PubMed] [Google Scholar]
- 63.Jockusch B M, Isenberg G. Proc Natl Acad Sci USA. 1981;78:3005–3009. doi: 10.1073/pnas.78.5.3005. [DOI] [PMC free article] [PubMed] [Google Scholar]
- 64.Hirano S, Nose A, Hatta K, Kawakami A, Takeichi M. J Cell Biol. 1987;105:2501–2510. doi: 10.1083/jcb.105.6.2501. [DOI] [PMC free article] [PubMed] [Google Scholar]
- 65.Herrenknecht K, Ozawa M, Eckerskorn C, Loppspeich M L, Kemler R. Proc Natl Acad Sci USA. 1991;88:9156–9160. doi: 10.1073/pnas.88.20.9156. [DOI] [PMC free article] [PubMed] [Google Scholar]
- 66.Nagafuchi A, Shirayoshi Y, Okazaki K, Yasuda K, Takeichi M. Nature (London) 1987;329:341–343. doi: 10.1038/329341a0. [DOI] [PubMed] [Google Scholar]
- 67.Gumbiner B, Stevenson B, Grimaldi A. J Cell Biol. 1988;107:1575–1587. doi: 10.1083/jcb.107.4.1575. [DOI] [PMC free article] [PubMed] [Google Scholar]
- 68.Takeichi M. Development (Cambridge, UK) 1988;102:639–655. doi: 10.1242/dev.102.4.639. [DOI] [PubMed] [Google Scholar]
- 69.McNeil H, Ozawa M, Kemler R, Nelson W J. Cell. 1990;62:309–316. doi: 10.1016/0092-8674(90)90368-o. [DOI] [PubMed] [Google Scholar]
- 70.Calogero A, Samuels M, Darland T, Edwards S A, Kemler R, Adamson E D. Dev Biol. 1991;146:499–508. doi: 10.1016/0012-1606(91)90251-w. [DOI] [PubMed] [Google Scholar]
- 71.Coutifaris C, Kao L-C, Sehdev H M, Chin U, Babalola G, Blaschuk O W, Strauss III J F. Development (Cambridge, UK) 1991;113:767–777. doi: 10.1242/dev.113.3.767. [DOI] [PubMed] [Google Scholar]
- 72.Schatten G, Schatten H, Spector I, Cline C, Paweletz N, Simerly C, Petzelt C. Exp Cell Res. 1986;166:191–208. doi: 10.1016/0014-4827(86)90519-7. [DOI] [PubMed] [Google Scholar]
- 73.Fleming T P, Pickering S J, Qasim F, Maro B. J Embryol Exp Morphol. 1986;95:169–191. [PubMed] [Google Scholar]
- 74.Sobel S. Dev Biol. 1983b;95:227–231. doi: 10.1016/0012-1606(83)90021-0. [DOI] [PubMed] [Google Scholar]
- 75.Turunen O, Wahlstrom T, Vaheri A. J Cell Biol. 1994;126:1445–1453. doi: 10.1083/jcb.126.6.1445. [DOI] [PMC free article] [PubMed] [Google Scholar]
- 76.Tsukita S, Oishi K, Sato N, Sagara J, Kawai A, Tsukita S. J Cell Biol. 1994;126:391–401. doi: 10.1083/jcb.126.2.391. [DOI] [PMC free article] [PubMed] [Google Scholar]
- 77.Aldestein R S. Cell. 1982;30:349–350. [Google Scholar]
- 78.Keith C, DiPaola M, Maxfield F R, Shelanski M L. J Cell Biol. 1983;97:1918–1924. doi: 10.1083/jcb.97.6.1918. [DOI] [PMC free article] [PubMed] [Google Scholar]
- 79.Danovski B A. J Cell Sci. 1989;93:255–266. doi: 10.1242/jcs.93.2.255. [DOI] [PubMed] [Google Scholar]
- 80.Hoth M, Penner R. Nature (London) 1992;355:353–356. doi: 10.1038/355353a0. [DOI] [PubMed] [Google Scholar]
- 81.Kojima I, Kojima K, Rasmussen H. Biochem J. 1985;232:87–92. doi: 10.1042/bj2320087. [DOI] [PMC free article] [PubMed] [Google Scholar]
- 82.Kline J T, Kline D. Biol Reprod. 1994;50:193–203. doi: 10.1095/biolreprod50.1.193. [DOI] [PubMed] [Google Scholar]
- 83.Ayabe T, Kopf G S, Schultz R M. Development (Cambridge, UK) 1995;121:2233–2244. doi: 10.1242/dev.121.7.2233. [DOI] [PubMed] [Google Scholar]
- 84.Malgaroli A, Fesce R, Meldolesi J. J Biol Chem. 1990;265:3005–3008. [PubMed] [Google Scholar]
- 85.Waybill M M, Yelamarty R V, Zhang Y, Scaduto R C, LaNoue K F, Hsu C, Smith B C, Tillotson D L, Yu F T S, Cheung J Y. Am J Physiol. 1991;261:E49–E57. doi: 10.1152/ajpendo.1991.261.1.E49. [DOI] [PubMed] [Google Scholar]
- 86.Ozil J P. Development (Cambridge, UK) 1990;109:117–127. doi: 10.1242/dev.109.1.117. [DOI] [PubMed] [Google Scholar]