


Abstract
Identification of dispersed repetitive elements can be difficult, especially when elements share little or no homology with previously described repeats. Consequently, a growing number of computational tools have been designed to identify repetitive elements in an ab initio manner, i.e. without using prior sequence data. Here we present the results of side-by-side evaluations of six of the most widely used ab initio repeat finding programs. Using sequence from rice chromosome 12, tools were compared with regard to time requirements, ability to find known repeats, utility in identifying potential novel repeats, number and types of repeat elements recognized and compactness of family descriptions. The study reveals profound differences in the utility of the tools with some identifying virtually their entire substrate as repetitive, others making reasonable estimates of repetition, and some missing almost all repeats. Of note, even when tools recognized similar numbers of repeats they often showed marked differences in the nature and number of repeat families identified. Within the context of this comparative study, ReAS and RepeatScout showed the most promise in analysis of sequence reads and assembled genomic regions, respectively. Our results should help biologists identify the program(s), if any, that is best suited for their needs.
INTRODUCTION
In the late 1960s, Roy Britten and his colleagues at the Carnegie Institution of Washington made a discovery that changed the way the scientific community viewed genomes and DNA in general. While it had been clearly demonstrated that DNA was the macromolecule of heredity, Britten et al. (1) were the first to show that eukaryotic genomes are not composed of genes alone. Rather, they found that genomes contain many repetitive DNA sequences, and indeed it is now known that repetitive elements make up the majority of DNA in most eukaryotes.
Repetitive elements have played, and are continuing to play, critical roles in genome evolution. Mobile repetitive elements (i.e. transposons), in particular, appear to be an agent of evolutionary change (2) with some only becoming active in times of extreme stress (i.e. when desperate measures such as creating new mutations may prove advantageous). Sequence analysis indicates that some genes involved in cell function originated from transposon genes (3), while the ability of some DNA transposons to generate chimeric molecules composed of fragments of multiple genes has been implicated in the evolution of new genes (4–7). Moreover, repeats can have profound influences on gene expression. For example, if genes that are found in regions dominated by repeats are moved to less repetitive regions they may not be expressed or their expression may change drastically (8–11). Likewise, mobile element insertions can cause epigenetic changes in regulation of nearby genes (12). Clearly a comprehensive knowledge of the function of genes in vivo and the underlying processes governing eukaryotic genome evolution will require understanding of the interactions between genes and repetitive sequences.
The main means by which repeats are identified is via comparison of query sequences with those in curated repeat libraries. RepeatMasker (Smit et al., unpublished data, www.repeatmasker.org) is the most widely used tool employed in repeat discovery, and analysis of sequence data with RepeatMasker and a well-maintained repeat library, e.g. Repbase (13), is often seen as an important first step in repeat identification. However, library-dependent tools such as RepeatMasker can only find those repeats that are similar to known repeats, and thus their utility in novel repeat discovery is limited.
Recently, a number of tools have been developed to facilitate identification and classification of repeats in a manner that does not employ known repeat sequences or repeat motifs in the discovery process. Such ab initio repeat identification tools have tremendous potential in accelerating discovery and characterization of new repeats. Ab initio tools employ a variety of algorithms (14) and have been utilized to study diverse datasets. Consequently, it is difficult to make comparisons of these tools based upon their published descriptions, and to our knowledge no broad comparative study of these tools has been attempted. To remedy this deficiency and educate ourselves as to which tool(s) might be most useful in our research, we conducted an investigation of six of the most popular ab inito repeat identification programs using rice chromosome 12 (or portions thereof) as a test dataset. Each tool was evaluated based upon its run time, efficacy in detecting known repeats, ability to find potential novel repeats and utility in identifying different types of repeats. Tools were tested on the substrate(s) for which they were designed (unassembled sequence reads or assembled genomic regions) using default parameters. Of note, we found ReAS (15) to be the most effective repeat finder when analyzing unassembled sequence reads while RepeatScout (16) exhibited the best overall performance when an assembled genomic region was used as a substrate. The side-by-side comparison of tools presented in this paper should help genome scientists make educated choices when selecting ab initio repeat finding tools and should stimulate further development of algorithms for ab initio identification and classification of repeats.
A brief overview of the tools
The ab initio repeat identification tools Recon (17), ReAS (15), RepeatGluer (18), RepeatScout (16), RepeatFinder (19) and PILER (20) were used in our study. The sequence input, identification strategy and family classification scheme used by each of the tools is discussed below. To facilitate understanding, we use the following terms when discussing the tools:
Assembled genomic region: a continuous DNA sequence of >1 Mb.
Family: a group of repetitive sequences that, based upon sequence similarity, is thought to have a common ancestor.
Element: an individual member of a repeat family.
Consensus sequence: a ‘pseudomolecule’ representing all the members in a repeat family. In a consensus sequence, each position in the pseudomolecule is occupied by the base most commonly found at that location.
k-mer: a sequence of length k selected from the query sequence(s) and used as a ‘seed’ in the repeat identification process. For two k-mers to be matched by a sequence alignment algorithm they must possess identical nucleotide sequences.
Recon and PILER use sequence self-comparison approaches in which initial alignment is conducted using the tools WU-BLAST (http://blast.wustl.edu/) and PALS (20), respectively. Recon, which is tailored to use sequence reads as a starting substrate, utilizes single-link clustering to find groups of elements that partially overlap. The algorithm then generates a graph where vertices correspond to repeat elements, and edges connect elements with a specified ratio of overlap. Elements with a high degree of overlap are assumed to belong to the same repeat family while those with less similarity are assumed to correspond to related families. The boundaries of a repeat family are identified through aggregation of end points (17). PILER is designed for identification of repeats in an assembled genomic region. In short, PALS records the coordinates (i.e. start and end points) of each substring that shares significant sequence similarity with at least one other substring. Overlapping substrings are condensed into ‘piles’ (≈ elements) and piles sharing significant sequence similarity are grouped into families. Linear spatial relationships between elements in a given family are compared to four author-defined spatial profile ‘signatures’ (tandem arrays, dispersed families, pseudosatellites and terminal repeats) and classified according to the profile that best describes them. A consensus sequence is generated for each family.
RepeatFinder, RepeatScout and ReAS each start with a library of high-frequency k-mers that are used in initial identification, alignment and extension of sequence substrings. Like Recon, ReAS is designed to use multiple sequence reads as a substrate. For a k-mer seed, ReAS aligns all hits and uses those with sequence similarity to produce a 100-bp initial consensus sequence centered at the k-mer. A greedy search then is used to identify other high-frequency k-mers (if any) in the initial consensus sequence and extend the alignment. The extension process can be repeated several times. RepeatScout, a tool developed for identification of repeats in assembled genomic regions, builds a library of high-frequency k-mers and retrieves substrings of the input sequence containing a specific k-mer in a manner similar to that of ReAS. A penalty-based local alignment of the substrings is used to extend the k-mer and generate the consensus sequence for each family. RepeatFinder uses a set of k-mer-tagged substrings, traditionally identified by the REPuter search engine (21,22), to initialize its hierarchical clustering strategy. REPuter utilizes an assembled genomic region as its substrate. RepeatFinder performs three rounds of clustering to produce a final set of repeat families. RepeatFinder's default clustering method is ‘merging with gaps’ (merging of non-overlapping substrings that are close to one another) although ‘merging with overlap’ (merging of partially overlapping substrings) is also an option. A prototype element (≈ a consensus sequence) is selected to represent each family.
RepeatGluer, a tool designed for use with assembled genomic regions, can accept input from BLAST programs or k-mer-based tools such as REPuter. It implements a novel approach for extracting the mosaic architecture of repetitive regions by representing repeat elements as A-bruijn graphs. Graphs are simplified using a number of biologically derived heuristics. Each connected component in a graph corresponds to a repeat family and is resolved to a consensus sequence for the family.
A detailed comparison of the methodology implemented by these tools and other repeat finders is available in Saha et al. (14).
MATERIALS AND METHODS
System and parameters
All experiments were run on a computer with dual 3.2 Ghz Xeon processors and 4 GB of memory. The operating system was Redhat Linux. The ab initio repeat finding tools evaluated were Recon (17), ReAS (15), RepeatGluer (with REPuter) (18), RepeatScout (16), RepeatFinder (with REPuter) and PILER (20). While RepeatFinder reportedly can use either REPuter or RepeatMatch to find potential repeats, we used REPuter as this was the principal search engine employed in the original RepeatFinder paper (19). Additionally, a search of the literature indicates that other investigators typically have used RepeatFinder in combination with REPuter (21–24). All repeat finders were used with the default parameters or parameters suggested in the papers describing the tools. We did not conduct optimization of tool parameters because, in our experience, scientists with little or no formal computational training tend to use bioinformatics tools in the form in which they are delivered.
Rice test data
As test datasets we chose sequence from rice chromosome 12 (GenBank accession AP008219), the most repeat-rich (38.3%) chromosome of this important model plant (25). The tools Recon and ReAS were designed for use with shotgun sequence reads while the others were developed for use with relatively long assembled sequences. For Recon and ReAS we used an 18-Mb test dataset composed of 650-bp ‘pseudo-reads’ from the first 3-Mb segment of rice chromosome 12 (henceforward referred to as the ‘18-Mb dataset’). The size of this dataset was limited at 18 Mb as this was the maximum amount of data that Recon could process. The starting position of each 650-bp pseudo-read was randomly selected using a uniform distribution. For the other tools we tried analysis using the entire chromosome 12 sequence (27.8 Mb). We found that RepeatGluer was not capable of analyzing a sequence of this size, and thus the assembled first 3 Mb of chromosome 12 was used to test this tool (henceforward, the ‘3-Mb dataset’). RepeatScout, RepeatFinder and PILER were tested using the entire chromosome 12 sequence and the 3-Mb dataset; tests using the 3-Mb dataset allowed comparisons with RepeatGluer. The authors of some tools such as Recon (17) suggest an iterative repeat finding strategy for large datasets. However, we performed only a single round of repeat finding in order to maintain as consistent a testing strategy as possible.
Testing ab initio tools on semi-random synthetic chromosomes
To verify that the ab initio repeat finders can discriminate between random and non-random patterns, we generated two ‘synthetic chromosomes’ of the same length as chromosome 12. The first was constructed using a uniform distribution based on the relative frequencies of the 4 nt in chromosome 12, but was random in all other respects. In order to capture some of the local structure in the rice chromosomal sequence, a second synthetic chromosome was generated using a fifth order Markov chain computed from the chromosome 12 sequence. For each nucleotide in the chromosome, the probability of the sixth nt, x6, was conditional upon the probability of the sequence of the previous five bases, P(x6 | x1x2x3x4x5). As an initial step, the first base in the sequence is generated using a zeroth-order model, the second base with a first-order model, etc., until the first five bases have been generated. Subsequently, all other bases are generated using a fifth-order Markov chain. To facilitate comparison with the rice sequence analysis results: (i) Recon and ReAS were tested with two 18-Mb datasets composed of 650-bp ‘pseudo-reads’ randomly selected from the first 3-Mb segment of each synthetic chromosome; (ii) RepeatGluer was tested using the first 3-Mb regions of the synthetic chromosomes; and (iii) RepeatFinder, RepeatScout and PILER were tested with the two complete synthetic chromosomes and the first 3-Mb region of each synthetic chromosome.
Consensus sequence libraries
To facilitate comparison of the rice repetitive elements generated by each tool, we configured each to produce a library of consensus sequences representing the repeat families identified. Because the output of Recon is a list of repeat family members and not consensus sequences, we used ClustalW (26) to construct a consensus sequence for each family detected by Recon, and the consensus sequences were used to create a corresponding consensus sequence library. All other tools tested create a consensus sequence repeat library as a part of their output.
‘Accuracy’ of ab initio tools
Discovery algorithms such as gene finders are often evaluated using the Sensitivity and Specificity statistics. In the context of this paper, the term ‘positive’ refers to repetitive sequence and the term ‘negative’ refers to non-repetitive sequence. Sensitivity is the proportion of true-positive examples that are identified. It can be represented using the formula
where true positives (TP) are known repeats that are identified by the ab initio tool and false negatives (FN) are known repeats that are not identified by the tool. Specificity is a measure of the proportion of the true negatives that are identified, and can be represented using the formula
where true negatives (TN) are sequences known not to be repetitive that were not identified as repetitive by the tool and false positives (FP) are sequences known not to be repetitive that were identified as repetitive by the tool.
In our experiments, we consider ‘known repeats’ or ‘known positives’ to be those identified by RepeatMasker using the Repbase library as its reference (i.e. RepeatMasker using Repbase = RMRB). That is, we assumed that all sequence identified with RMRB was truly repetitive and we estimated Sensitivity by computing the percentage of this repetitive sequence that was also identified by an ab initio tool. RepeatMasker was configured to use WU-BLAST (blast.wustl.edu) as the matching engine as WU-BLAST is faster than Crossmatch (www.phrap.org) with only a slight loss in detection ability (18). RepeatMasker was run with the –s sensitive option in every case. For each ab initio tool, we computed the number of true positives as the number of bases in the test dataset recognized by the ab initio tool that were also recognized by RMRB and FN as the total number of bases in the test dataset recognized by RMRB but not the ab initio tool. Sensitivity values were multiplied by 100 so that they would be expressed as percentages. Higher Sensitivity indicates a greater ability to identify characterized repeats. Of note, RMRB requires only one copy of a repeat to be present in order for the region to be identified as a repeat while ab initio tools require two or more copies for recognition of repetitive regions.
Measuring Specificity is more problematic with ab initio tools because the entire rationale for using these tools is to discover repeats that have not previously been characterized. Therefore, if sequence is characterized as repetitive by an ab initio tool and not by RMRB, we have no easy way of determining if the sequence is truly not repetitive (TN) or if it is a true repeat that has not been previously identified. Because of this difficulty, we did not calculate Specificity scores.
Potential novel repeats
‘Potential Novel Repeat Content’, the percentage of DNA in the input dataset(s) that was recognized by a given ab initio repeat finder but not by RMRB, was estimated using the following formula:
where D equals the size of the 1× (i.e. 1-fold) content of the dataset analyzed by a given tool and Z equals the number of bases recognized by that tool that were not recognized by RMRB. Note that the 1× content of the 18-Mb dataset is 3 Mb as this dataset represents 6× (i.e. 6-fold) coverage of a 3-Mb region. Comparison of Potential Novel Repeat Content values between different ab initio tools can indicate the relative value of the tools in discovering new repeats. However, it should be noted that high Potential Novel Repeat Content values may also be a reflection of false-positive identifications, and thus these values must be carefully scrutinized.
Sensitivity of ab initio tools for different classes of repeats
We were interested in how the Sensitivity of ab initio tools varied for different classes of repeats. However, unlike the RMRB system which places each repeat it identifies into a repeat class (i.e. LINE, SINE, LTR retroelement, DNA element, satellite or unknown repeat) the ab initio repeat finders we tested, with the exception of PILER, do not classify repeats. Consequently, we obtained an estimate of Sensitivity of each ab initio tool for different classes of repeats using the following strategy:
RMRB was used to analyze two data sets—the 18-Mb dataset and the entire rice chromosome (27.8 Mb). For each dataset, the total number of base pairs in a given repeat class (e.g. LINE =25 222 bp, SINE =12 102 bp, etc.) was recorded. This provides an estimate of the TP + FN for each class.
The consensus sequence libraries generated by Recon and ReAS were each separately used by RepeatMasker to identify the locations of hypothetical repeats in the 18-Mb dataset. Likewise, the consensus sequence libraries for RepeatFinder, RepeatScout and PILER were each used by RepeatMasker to identify predicted locations of repeats in the complete chromosome dataset.
The sets of hypothetical repeats identified in step (ii) were then compared to the results from RMRB computed in step (i). The number of base pairs in each repeat class was determined (e.g. LINE = 11 121 bp, SINE = 8976 bp, etc.). This provides an estimate of TP for each class.
A given ab initio tool's ability to detect a specific class of repeats was expressed in terms of Sensitivity = TP/(TP + FN) where TP is estimated in step (iii) and (TP + FN) is estimated in step (i). We multiply by 100 to express Sensitivity as a percentage.
To maintain as consistent an approach as possible, PILER consensus sequences were also classified using the strategy described above.
Similarity of libraries generated by different ab initio tools (‘Interlibrary Intersection’)
The level of sequence intersection between libraries generated by pairs of different ab initio repeat finding tools was estimated as follows:
The consensus sequences generated by the first tool (library 1) were used as a dataset for RepeatMasker-based analysis of the consensus sequence set produced by the second tool (library 2).
The number of bases recognized by RepeatMasker using library 1 as a reference in analysis of library 2 (e.g. 23 650 bp) was divided by the total size of library 2 (e.g. 50 442 bp) to yield a ratio reflecting the proportion of library 2 recognized by library 1 (23 650÷50 442 = 0.47 or 47%). The percentage value is known as the ‘Interlibrary Intersection’ of library 1 (reference sequence) with library 2 (query sequence); note that the reference library is listed first while the query library is second.
The Interlibrary Intersection of library 2 (reference) with library 1 (query) was obtained using an identical strategy except that library 2 was used as the RepeatMasker reference dataset while library 1 was used as the query dataset.
RESULTS
Six ab initio repeat-finding tools were used to analyze datasets prepared from rice chromosome 12, and the performance of the various tools using their default settings were compared. Table 1 summarizes the output of the repeat finders and provides detailed information about the repeat libraries generated by each tool. Of note, none of the ab initio repeat finders detected any repeats in datasets prepared from two semi-random ‘synthetic chromosomes’ indicating that potential repeats detected in the analyses of the rice test datasets were likely not the results of random matches.
Table 1.
Comparison of ab initio repeat finders
| Tool | Run time (mins) | Sensitivity (% bp) | Portion (% bp) of dataset classified as repetitive | Potential novel repeats (% bp) | Number of families | Average length of family consensus sequence | Total bases in consensus sequence library |
|---|---|---|---|---|---|---|---|
| Simulated reads (650 bp each; Dataset: 3000 Kbp × 6 = 18 000 Kbp) | |||||||
| Recon | 3866.17 | 38.1 | 25.8 | 15.7 | 1291 | 485 | 626 157 |
| ReAS | 7.14 | 50.1 | 15.3 | 2.1 | 181 | 443 | 80 235 |
| Chromosome segment (Dataset: 3000 Kbp) | |||||||
| RepeatGluer | 4.55 | 99.9 | 99.3 | 72.2 | 38 | 157 451 | 5 983 148 |
| RepeatScout | 4.76 | 26.2 | 7.3 | 0.3 | 45 | 302 | 13 614 |
| RepeatFinder | 0.38 | 32.7 | 10.3 | 1.4 | 1000 | 153 | 153 531 |
| PILER | 0.11 | 0.04 | >0.1 | 0.0 | 1 | 420 | 420 |
| Chromosome (Dataset: 27 757 Kbp) | |||||||
| RepeatScout | 112.11 | 84.3 | 39.7 | 4.4 | 657 | 860 | 565 020 |
| RepeatFinder | 59.48 | 85.3 | 44.6 | 8.9 | 25 113 | 252 | 6 347 059 |
| PILER | 3.45 | 38.3 | 17.5 | 1.4 | 41 | 2767 | 113 473 |
Tools developed for analysis of unassembled sequence reads
Recon (17) and ReAS (15) are both designed for repeat finding in unassembled sequence datasets. In our testing we quickly discovered that Recon was not able to analyze more than 18 Mb of sequence per run. Consequently, for a test substrate we took the first 3 Mb of chromosome 12 and extracted random 650-bp ‘pseudo-reads’ until the resulting dataset afforded 6× coverage of the region (6 × 3 Mb = 18 Mb total). As shown in Table 1, Recon found twice the amount of potential ‘repeat space’ in the 18-Mb dataset as ReAS, but identified a smaller number of the known repeats in Repbase (Recon's Sensitivity was 38% compared to 50% for ReAS). ReAS achieved its higher Sensitivity with a much more compact library (181 versus 1291 families) and with family consensus sequences of lengths similar to those in the Recon library (Table 1). Recon identified more potentially novel repeats (2.8 Mb) than ReAS (0.38 Mb). There is little similarity in the two repeat libraries with the Recon library possessing 38% Interlibrary Intersection with the ReAS library and the ReAS library possessing only 6.7% Interlibrary Intersection with the Recon library (Table 2).
Table 2.
Interlibrary Intersection values (%) for the different combinations of tools
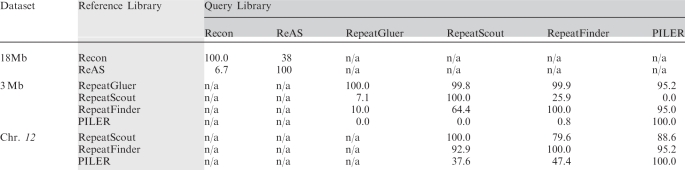 |
Each value denotes the percentage of bases in the query library (consensus sequence set) that are masked by RepeatMasker using the reference library.
Tools developed for analysis of assembled genomic regions
RepeatScout (11), RepeatFinder (14), PILER (15) and RepeatGluer (13) are all designed to be used with assembled genomic regions. These tools were tested using the complete chromosome 12 sequence, but we found that RepeatGluer was incapable of analyzing a sequence of this length (further testing revealed that RepeatGluer can process sequences <11 Mb, at least in the context of our system). To allow comparison of RepeatGluer, RepeatScout, PILER and RepeatFinder with Recon and ReAS, the former tools were used to analyze the same 3-Mb section of chromosome 12 analyzed by Recon and ReAS (albeit as a single molecule rather than as pseudo-reads). The tools capable of analyzing the entire chromosomal sequence (i.e. RepeatFinder, RepeatScout and PILER) were also compared using the entire 27.8-Mb chromosome as a substrate.
3-Mb dataset
In its analysis of the 3-Mb dataset, RepeatGluer (13) finds a small number of repeat families with an average family consensus sequence length of 157 kb. The mean consensus length value is orders of magnitude larger than average lengths for all other tools. The RepeatGluer consensus sequence library is also very large; at 6 Mb the repeat library is larger than the original 3-Mb sequence from which the library was derived. Due to these unfavorable results, RepeatGluer was not evaluated in subsequent ab initio tool analyses, all of which depend upon a consensus sequence library.
At the other extreme, PILER detected only one repeat family and had a Sensitivity of only 0.04%. In reference to the 3-Mb dataset, PILER's stringent default parameters prevented discovery of all but 16 bp of potential novel repetitive DNA.
RepeatScout and RepeatFinder showed better performance on the 3-Mb dataset than RepeatGluer and PILER. Of note, RepeatFinder showed higher Sensitivity and higher Potential Novel Repeat Content values than RepeatScout (Table 1). Although RepeatFinder does perform merging (see above) to consolidate groups of repeats into families, the final number of families it produced (1000 for the 3-Mb dataset) is orders of magnitude larger than the number of families found by RepeatScout (45 for the 3-Mb dataset). Moreover, the consensus sequences for families found by RepeatFinder are about one-half (153 bp) as long as consensus sequences for families found by RepeatScout (302 bp) for the 3-Mb dataset.
Comparison of the tools that use sequence reads as substrates (ReAS and Recon) with those that use assembled sequence regions (PILER, RepeatScout and RepeatFinder) reveals that the former group generate higher Sensitivity values and higher Potential Novel Repeat Contents than the latter. It is unclear whether the differences in the nature of the datasets (i.e. a 3-Mb sequence chopped into random 650-bp pieces and sampled to 6× coverage versus the same 3-Mb sequence in assembled form and represented only once) are responsible for this result.
Whole chromosome 12 (27.8 Mb) dataset
PILER, RepeatFinder and RepeatScout were used to analyze the entire chromosome 12 sequence. RepeatFinder identified a large number of repeat families (25 113 consensus sequences) with a short average consensus sequence length (252 bp). RepeatScout generated a much smaller number of repeat families (657) with a longer average family length (860 bp). The Sensitivities of both RepeatFinder and RepeatScout are quite high at 85.4 and 84.3%, respectively. The degree of intersection between the libraries is also high. The smaller library of RepeatScout exhibited 79.6% Interlibrary Intersection with the RepeatFinder library while the RepeatFinder library showed 92.9% Interlibrary Intersection with the RepeatScout library (Table 2). Both RepeatScout and RepeatFinder identify relatively small proportions of the chromosome 12 dataset as novel repeats (4.4 and 8.9%, respectively).
PILER fares much better in analysis of the entire chromosome 12 sequence (Sensitivity = 38.3%) than it does when used to analyze only the 3-Mb section (Sensitivity = 0.04%). The consensus sequences constructed by PILER are longer than those produced by RepeatScout or RepeatFinder, and the consensus sequence library is compact (113 kb). However, the other tools can successfully detect the repeats identified by PILER, i.e. the RepeatScout and RepeatFinder libraries possess Interlibrary Intersections with the PILER library of 88.6 and 95.2%, respectively (Table 2)
Types of repeats identified
We evaluated the Sensitivity of each ab initio tool in detecting known classes of repeats via comparison with RMRB as described in the ‘Materials and methods’ section. For the tools that work with sequence reads, Recon identifies more SINEs and LINEs than ReAS while ReAS identifies more LTR retrotransposons, DNA transposons and satellites (Figure 1). Among the tools that work with assembled genomic regions, RepeatScout and RepeatFinder identify similar numbers of SINEs, LINEs, LTR elements and DNA elements while PILER's stringent analysis criteria prevent it from identifying all but the repeat motifs with the most conserved sequence identities, most notably LTR retrotransposons and DNA transposons (Figure 2). Compared to RepeatScout, RepeatFinder identifies more repeats in the unclassified, small RNA and satellite categories. Of note, the two tools that use the k-mer approach for initial repeat identification, ReAS and RepeatFinder, identify almost all satellites detected by RMRB while their counterparts that use self-comparison algorithms recognize few if any satellites.
Figure 1.

Sensitivity of Recon and ReAS in detecting known classes of repeats as previously identified by RepeatMasker with Repbase (RMRB). Simulated unassembled sequence reads were used as the initial substrate for the analyses. Neither ReAS nor Recon detected any ‘small RNAs’ and thus this repeat category is not shown.
Figure 2.

Sensitivity of RepeatScout, RepeatFinder and PILER for detecting known classes of repeats as previously identified by RepeatMasker with Repbase (RMRB). The entire chromosome 12 sequence was used as the substrate for the analyses.
Potential novel repeats
For each ab initio consensus sequence library, those sequences not recognized by RMRB may represent consensus sequences of potentially novel repeats. Figure 3 shows the relative compositions of the consensus sequence libraries produced by Recon and ReAS (using unassembled pseudo-reads as a substrate) and RepeatScout, RepeatFinder and PILER (using the complete chromosome sequence as a substrate). Recon identified 7.5 times as much potential novel repetitive DNA as ReAS, but showed substantially lower Sensitivity than any of the other ab initio tools. The compositions of the repeat libraries generated by RepeatScout, RepeatFinder and PILER were similar to each other. Additionally, these tools produced libraries with more similarity to the ReAS library than to the Recon library (Figure 3). While potential novel repeats account for relatively large percentages of the bases in the RepeatScout, RepeatFinder and PILER consensus sequence libraries (15.7%, 23.8% and 20.9%, respectively), those potential novel repeats constitute much smaller proportions of the complete chromosome 12 sequence (4.4%, 8.9% and 1.4%, respectively). This suggests that most of the potential novel repeats exist in lower copy numbers compared to previously described repeats.
Figure 3.

Composition of repeat libraries. (A) Results for tools using chromosome 12 simulated reads (18-Mb dataset) as a substrate. (B) Results for tools using the intact chromosome 12 sequence as substrate.
DISCUSSION
Use of default parameters
Of note, each tool was evaluated using its default parameters. We chose not to conduct tool optimization because, in our experience, it is very common for biologists to operate bioinformatics tools using default parameters. Some likely reasons why optimization is often avoided are as follows:
Many biologists have little or no understanding of the algorithms and programming behind computational tools and thus do not feel comfortable changing program parameters.
Public domain tools rarely come with documentation that can be easily understood by those lacking experience in computational biology.
Because software developers cannot anticipate every dataset and/or application on which their tool may be used, they often provide only vague suggestions as to how optimization might be conducted.
The act of optimizing a tool for a particular dataset or application can be very difficult and time consuming.
Program default settings often become ‘standards’ to which researchers adhere so that they can directly compare their results with those of researchers who have used the same program in default mode in the past.
What constitutes an ‘optimal result’ differs from user to user prompting some scientists to use the default parameters as a way to limit introduction of their own biases into results/conclusions.
In our opinion, comparing the tools using each tool's default parameters is justified as the results are most likely to help guide the large number of biologists that do not possess extensive computational training. However, it is important to note that a tool's performance as discussed within the context of this study does not necessarily reflect its performance under all circumstances.
Tools developed for analysis of unassembled sequence reads
Although ReAS predicted substantially fewer novel repeats than Recon, its compact library descriptions would make it easier for researchers to investigate the potential repeats identified. While it is possible that Recon may actually be better at ab initio repeat discovery than ReAS, the higher fraction of novel repeats in the Recon library (as suggested by Figure 3) and relatively low Sensitivity may reflect a higher false-positive rate. As shown in Table 1, the run time of Recon is 541 times that of ReAS. More thorough examination is warranted, but library family compactness, run time and Sensitivity all favor ReAS.
Tools developed for analysis of assembled genomic regions
Although RepeatGluer may provide an elegant representation of the mosaic structure of genomes (18,27) it identified almost its entire test dataset as repetitive (99.35%) suggesting that it is of limited utility in building consensus sequence libraries for repeat families, at least when operated using default parameters. Moreover, in our investigations RepeatGluer showed considerable limitations in the amount of data it can process (11 Mb maximum) compared to RepeatScout, RepeatFinder and PILER.
RepeatScout, RepeatFinder and PILER were used to study the 3-Mb dataset examined with RepeatGluer as well as the entire rice chromosome 12 sequence. When one compares the results produced by these tools in analysis of the 3-Mb sequence with those resulting from analysis of the full chromosomal sequence, it is clear that all three programs are able to identify a much larger percentage of repeats if they are given a longer substrate with which to work (Table 1). This observation, in part, can be explained by the fact that all ab initio tools require two or more copies of a ‘true positive’ repeat to be present in a query sequence(s) for that repeat to be recognized, and consequently increasing the total length of sequence analyzed by a tool increases the likelihood that it will encounter more than one copy of a given repeat. However, relationships between Sensitivity and input sequence length are clearly reflective of underlying algorithms as well. PILER, the only ab initio tool with a built-in repeat classification system, was especially ineffective with the 3-MB sequence, and while it gave better results with the entire chromosome as a substrate, it still missed many repeats detected by RMRB, RepeatScout and RepeatFinder. RepeatScout is a particularly attractive tool for investigation of new repetitive elements due to the compact nature of its consensus sequence library and the reasonable length of its consensus sequences (860 bp) (Table 1). RepeatFinder identifies about twice as much potentially novel repetitive DNA as RepeatScout, but classifies the repeats it identifies into 38 times as many families with shorter mean consensus sequence lengths (252 bp). However, because there are differences in the types of repeat elements these two tools identify (Figure 1), there may be an advantage to using both in tandem or parallel to identify potential repeats in assembled sequences. As indicated in Table 1, run times for RepeatScout and RepeatFinder were comparable, but substantially longer than that of PILER.
Sequence reads versus assembled sequences
As only a small proportion of species have had their entire genomes sequenced and assembled, ab initio tools that can find repeat elements in unassembled sequence data (e.g. ReAS) are likely to be needed for quite awhile. Additionally, because errors in assembly of complex genomes may go undetected for years, the developers of ReAS argue that using unassembled reads may permit more accurate discovery of repeats than use of assembled sequence data (15). However, the time and computational space requirements associated with searching numerous short sequence reads are substantially greater than searching an equal number of bases in a single assembled sequence. Moreover, spatial relationships between different elements cannot be elucidated from analysis of sequence reads. Consequently, researchers must weigh the advantages and disadvantages of performing sequence assembly prior to conducting repeat identification. In our opinion, identification of repeats using tools such as ReAS will likely facilitate characterization of repeats by providing reference data that can be used by RepeatMasker and similar library-dependent tools. RepeatFinder, RepeatScout and other ab initio repeat-finding tools that are tailored to work with assembled sequences are likely to be of most use in post-assembly discovery of previously undetected repeats.
Improving ab initio repeat identification tools
Based on work with these ab initio tools, we have noted several areas in which all of the tools could be improved. These general improvement areas are discussed below. Moreover, we encourage those interested in building new repeat-finding tools to consider the following features when developing their programs.
Parallelization – Some ab initio tools tested in this study are hobbled by long run times and/or limited processing abilities. As the amount of sequence data being generated daily is increasing at an astonishing rate, ab initio repeat-finding programs that are space and time efficient and that can accommodate whole (and multiple) chromosome sequences will become more and more important. Parallel solutions based on multiprocessor systems will undoubtedly be needed to tackle current and future analysis needs. ReAS is currently the only ab initio tool tested that provides an option to parallelize part of the detection process. However, any tool such as RepeatGluer that uses BLAST could potentially use a parallelized version of BLAST. Because data is being produced so quickly, new tool developers should be incorporating parallelization options into their software from the start of the design process.
Auto-optimization – as discussed above, biologists are unlikely to spend a significant amount of time optimizing informatics tools for specific datasets or applications. Moreover, some scientists may avoid optimization if they believe that it will introduce personal biases into the data analysis process. Consequently, we believe that whenever possible tools developed for sequence analysis should possess algorithms that conduct optimization in an automated fashion. Of note, ReAS does provide a utility that assists in the selection of appropriate parameter values for a dataset while the published instructions for RepeatScout provide a formula through which query sequence length can be taken into account in setting parameters—the other tools examined provide little guidance for the selection of parameters. If built-in optimization is not possible, explicit instructions should be provided for the user on how optimization can be conducted. ‘Auto-optimization’ and/or detailed optimization instructions will increase the likelihood that a tool is used by biologists in a productive and scientifically valid manner.
Documentation and user-friendliness – all of the ab initio repeat finders tested possessed extremely modest documentation and required substantial tinkering to install and run. In several cases, we had to contact the authors/developers of the tools multiple times to get installation/operation details that were not present in their publications. While addition of intuitive user interfaces and generation of quality documentation is difficult and may seem unnecessary to the programmer, ‘user-friendliness’ may be the most important factor in establishing a wide user base. Even the cleverest of repeat-identification algorithms may go unused if it is not put into a format that is readily utilizable by a broad array of scientists.
Repeat classification – PILER is unique among the ab initio tools studied in that it not only identifies repetitive sequences but also classifies them. Inclusion of classification abilities in other tools may increase their overall utility and encourage widespread use. However, the classification of repeats is continually changing as new types of elements and relationships between elements are being discovered (28). Consequently, inflexible classification schemes coded into the ab initio repeat identification programs are likely to be of less value than generalized classification algorithms that utilize upgradeable external repeat definition files.
Family numbers: practical and theoretical considerations
One of the most striking differences in the ab initio repeat finders tested was the wide range in size of the repeat consensus libraries they produced. Both ReAS and RepeatScout produced relatively compact libraries with Sensitivity values comparable to their competitors. Tools such as Recon and RepeatFinder produced larger libraries and marked more sequence as potential repetitive DNA, but the huge number of repeat families (i.e. consensus sequences) that each identified makes interfamily comparisons much more complex. A potential ‘best fit’ solution might be construction of sequence analysis pipelines that utilize two or more repeat-identification programs in tandem or parallel, e.g. Chouvarine et al. (29).
One means by which large consensus sequence libraries could be reduced to a manageable size would be to follow ab initio repeat identification with domain identification using systems such as MOSAIC (30), ProDom (31), Domain Organizer (32) and/or the A-bruijn approach (27). Indeed, Pevzner et al. (18) used the A-bruijn graph approach described in the RepeatGluer paper to model the domain structure of novel repeat regions. Based upon shared domains, highly similar repeat families could be merged into fewer, more general repeat family categories.
Exploring phylogenetic and evolutionary histories of repeats
The repetitive sequences detected by ab initio repeat finders have the potential to be further mined to explore phylogenetic and evolutionary histories of repeats. Specifically, the relative conservation of regions within the members of a repeat family can be used to reconstruct the evolutionary history of that family (33–36). Moreover, interfamily comparisons can reveal complex and interesting relationships between families (37,38). Such relationships are worth exploring from an intragenomic perspective as well as for purposes of comparative genomics (27,39,40).
Repeats, genes and repeated genes
Ab initio repeat finders examine sequences or sequence sets looking for nucleotide motifs that occur more commonly than expected if nucleotide distribution were random. Consequently, these tools do not discriminate between transposons found in multiple copies and genes found in multiple copies. Whole-genome sequencing and re-sequencing have revealed considerably greater variation in gene copy numbers between and within species than previously thought (41). Consequently, users of ab initio repeat discovery tools should be aware that some of the sequences in their repeat consensus libraries may be repeated cellular genes (i.e. non-transposon genes). Screening of repeats against EST unigenes and known gene sequences represents a means of limiting the presence of genes in repeat databases. However, the discovery of transposon-derived ‘repeat-associated small-interfering RNAs’ (rasiRNAs) has revealed that some short transcribed repeats are involved in important nuclear processes. Specifically, rasiRNAs appear to play a role in heterochromatin establishment and/or maintenance through interaction with homologous repetitive regions of the genome (42). Consequently, rasiRNAs are arguably structural RNAs which are often classified as genes (43). Regardless, of how one defines genes, it does appear that as more diverse groups of sequences are found to play roles in gene regulation and cell structure, the study of repetitive DNA will focus more on functional aspects of repetitive elements, and the line between repetitive DNA and genes will become increasingly blurry.
CONCLUSIONS
In conclusion, we have shown that there is profound variation in the performance of currently available ab initio repeat finders and that there remains substantial room for improvement in algorithms for detection and characterization of novel repeats. In general, algorithms that produce more compact repeat family descriptions and recognize a sizeable portion of known repeats appear to provide a more useful starting place for further study of novel repeat families in newly sequenced organisms. In addition, all of the tools examined were quite difficult to use indicating the need for better user interfaces and auto-optimization. As larger genomes are sequenced, efficiency and scalability will become increasingly important.
ACKNOWLEDGEMENTS
This research was supported, in part, by the National Science Foundation (DBI-0421717 to D.G.P. and EPS-0556308 to S.M.B.), the United States Department of Agriculture (CSREES-2006-34506-17290 and ARS-58-6402-7-241 to D.G.P.) and the Mississippi Corn Promotion Board (to D.G.P.). We would also like to thank Nan Wang of the Department of Computer Science and Engineering at MS State for generating the synthetic chromosome sequences used as controls. Funding to pay the Open Access publication charges for this article was provided by National Science Foundation award DBI-0421717.
Conflict of interest statement. None declared.
REFERENCES
- 1.Britten RJ, Kohne DE. Repeated sequences in DNA. Science. 1968;161:529–540. doi: 10.1126/science.161.3841.529. [DOI] [PubMed] [Google Scholar]
- 2.Bennetzen JL. Transposable element contributions to plant gene and genome evolution. Plant Mol. Biol. 2000;42:251–269. [PubMed] [Google Scholar]
- 3.Gao X, Voytas DF. A eukaryotic gene family related to retroelement integrases. Trends Genet. 2005;21:133–137. doi: 10.1016/j.tig.2005.01.006. [DOI] [PubMed] [Google Scholar]
- 4.Dooner HK, Weil CF. Give-and-take: interactions between DNA transposons and their host plant genomes. Curr. Opin. Genet. Dev. 2007;17:486–492. doi: 10.1016/j.gde.2007.08.010. [DOI] [PubMed] [Google Scholar]
- 5.Lai J, Li Y, Messing J, Dooner HK. Gene movement by Helitron transposons contributes to the haplotype variability of maize. Proc. Natl Acad. Sci. USA. 2005;102:9068–9073. doi: 10.1073/pnas.0502923102. [DOI] [PMC free article] [PubMed] [Google Scholar]
- 6.Morgante M, Brunner S, Pea G, Fengler K, Zuccolo A, Rafalski A. Gene duplication and exon shuffling by helitron-like transposons generate intraspecies diversity in maize. Nat. Genet. 2005;37:997–1002. doi: 10.1038/ng1615. [DOI] [PubMed] [Google Scholar]
- 7.Jiang N, Bao Z, Zhang X, Eddy SR, Wessler SR. Pack-MULE transposable elements mediate gene evolution in plants. Nature. 2004;431:569–573. doi: 10.1038/nature02953. [DOI] [PubMed] [Google Scholar]
- 8.Müller HJ. Types of viable variations induced by X-rays in Drosophila. J. Genet. 1930;22:299–334. [Google Scholar]
- 9.Henikoff S. Position-effect variegation after 60 years. Trends Genet. 1990;6:422–426. doi: 10.1016/0168-9525(90)90304-o. [DOI] [PubMed] [Google Scholar]
- 10.Assaad FF, Tucker KL, Signer ER. Epigenetic repeat-induced gene silencing (RIGS) in Arabidopsis. Plant Mol. Biol. 1993;22:1067–1085. doi: 10.1007/BF00028978. [DOI] [PubMed] [Google Scholar]
- 11.Zuckerkandl E, Hennig W. Tracking heterochromatin. Chromosoma. 1995;104:75–83. doi: 10.1007/BF00347689. [DOI] [PubMed] [Google Scholar]
- 12.Lippman Z, Gendrel AV, Black M, Vaughn MW, Dedhia N, McCombie WR, Lavine K, Mittal V, May B, Kasschau KD, et al. Role of transposable elements in heterochromatin and epigenetic control. Nature. 2004;430:471–476. doi: 10.1038/nature02651. [DOI] [PubMed] [Google Scholar]
- 13.Jurka J, Kapitonov VV, Pavlicek A, Klonowski P, Kohany O, Walichiewicz J. Repbase Update, a database of eukaryotic repetitive elements. Cytogenet. Genome Res. 2005;110:462–467. doi: 10.1159/000084979. [DOI] [PubMed] [Google Scholar]
- 14.Saha S, Bridges S, Magbanua ZV, Peterson DG. Computational approaches and tools used in identification of dispersed repetitive DNA sequences. Tropical Plant Biol. 2008 doi: 10.1007/s12042-007-9007-5. [Google Scholar]
- 15.Li R, Ye J, Li S, Wang J, Han Y, Ye C, Wang J, Yang H, Yu J, Wong GK, et al. ReAS: recovery of ancestral sequences for transposable elements from the unassembled reads of a whole genome shotgun. PLoS Comput. Biol. 2005;1:e43. doi: 10.1371/journal.pcbi.0010043. [DOI] [PMC free article] [PubMed] [Google Scholar]
- 16.Price AL, Jones NC, Pevzner PA. De novo identification of repeat families in large genomes. Bioinformatics. 2005;21(Suppl. 1):i351–i358. doi: 10.1093/bioinformatics/bti1018. [DOI] [PubMed] [Google Scholar]
- 17.Bao Z, Eddy SR. Automated de novo identification of repeat sequence families in sequenced genomes. Genome Res. 2002;12:1269–1276. doi: 10.1101/gr.88502. [DOI] [PMC free article] [PubMed] [Google Scholar]
- 18.Pevzner PA, Tang H, Tesler G. De novo repeat classification and fragment assembly. Genome Res. 2004;14:1786–1796. doi: 10.1101/gr.2395204. [DOI] [PMC free article] [PubMed] [Google Scholar]
- 19.Volfovsky N, Haas BJ, Salzberg SL. A clustering method for repeat analysis in DNA sequences. Genome Biol. 2001;2 doi: 10.1186/gb-2001-2-8-research0027. research0027.1-0027.11. [DOI] [PMC free article] [PubMed] [Google Scholar]
- 20.Edgar RC, Myers EW. PILER: identification and classification of genomic repeats. Bioinformatics. 2005;21(Suppl. 1):i152–i158. doi: 10.1093/bioinformatics/bti1003. [DOI] [PubMed] [Google Scholar]
- 21.Dunning Hotopp JC, Lin M, Madupu R, Crabtree J, Angiuoli SV, Eisen J, Seshadri R, Ren Q, Wu M, Utterback TR, et al. Comparative genomics of emerging human ehrlichiosis agents. PLoS Genet. 2006;2:e21. doi: 10.1371/journal.pgen.0020021. [DOI] [PMC free article] [PubMed] [Google Scholar]
- 22.Ogata H, Renesto P, Audic S, Robert C, Blanc G, Fournier PE, Parinello H, Claverie JM, Raoult D. The genome sequence of Rickettsia felis identifies the first putative conjugative plasmid in an obligate intracellular parasite. PLoS Biol. 2005;3:e248. doi: 10.1371/journal.pbio.0030248. [DOI] [PMC free article] [PubMed] [Google Scholar]
- 23.de Cambiaire JC, Otis C, Lemieux C, Turmel M. The complete chloroplast genome sequence of the chlorophycean green alga Scenedesmus obliquus reveals a compact gene organization and a biased distribution of genes on the two DNA strands. BMC Evol. Biol. 2006;6:37. doi: 10.1186/1471-2148-6-37. [DOI] [PMC free article] [PubMed] [Google Scholar]
- 24.Larson JH, Marron BM, Beever JE, Roe BA, Lewin HA. Genomic organization and evolution of the ULBP genes in cattle. BMC Genomics. 2006;7:227. doi: 10.1186/1471-2164-7-227. [DOI] [PMC free article] [PubMed] [Google Scholar]
- 25.International Rice Genome Sequencing Project. The map-based sequence of the rice genome. Nature. 2005;436:793–800. doi: 10.1038/nature03895. [DOI] [PubMed] [Google Scholar]
- 26.Chenna R, Sugawara H, Koike T, Lopez R, Gibson TJ, Higgins DG, Thompson JD. Multiple sequence alignment with the Clustal series of programs. Nucleic Acids Res. 2003;31:3497–3500. doi: 10.1093/nar/gkg500. [DOI] [PMC free article] [PubMed] [Google Scholar]
- 27.Zhi D, Raphael BJ, Price AL, Tang H, Pevzner PA. Identifying repeat domains in large genomes. Genome Biol. 2006;7:R7. doi: 10.1186/gb-2006-7-1-r7. [DOI] [PMC free article] [PubMed] [Google Scholar]
- 28.Wicker T, Sabot F, Hua-Van A, Bennetzen JL, Capy P, Chalhoub B, Flavell A, Leroy P, Morgante M, Panaud O, et al. A unified classification system for eukaryotic transposable elements. Nat. Rev. Genet. 2007;8:973–982. doi: 10.1038/nrg2165. [DOI] [PubMed] [Google Scholar]
- 29.Chouvarine P, Saha S, Peterson DG. An automated, high-throughput sequence read classification pipeline for preliminary genome characterization. Anal. Biochem. 2008;373:78–87. doi: 10.1016/j.ab.2007.08.008. [DOI] [PubMed] [Google Scholar]
- 30.Andre C, Vincens P, Boisvieux JF, Hazout S. MOSAIC: segmenting multiple aligned DNA sequences. Bioinformatics. 2001;17:196–197. doi: 10.1093/bioinformatics/17.2.196. [DOI] [PubMed] [Google Scholar]
- 31.Servant F, Bru C, Carrere S, Courcelle E, Gouzy J, Peyruc D, Kahn D. ProDom: automated clustering of homologous domains. Brief. Bioinform. 2002;3:246–251. doi: 10.1093/bib/3.3.246. [DOI] [PubMed] [Google Scholar]
- 32.Tempel S, Giraud M, Lavenier D, Lerman IC, Valin AS, Couee I, Amrani AE, Nicolas J. Domain organization within repeated DNA sequences: application to the study of a family of transposable elements. Bioinformatics. 2006;22:1948–1954. doi: 10.1093/bioinformatics/btl337. [DOI] [PubMed] [Google Scholar]
- 33.Ray DA, Xing J, Hedges DJ, Hall MA, Laborde ME, Anders BA, White BR, Stoilova N, Fowlkes JD, Landry KE, et al. Alu insertion loci and platyrrhine primate phylogeny. Mol. Phylogenet. Evol. 2005;35:117–126. doi: 10.1016/j.ympev.2004.10.023. [DOI] [PubMed] [Google Scholar]
- 34.Ray DA, Batzer MA. Tracking Alu evolution in New World primates. BMC Evol. Biol. 2005;5:51. doi: 10.1186/1471-2148-5-51. [DOI] [PMC free article] [PubMed] [Google Scholar]
- 35.Pritham EJ, Putliwala T, Feschotte C. Mavericks, a novel class of giant transposable elements widespread in eukaryotes and related to DNA viruses. Gene. 2007;390:3–17. doi: 10.1016/j.gene.2006.08.008. [DOI] [PubMed] [Google Scholar]
- 36.Kapitonov VV, Jurka J. Rolling-circle transposons in eukaryotes. Proc. Natl Acad. Sci. USA. 2001;98:8714–8719. doi: 10.1073/pnas.151269298. [DOI] [PMC free article] [PubMed] [Google Scholar]
- 37.Wicker T, Robertson JS, Schulze SR, Feltus FA, Magrini V, Morrison JA, Mardis ER, Wilson RK, Peterson DG, Paterson AH, et al. The repetitive landscape of the chicken genome. Genome Res. 2005;15:126–136. doi: 10.1101/gr.2438005. [DOI] [PMC free article] [PubMed] [Google Scholar]
- 38.Kajikawa M, Okada N. LINEs mobilize SINEs in the eel through a shared 3′ sequence. Cell. 2002;111:433–444. doi: 10.1016/s0092-8674(02)01041-3. [DOI] [PubMed] [Google Scholar]
- 39.Zhang X, Wessler SR. Genome-wide comparative analysis of the transposable elements in the related species Arabidopsis thaliana and Brassica oleracea. Proc. Natl Acad. Sci. USA. 2004;101:5589–5594. doi: 10.1073/pnas.0401243101. [DOI] [PMC free article] [PubMed] [Google Scholar]
- 40.Stein LD, Bao Z, Blasiar D, Blumenthal T, Brent MR, Chen N, Chinwalla A, Clarke L, Clee C, Coghlan A, et al. The genome sequence of Caenorhabditis briggsae: a platform for comparative genomics. PLoS Biol. 2003;1:E45. doi: 10.1371/journal.pbio.0000045. [DOI] [PMC free article] [PubMed] [Google Scholar]
- 41.Freeman JL, Perry GH, Feuk L, Redon R, McCarroll SA, Altshuler DM, Aburatani H, Jones KW, Tyler-Smith C, Hurles ME, et al. Copy number variation: new insights in genome diversity. Genome Res. 2006;16:949–961. doi: 10.1101/gr.3677206. [DOI] [PubMed] [Google Scholar]
- 42.Aravin AA, Lagos-Quintana M, Yalcin A, Zavolan M, Marks D, Snyder B, Gaasterland T, Meyer J, Tuschl T. The small RNA profile during Drosophila melanogaster development. Dev. Cell. 2003;5:337–350. doi: 10.1016/s1534-5807(03)00228-4. [DOI] [PubMed] [Google Scholar]
- 43.Alberts B, Bray D, Lewis J, Raff M, Roberts K, Watson JD. Molecular Biology of the Cell. New York: Garland Publishing, Inc.; 1994. [Google Scholar]