


Abstract
We present a systematic study of B-DNA flexibility in aqueous solution using long-scale molecular dynamics simulations with the two more recent versions of nucleic acids force fields (CHARMM27 and parmbsc0) using four long duplexes designed to contain several copies of each individual base pair step. Our study highlights some differences between pambsc0 and CHARMM27 families of simulations, but also extensive agreement in the representation of DNA flexibility. We also performed additional simulations with the older AMBER force fields parm94 and parm99, corrected for non-canonical backbone flips. Taken together, the results allow us to draw for the first time a consensus molecular dynamics picture of B-DNA flexibility.
INTRODUCTION
Sequencing programs (1–6) have increased dramatically our knowledge on the primary structure of nucleic acids and proteins for different species (6–8) and even for entire ecosystems (9). However, the intrinsic limitations of the sequencing projects became clear when researchers realized that the mechanisms allowing the supramolecular organization of the genome and the control of its expression were not directly coded in the sequence, but depend on the chromatin structure and flexibility (6). For example, we and others have found that promoter and regulatory regions display unusual physical properties, both in prokaryotes (10,11) and eukaryotes (12–19). Furthermore, nucleosome condensation of DNA, which is crucial for gene regulation is tightly related to DNA structure and flexibility, and unusual DNA structures are known to play a key role in DNA recombination (20–24). Finally, the mechanisms used by the cell to maintain sequence integrity are dependent on DNA mechanical properties (25–27). The emerging idea behind these findings is the existence of a hidden structural and deformation code, which has been conserved throughout the evolution and that helps the cell to complement the primary information coded in the DNA sequence (19,28–30).
The general structure of B-DNA is known since the 1950s (31), but only since the 1980s it is available in atomistic detail. Unfortunately, the dependence of structure on sequence is not so well determined, since certain nucleotide sequences have problems to crystallize, or do not produce well-defined NMR maps. The polymorphism of DNA has introduced additional problems: changes in crystallization buffer or the presence of ligands can generate artefactual structures for some sequences, as is the case of many A-forms deposited in the PDB database for duplex and triplex DNA and DNA–RNA hybrids. As a result, despite the large amount of structural information available, there is still no complete experimentally derived map of the conformational space of B-DNA (Table 1). Theoretical techniques (32,33), in particular molecular dynamics (MD) simulations (34–36) then emerge as a useful tool to complement the already existing structural information on physiological DNA (37–39).
Table 1.
Number of unique sequences in antiparallel DNA duplexes of different lengths and number of cases for which experimental data are available
| Length | No of sequences | No of experimental data | No of good sampling |
|---|---|---|---|
| Base pair dimer | 10 | 10 | 9 |
| Trimer | 32 | 31 | 9 |
| Tetramer | 136 | 83 | 9 |
| Pentamer | 512 | 128 | 5 |
The number (No. good sampling) of cases for which there are 15 or more experimental values for helical parameters is indicated.
Different experimental techniques can be used to obtain macroscopic information of DNA harmonic deformability (40,41). Unfortunately, the microscopic analysis is much more difficult, and in fact most of the ‘experimental microscopic information about flexibility is based on the analysis of structural databases (mostly X-ray structures), and on the assumption that flexible molecules display larger structural diversity than rigid ones. This approach has been successfully used to obtain rough descriptions of DNA deformability (30,39), but presents two main problems: (i) there is no guarantee that the type of deformation induced by crystal lattice or ligands on the DNA will be the same as the one spontaneously followed by relaxed DNA and (ii) statistical quality of the stiffness estimates requires a large number of structures for a given sequence, and there are many sequences for which no such wide structural information is available (Table 1). Once again, MD appears as an excellent complementary tool to experimental techniques.
MD simulations on DNA started in the mid-80s (42), but only after the mid-90s unrestrained calculations were possible in the nanosecond time scale (43–45). Since then, MD has been widely used to study a variety of normal and unusual forms of DNA and other nucleic acids (34–36, 46–50). Many MD studies of DNA have been focused on structural aspects, but Lankas and others (51–53), and Gonzalez and Maddocks (54) pointed to the possibility to use MD trajectories to obtain information on the flexibility of DNA, which can be then incorporated into ‘pseudoharmonic’ mesoscopic models to evaluate properties of very long fragments of DNA (36,55,56) or to improve the prediction of protein–DNA binding affinities (57,58). The pseudoharmonic mesoscopic approach assumes that global DNA deformability can be described as a combination of six local harmonic deformabilities (three translations and three rotations) at the base pair level and despite the neglect of non-harmonic terms, which can be important to describe large localized structural changes, such as the kinks (59) provides a reasonable representation of DNA flexibility.
In this article, using state-of-the-art simulation, techniques we will re-visit the field of DNA flexibility, trying to obtain for the first time a global picture of DNA deformability using four long duplexes containing different copies of each non-redundant dinucleotide step. Based on our previous microsecond simulation (60), the trajectories were extended to 100 ns, which is expected to be enough to capture the most important dynamic properties of these oligomers. Furthermore, to obtain a robust picture of DNA flexibility, and mimicking our recent studies in proteins (61), all simulations were repeated using the two more recently developed nucleic acids force-fields: CHARMM27 (62,63) and parmbsc0 (64). This theoretical effort provides for the first time a rather complete picture of the structural and flexibility properties of B-DNA.
METHODS
Selection of sequences to study
In a previous paper (53) two duplexes were designed as models for the study of flexibility of duplex B-DNA: SEQ1: d(GCCTATAAACGCCTATAA) and SEQ2: d(CTAGGTGGATGACTCATT). The sequences were selected to: (i) yield normal B-DNA, (ii) be long enough to fully represent a complete DNA turn and (iii) contain copies of the 10 unique dinucleotide steps: d(AA)·d(TT), d(AC)·d(GT), d(AG)·d(CT), d(AT)·d(AT), d(CA)·d(TG), d(CC)·d(GG), d(CG)·d(CG), d(GA)·d(TC), d(GC)·d(GC) and d(TA)·d(TA). In this article, to obtain a more complete picture and to have more examples of all the different steps we add two more sequences, selected under similar premises: SEQ3: d(CACGGAACCGGTTCCGTG) and SEQ4: d(GGCGCGCACCACGCGCGG).
System set-up and simulation conditions
Starting structures were created using standard B-DNA fibre coordinates and were then immersed in a box containing ∼10 600 water molecules adding then Na+ to obtain neutral systems using CMIP calculations (65) to optimize the original positions of the ions. All systems were then optimized, thermalized (298 K) and equilibrated using our standard multi-step protocol (66,67), doubling the simulation length at every window. Final structures were further re-equilibrated for 10 ns prior to data collection. Simulations were extended for 100 ns in the isothermic isobaric ensemble (P = 1 atm, T = 298 K) using periodic boundary conditions and Particle Mesh Ewald calculations (44). A time step of 1 fs was used in conjunction with SHAKE (68) or RATTLE (69) algorithms for maintaining bonds involving hydrogen atoms at equilibrium distances. Atomic interactions were represented using parmbsc0 (64) or CHARMM27 (62,63) force fields and the TIP3P water model combined with standard parmbsc0 and CHARMM27 ion models. For comparison, additional simulations (20 ns each) were performed using previous AMBER force fields parm94 (45) and parm99 (70,71) for SEQ1 and SEQ2, implementing an information-bias procedure to avoid flips of α/γ backbone dihedral angles to non-canonical substates: every time an α/γ transition occurred, the trajectory was restarted using the coordinates and velocities found ∼100 ps before the transition; the flip then never occurred again at the same time point. These simulations are called parm94* and parm99*.
All CHARMM27 simulations were carried out using NAMD (72,73) computer program, while the pmemd module of AMBER8.1 (74) computer program was used for parmbs0 and parm94*/99* calculations [previous work (61) demonstrated that the two computer programs provide equivalent results for identical force fields]. CHARMM27/NAMD calculations gives an output of 0.03 s/step using 16 Myrinet-connected Power PC processors, while with the same hardware parmbsc0/pmemd gives 0.07 s/step.
Analysis of trajectories
Standard geometrical descriptors and helical analysis tools (see below) were used to describe the main structural characteristics of the duplexes. Unless otherwise stated, analysis was performed considering the central 16-mer portion of the duplexes. The potential for interactions of the duplexes was analysed by computing the classical molecular interaction potentials (CMIP; at −5 kcal/mol) taking Na+ as a probe.
The essential dynamics of the different duplexes was derived by diagonalization of the covariance matrix (36,75), which yields a set of eigenvectors {νi} and eigenvalues {λi} describing the nature and amplitude of the different essential movements. Similarly, the eigenvalues correspond to frequencies (ωi) if they are obtained by diagonalization of the mass-weighted covariance matrix. Such frequencies can be manipulated to yield entropies (76) in the pseudo-harmonic limit [see Equation (1)].
| 1 |
where  , and the sum extends to all the non-trivial vibrations (all the other symbols have the standard physical meaning).
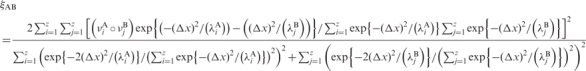
In order to determine the similarity in the set of essential movements determined by any two trajectories we compared the corresponding eigenvectors using absolute and relative similarity indexes [see Equations (2) and (3) and references (75 and 77)] and the associated Z-scores [see Equation (4)]. The absolute similarity index is defined by
 |
2 |
where the indexes A, B refer to the two trajectories and λi is the eigenvalue (in Å2) associated with eigenvector νi. The sum is extended to the important modes (i.e. those explaining ∼90% variance, in our case z ≈ 30). The Δx is set to a standard value for DNA duplexes (77). Note that the similarity index ranges from 0 (no similarity) to 1 (identity). The relative similarity index is defined as
| 3 |
where the self-similarity indexes  stand for the value obtained by comparing the first and second half of the same trajectory. The associated Z-score value is computed as:
| 4 |
where the random models were obtained by diagonalization of a pseudo-covariance matrix obtained by random permutation of the atoms for each snapshot. The standard deviation (SD) was obtained by considering 500 different random models (78). Note that the Zscore determines the statistical significance of a given δ-value. Z-scores above 1 indicate a significant dissimilarity between model and background similarities.
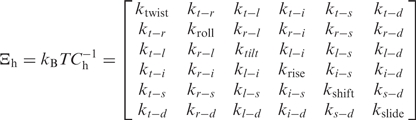
As described elsewhere (53), elastic force constants associated with helical deformation at the base pair step level were determined by inversion of the covariance matrix in helical space, which yields stiffness matrices [Ξh; see Equation (5)] whose diagonal elements provide the stiffness constants associated with pure rotational (twist, roll and tilt) and translational (rise, shift and slide) deformations within the given step:
 |
5 |
where Ch is the covariance matrix in helical space.
Standard geometrical and energetic analysis was done using the ptraj module of AMBER8.1 and 3DNA (79) programs as well as in-house programs. Essential dynamics was done with the analysis modules in the PCAZIP program (which can be downloaded from the following MMB and CCPB websites: http://mmb.pcb.ub.es/software/pcasuite.html and http://www.ccpb.ac.uk/events/workshops/previous/analysis/), and other ‘in house’ programs. The different trajectories collected here are available in compressed format (95% variance threshold) at http://mmb.pcb.ub.es/~raist/CONSENSUS and can be decompressed with the PCAZIP program (80).
Structural database analysis
X-ray naked DNA dataset was built according to Perez et al. (30). For the NMR dataset we followed Olson's et al. ‘culling’ of base pair step parameters and those steps outside the 3 SD limit from the average for any of the six parameters was excluded from the study. Averaging of the steps was done by using both strands in each oligo. Generic averages and standard deviations were prepared using equal weight for each of the 16 possible base pairs. The effective temperature used to describe force constants using Olson et al.apos;s (39) data are 295 K as described in Lankas et al. (53).
RESULTS AND DISCUSSION
General structure
The two force fields studied here yield stable trajectories in the 100-ns simulation time, sampling regions of conformation space expected for canonical B-DNA (Figure 1). Detailed analysis of root mean square deviation (RMSD) plots demonstrates that CHARMM27 always yields conformations ∼1 Å closer to the fibre B-DNA structure than parmbsc0 (no major differences are in general found if the reference structure is created by using crystal-averaged helical parameters for each step; Figure 1). In all cases, oscillations in RMSD are smaller for CHARMM27 than for parmbsc0 calculations, suggesting a stiffer simulation in the first case.
Figure 1.

RMSd (in Å) of sampled structures from fibre conformation (in red). Smoothed RMSd (in black) from ideal structures created from the average helical crystal parameters for each sequence is also displayed.
The distribution of helical parameters averaged over the central 16mer of the four sequences show Gaussian-like profiles centred in positions rather close to those expected from average values derived from experimental structures (Figure 2 and Table 2). On average, all parameters, except rise, are closer to the values derived from NMR experiments in solution. Shift, tilt and rise distributions are almost identical in both force fields, while small differences are found for the other three helical parameters. Thus, parmbsc0 calculations show slide distributions centred ∼−0.5 Å (close to the value obtained by analysis of NMR structures), while CHARMM27 distributions are centred at 0.0 Å, closer to the estimate obtained from X-ray data. Both force fields give roll distributions centred at positive values: parmbsc0 around 3.5°, and CHARMM27 around 6°, parmbsc0 being closer to the experimental estimates. Finally, MD simulations yield average twist around 33 (parmbsc0) or 34° (CHARMM27), while experimental data suggest slightly larger values (35.5 from X-ray data and 34.5 from NMR experiments). Considering the range of uncertainties in the averaged experimental measures (arising from packing effect, low resolution, incomplete sampling, reduced hydration, etc.) noted in the standard deviations (Table 2) we can conclude that both force fields provide a quite reasonable distribution of helical parameters.
Figure 2.

Distribution of base pair step helical parameters averaged, for each snapshot, over the central 16-bp portion of each sequence. Translational parameters are in angstroms and rotational parameters in degrees. Values for parmbsc0 simulations are represented by lines; CHARMM27 values correspond to lines with points. For comparison, sequence-dependent average values based on crystal data (black) and values averaged over all available nmr data (magenta) are shown as straight vertical lines with 1 SD confidence intervals (dotted lines). Histograms were constructed using 50 bins between the maximum and minimum values for each parameter.
Table 2.
Averages and standard deviations of helical parameters for the different dinucleotide steps
| Step | Shift | Slide | Rise | Tilt | Roll | Twist |
|---|---|---|---|---|---|---|
| AA•TT (4/55) | −0.19 ± 0.11 | −0.42 ± 0.13 | 3.33 ± 0.04 | −2.02 ± 0.40 | 2.74 ± 0.60 | 33.57 ± 1.25 |
| −0.30 ± 0.02 | −0.00 ± 0.02 | 3.37 ± 0.03 | −3.28 ± 0.63 | 5.89 ± 0.41 | 35.62 ± 0.74 | |
| 0.11 ± 0.30 | −0.16 ± 0.36 | 3.25 ± 0.15 | −1.32 ± 2.13 | 1.43 ± 4.78 | 35.77 ± 3.87 | |
| AC•GT (7/18) | 0.05 ± 0.09 | −0.74 ± 0.14 | 3.37 ± 0.05 | −1.06 ± 0.30 | 0.01 ± 0.70 | 33.38 ± 0.98 |
| 0.37 ± 0.05 | −0.16 ± 0.08 | 3.20 ± 0.06 | 0.12 ± 0.82 | 3.44 ± 0.13 | 31.96 ± 1.02 | |
| 0.35 ± 0.40 | −0.39 ± 0.28 | 3.20 ± 0.19 | 0.02 ± 2.10 | 1.73 ± 2.22 | 32.37 ± 3.07 | |
| AG•CT (4/10) | −0.33 ± 0.04 | −0.65 ± 0.20 | 3.39 ± 0.08 | −2.70 ± 0.31 | 2.83 ± 0.88 | 32.06 ± 1.29 |
| 0.00 ± 0.03 | −0.19 ± 0.09 | 3.31 ± 0.07 | −3.02 ± 0.66 | 6.45 ± 0.50 | 31.45 ± 1.41 | |
| 0.35 ± 0.29 | 0.34 ± 0.39 | 3.23 ± 0.15 | −2.19 ± 1.73 | 5.54 ± 3.73 | 28.80 ± 5.70 | |
| AT•AT (3/44) | 0.00 ± 0.14 | −0.77 ± 0.06 | 3.14 ± 0.03 | 0.00 ± 0.49 | 1.47 ± 0.35 | 28.59 ± 0.91 |
| 0.00 ± 0.08 | −0.36 ± 0.05 | 3.16 ± 0.02 | 0.00 ± 0.42 | 5.02 ± 0.64 | 28.12 ± 1.23 | |
| 0.00 ± 0.33 | −0.57 ± 0.19 | 3.27 ± 0.19 | 0.00 ± 2.85 | −1.02 ± 3.64 | 31.32 ± 3.78 | |
| CA•TG (5/32) | −0.33 ± 0.13 | −0.22 ± 0.07 | 3.21 ± 0.06 | 0.43 ± 0.49 | 9.25 ± 0.93 | 28.44 ± 1.59 |
| −0.23 ± 0.13 | −0.07 ± 0.02 | 3.46 ± 0.07 | −0.12 ± 0.23 | 9.64 ± 1.77 | 33.43 ± 0.97 | |
| 0.01 ± 0.26 | 1.85 ± 1.01 | 3.14 ± 0.32 | 0.05 ± 2.76 | −0.87 ± 6.76 | 43.65 ± 8.31 | |
| CC•GG (8/21) | 0.11 ± 0.12 | −0.76 ± 0.17 | 3.56 ± 0.07 | −0.44 ± 0.69 | 4.58 ± 0.62 | 34.19 ± 1.82 |
| 0.01 ± 0.08 | −0.18 ± 0.12 | 3.55 ± 0.03 | −0.38 ± 0.58 | 5.34 ± 0.98 | 35.50 ± 1.51 | |
| 0.16 ± 0.58 | 0.47 ± 0.54 | 3.29 ± 0.20 | 3.46 ± 2.74 | 5.35 ± 3.72 | 34.60 ± 7.57 | |
| CG•CG (8/64) | 0.00 ± 0.14 | −0.07 ± 0.08 | 3.26 ± 0.12 | 0.00 ± 0.78 | 6.45 ± 1.06 | 31.89 ± 3.66 |
| 0.00 ± 0.14 | 0.29 ± 0.16 | 3.46 ± 0.08 | 0.00 ± 1.06 | 8.99 ± 1.15 | 33.92 ± 1.40 | |
| 0.00 ± 0.54 | 0.52 ± 0.47 | 3.31 ± 0.34 | 0.00 ± 3.76 | 3.83 ± 4.83 | 33.48 ± 6.44 | |
| GA•TC (5/47) | −0.21 ± 0.16 | −0.29 ± 0.19 | 3.37 ± 0.03 | −0.50 ± 0.74 | 2.14 ± 1.13 | 36.47 ± 1.01 |
| −0.28 ± 0.06 | 0.26 ± 0.04 | 3.35 ± 0.01 | −0.80 ± 0.62 | 3.78 ± 0.54 | 38.65 ± 0.42 | |
| −0.20 ± 0.49 | 0.00 ± 0.39 | 3.50 ± 0.46 | −0.99 ± 2.81 | 0.33 ± 3.76 | 41.85 ± 6.04 | |
| GC•GC (5/67) | 0.00 ± 0.12 | −0.29 ± 0.12 | 3.41 ± 0.02 | 0.00 ± 0.33 | −1.08 ± 0.68 | 36.07 ± 0.60 |
| 0.00 ± 0.08 | −0.18 ± 0.04 | 3.27 ± 0.01 | 0.00 ± 0.54 | 3.19 ± 0.26 | 35.58 ± 0.37 | |
| 0.00 ± 0.86 | 0.31 ± 0.41 | 3.46 ± 0.31 | 0.00 ± 4.40 | −6.41 ± 5.22 | 41.35 ± 3.97 | |
| TA•TA (3/9) | 0.00 ± 0.30 | −0.15 ± 0.07 | 3.27 ± 0.04 | 0.00 ± 1.89 | 8.32 ± 1.37 | 32.66 ± 0.43 |
| 0.00 ± 0.30 | 0.30 ± 0.06 | 3.39 ± 0.07 | 0.00 ± 1.21 | 5.57 ± 2.36 | 36.63 ± 0.95 | |
| 0.00 ± 0.37 | 0.38 ± 0.74 | 3.34 ± 0.21 | 0.00 ± 2.47 | −0.58 ± 4.12 | 43.45 ± 5.17 | |
| Generic | 0.00 ± 0.20 | −0.47 ± 0.24 | 3.35 ± 0.11 | 0.00 ± 1.28 | 3.64 ± 3.12 | 32.84 ± 2.51 |
| 0.00 ± 0.21 | −0.04 ± 0.20 | 3.36 ± 0.11 | 0.00 ± 1.61 | 5.74 ± 2.06 | 34.22 ± 2.72 | |
| 0.00 ± 0.20 | 0.30 ± 0.67 | 3.29 ± 0.11 | 0.00 ± 1.56 | 1.43 ± 3.11 | 36.48 ± 5.17 |
The parmbsc0, CHARMM27 (italics) and X-ray values (bold) are shown. Values for simulations were obtained from the time averages computed for individual steps in each sequence. The standard deviations thus refer to the environment dependence of the parameters and not to their fluctuations in time. The generic values are means and standard deviations computed from the sequence-dependent averages shown in the table, weighting equally all the 16 possible steps. Rotational parameters are in degrees and translational ones in Å. Complementary steps (e.g. AG and CT) have the same average except for a change in sign of shift and tilt, and the same standard deviation. In parentheses is the number of copies of each step taken from the simulated oligomers and from the X-ray database (bold).
In order to complement the study of the global shape of the duplexes we analysed the groove geometries (81) obtained in both series of simulations (Figure 3). Groove geometry is especially important since it determines the ability of the duplex to be recognized by ligands (either small drugs or proteins). Analysis of the average groove distribution for the four sequences illustrates probably the most significant difference between parmbsc0 and CHAMM27 calculations. Thus, parmbsc0 groove widths are centred at 19 Å (major) and 12–13 Å (minor), with a major–minor width difference around 6 Å. In CHARMM27 calculations, the major groove is narrower (around 17 Å) and the minor is wider (around 13–14 Å), reducing then major–minor asymmetry to only 3–4 Å. It is worth to note that X-ray data suggest widths around 17 (major) and 11 Å (minor), values that are enlarged by ∼1 Å if NMR data are considered; irrespective of the source of experimental information, the major–minor difference is around 6 Å, closer to parmbsc0 values. Quite surprisingly, the different geometry of the grooves in parmbsc0 and CHARMM27 simulations leads to only small changes in the predicted pattern of interactions of the duplexes with cations (Figure 4), which suggest that in general reasonably similar information on DNA interactions could be obtained for parmbsc0 and CHARMM27 simulations.
Figure 3.

Evolution of groove widths (in angstroms) in time for parmbsc0 and CHARMM27 simulations. Average experimental values are shown as horizontal straight lines (crystal: black, NMR: blue and magenta). Groove widths were calculated as P-P distances according to El Hassan and Calladine's work (81).
Figure 4.

Classical interaction potential (CMIP, in purple) of average parmbsc0 and CHARMM27 DNA conformations. Grid was constructed with a 0.5-Å spacing. The contour shown corresponds to −5 kcal/mol level. CMIP distributions obtained for idealized conformations built by using sequence-dependent average base pair step parameters from the X-ray ensemble are shown as reference. SEQ1: top left, SEQ2: top right, SEQ3: bottom left, SEQ4: bottom right.
In summary, MD trajectories performed using either parmbsc0 or CHARMM27 force field yield to a reasonable representation of the expected solution geometry of B-DNA duplexes. The subtle differences found favour in some cases CHARMM27 (average twist and slide closer to current available experimental data) and in others to parmbsc0 (roll and groove asymmetry), but in any case we must emphasize that the differences between force fields are rather small, and taking all the results together, we should conclude that both force fields are giving general duplex geometries of enough quality for most modelling studies.
Sequence-dependent structural properties
We computed helical coordinates for all the 10 unique steps in the four sequences in both parmbsc0 and CHARMM27 trajectories. Results (Table 2) show a generally good agreement in the sequence trends for the different helical coordinates. This is especially remarkable for the two helical parameters, which on average display the largest divergence between force fields: roll and twist (Figure 5). Also worth noting is the general agreement between force-field estimates and experimental trends (Table 2 and Figure 5), which reinforces our confidence in simulations with current force fields. Not surprisingly, the most significant differences between parmbsc0, CHARMM27 and experimental values are found for d(CA) and d(TA), the pyrimidine–purine steps known for their exceptional flexibility.
Figure 5.

Average helical parameters for the 10 unique base pair steps. Translational parameters are in angstroms, while the rotational ones are in degrees.
Backbone geometry and flexibility
A reasonable helical structure does not always guarantee correct backbone geometry. Thus, we analysed in detail the three major elements of flexibility in the duplex: (i) sugar puckering, (ii) rotations around ζ/ε torsions and (iii) rotations around α/γ torsions. Both force fields suggest the South and South-East (puckering annotation was done by dividing the pseudo-rotational circle in four equivalent sections; North: [(315:45°], East: [45:135°], South: [135:225°], West: [225:315°] conformations as those dominating sugar conformational space (Figure 6), in agreement with all available experimental data (82). CHARMM27 and parmbsc0 distributions of the phase or the δ angles show maxima at identical positions, and the only difference is that CHARMM27 distributions are slightly narrower and that temporary visits to the North-puckering region are even less common in CHARMM27 than in parmbsc0 simulations. The concerted rotation around ζ/ε torsions generates two major conformers: BI and BII (83), which are experimentally known to co-exist in a ratio around 80(BI):20(BII) in B-DNA (84) [for definition of these two substates see Hartmann et al. (83)]. As seen in Figure 7 both force fields detect the existence of these two subpopulations showing quite fast and frequent BI↔BII transitions. Detailed comparison of population plots demonstrates that again CHARMM27 is more rigid and leads on average to a smaller population of BII conformer [around 90(BI):10(BII)] than parmbsc0 [85(BI):15(BII)]. Finally, the third degree of flexibility for DNA backbone originates from concerted α/γ rotations, which generate non-canonical local conformations leading to a reduced twist and which are important in the formation of several protein–DNA complexes (85). Our parmbsc0 calculations suggest that non-canonical α/γ conformers represent around 1.5% of the population of dinucleotide backbone conformations, in good agreement with experimental measurements (86), which means that for the central 16-mer duplex we can expect frequent (around 40%) snapshots showing at least one α/γ pair of torsions in the non-canonical region. On the contrary, CHARMM27 trajectories are quite fixed at canonical values (Figure 8) and the population of non-canonical α/γ conformers is much smaller than experimentally predicted. However, we should bear in mind that in any case non-canonical forms represent only a small fraction of the α/γ conformational space, and accordingly the impact of this CHARMM27/parmbsc0 discrepancy is expected to be moderate in the study of relaxed duplex geometry (it might be not so irrelevant in the study of protein–DNA complexes).
Figure 6.

Left: population (in percentage) of nucleotides with South puckering for the four oligonucleotides in parmbsc0 and CHARMM27 simulations. Right: histogram of the backbone torsion angle δ using 72 bins between −180 and 180°. Results corresponding to parmbsc0 simulations are drawn with lines and CHARMM27 ones with lines and points. Crystal values are shown as reference (dotted black line).
Figure 7.

Left: population (in%) of nucleotides in BI conformation for the four oligonucleotides in parmbsc0 and CHARMM27 simulations. Right: histograms of the associated epsilon (ε) and zeta (ζ) dihedrals (in degrees). Results corresponding to parmbsc0 simulations are drawn with lines and CHARMM27 ones with lines and points. Crystal values are shown as reference (dotted black line). Histograms were made using 72 bins between −180 and 180°.
Figure 8.

Left: population (in percentage) of nucleotides in canonical α/γ conformations (g−/g+) for the four oligonucleotides in parmbsc0 and CHARMM27 simulations. Right: histograms of the associated alpha (α) and gamma (γ) dihedrals (in degrees). Results corresponding to parmbsc0 simulations are drawn with lines and CHARMM27 ones with lines and points. Crystal values are shown as reference (dotted black line). Histograms were made using 72 bins between −180 and 180°.
In summary, distributions of backbone torsions obtained in CHARMM27 and parmbsc0 simulations are quite similar, except for a general tendency of the CHARMM27 force field to stick more firmly to regions around canonical values, removing or making less prevalent non-canonical transitions of potential biological impact. However, we can affirm again that for most studies, both force fields provide a close enough picture of the backbone conformational space and that such a picture is of a quality close to what can be experimentally derived.
Global and sequence-dependent deformability
The global flexibility of DNA is dominated by untwisting and bending movements which are present in the first essential deformation modes of DNA (see deformation movies at: http://mmb.pcb.ub.es/~raist/CONSENSUS). Comparison of frequencies assigned to the first modes of the four sequences show that sequence-induced and force –field-induced variability are not much different (Figure 9) and that in general, for a given sequence the frequencies assigned to the first modes are slightly lower in parmbsc0 than in CHARMM27 calculations. As expected from the frequency profile, the average of polymer entropies computed with parmbsc0 are slightly larger (5%) than those obtained from CHARMM27 samplings (Table 3), but the difference is not much larger than that introduced by the sequence and probably in the range of the noise introduced by the limited length of current trajectories (60). Thus, we can conclude that while parmbsc0 is more flexible in terms of lower frequency movements, the overall conformational space visited in CHARMM27 simulations is not dramatically smaller than that explored in parmbsc0 calculations.
Figure 9.

Frequency (in cm−1) of the first 35 collective modes for the four sequences considered here. Results corresponding to parmbsc0 simulations are drawn with lines and CHARMM27 ones with lines and points. For extension of the graph to higher modes see Figure S1.
Table 3.
Entropies (in kcal/mol) for 100-ns simulation time for ‘all atoms’ and ‘backbone’ of the four sequences considered here (central 16mer)
| All atom | Backbone | |||
|---|---|---|---|---|
| PARMBSC0 | CHARMM27 | PARMBSC0 | CHARMM27 | |
| SEQ1 | 3.74 | 3.60 | 2.33 | 2.17 |
| SEQ2 | 3.65 | 3.63a | 2.26 | 2.21a |
| SEQ3 | 4.07 | 3.55 | 2.27 | 2.18 |
| SEQ4 | 3.61 | 3.44 | 2.31 | 2.15 |
aBase pair flipping occurs in the first base pair of the central 16-mer (T·A) in CHARMM27 calculations (A flips out while T remains stacked, this is induced by the terminal G·C being frayed). Take this value with caution.
Once the relative stiffness of the softer deformation modes in CHARMM27 and parmbsc0 is determined, we need to verify whether or not the type of essential deformations sampled spontaneously by the two force fields is similar. For this purpose, we computed relative similarity indexes and the associated Z-scores considering both ‘all atoms’ and ‘backbone-only’ representations. Tables 4 and 5 show high similarity indexes (around 0.7), with very large associated Z-scores, which emphasizes the statistical confidence in the similarity between both sets of trajectories. More interestingly, if only backbone atoms are considered, similarity indexes rise to 0.8 and become of the same order than those obtained when trajectories for different sequences obtained with the same force field are compared. In summary, we can conclude that despite differences in the stiffness of the first modes, the general deformation pattern of B-DNA is described quite similarly by both force fields, being dominated by global bending and untwisting movements (77).
Table 4.
Relative similarity indexes [δ; see Equation (6)] between parmbsc0 and CHARMM27 trajectories considering all atoms
| Sequence | δ (all) | Z-score |
|---|---|---|
| Seq1 | 0.76 | 609 |
| Seq2 | 0.81 | 435 |
| Seq3 | 0.63 | 226 |
| Seq4 | 0.70 | 128 |
| Average | 0.72 | 350 |
Table 5.
Relative similarity indexes [δ; see Equation (6)] between δ indexes obtained by comparing different sequences (only backbone)
| Seq1 | Seq2 | Seq3 | Seq4 | |
|---|---|---|---|---|
| Seq1 | 1 | 0.819 | 0.792 | 0.821 |
| 1 | 0.807 | 0.891 | 0.838 | |
| 0.791 | 0.782 | 0.782 | 0.791 | |
| Seq2 | 1 | 0.844 | 0.77 | |
| 1 | 0.839 | 0.826 | ||
| 0.793 | 0.806 | 0.801 | ||
| Seq3 | 1 | 0.783 | ||
| 1 | 0.852 | |||
| 0.829 | 0.799 | |||
| Seq4 | 1 | |||
| 1 | ||||
| 0.802 |
Values in roman: AMBER/AMBER; bold: CHARMM/CHARMM and italics: CHARMM/AMBER comparisons.
Stiffness analysis at the base pair step level allowed us to obtain sequence-dependent helical stiffness parameters (see Methods section) which can then be used for mesoscopic simulations of very long pieces of B-DNA (87) or to estimate the indirect readout component of protein–DNA interactions (57,58). Results in Table 6 illustrate the deformation parameters obtained by averaging individual estimates for base pair steps of the same sequence in the different oligomers. Quite interestingly, despite CHARMM27 force constants being in general higher than those obtained by parmbsc0 (illustrating the stiffer nature of backbone torsional profiles), the average difference is only 15%, and for many helical parameters CHARMM27 and parmbsc0 quite close to each other. In relative terms, the two force fields suggest the following decreasing order of stiffness for translational movements: rise>>slide>shift. The values which Olson and co-workers (39) derived from crystal structures of protein-bound DNAs exhibit rise stiffness much greater than that of slide and shift, but no clear ordering between shift and slide. The rigidity ordering of rotational distortions is less clearly defined, since parmbsc0 predicts the stiffness order: tilt ≥twist ≥roll, CHARMM27 found no simple relationship between tilt and twist but yields tilt ≥ roll, twist ≥ roll. Olson's data did not establish a clear ordering between twist and roll, but suggest: tilt ≥ twist, tilt ≥ roll, which seems to be more consistent with parmbsc0 ordering (Table 6).
Table 6.
Sequence-dependent dinucleotide force constants associated with the deformation of a single helical degree of freedom, computed from parmbsc0 and CHARMM27 simulations
| parmbsc0 | Twist | Tilt | Roll | Shift | Slide | Rise |
|---|---|---|---|---|---|---|
| AA | 0.028 | 0.037 | 0.020 | 1.72 | 2.13 | 7.64 |
| AC | 0.036 | 0.038 | 0.023 | 1.28 | 2.98 | 8.83 |
| AG | 0.028 | 0.037 | 0.019 | 1.40 | 1.78 | 7.04 |
| AT | 0.031 | 0.035 | 0.022 | 1.05 | 3.77 | 9.34 |
| CA | 0.015 | 0.025 | 0.016 | 1.05 | 1.80 | 6.30 |
| CC | 0.026 | 0.042 | 0.020 | 1.43 | 1.57 | 7.86 |
| CG | 0.014 | 0.026 | 0.016 | 1.05 | 1.91 | 6.11 |
| GA | 0.024 | 0.038 | 0.020 | 1.32 | 1.88 | 8.48 |
| GC | 0.022 | 0.036 | 0.026 | 1.18 | 2.59 | 9.47 |
| TA | 0.018 | 0.019 | 0.015 | 0.64 | 1.25 | 6.08 |
| CHARMM27 | ||||||
| AA | 0.043 | 0.044 | 0.022 | 2.45 | 3.56 | 9.47 |
| AC | 0.034 | 0.034 | 0.025 | 1.55 | 3.33 | 8.31 |
| AG | 0.036 | 0.045 | 0.022 | 2.00 | 2.82 | 9.35 |
| AT | 0.032 | 0.032 | 0.023 | 1.21 | 3.49 | 7.32 |
| CA | 0.032 | 0.027 | 0.018 | 1.60 | 2.19 | 6.71 |
| CC | 0.030 | 0.043 | 0.021 | 1.53 | 1.74 | 8.96 |
| CG | 0.032 | 0.024 | 0.017 | 1.82 | 2.48 | 6.64 |
| GA | 0.040 | 0.041 | 0.024 | 2.27 | 3.40 | 10.12 |
| GC | 0.027 | 0.031 | 0.028 | 1.70 | 4.79 | 9.43 |
| TA | 0.036 | 0.021 | 0.015 | 0.93 | 1.52 | 6.61 |
Values for a particular base pair step are diagonal entries of its stiffness matrix [see Equation (5)]. Values reported in the table are averages over all the steps of the same dinucleotide sequence. The rotational values are in kcal/mol deg2 and translational ones are in kcal/mol Å2.
Analysis of helical stiffness parameters for each unique base pair step confirms the very remarkable similarity between parmbsc0 and CHARMM27 estimates of the sequence-dependent stiffness of B-DNA (Table 6 and Figure 10) in aqueous solution and the quite unexpected similarity with Olson's estimates, which were obtained from the analysis of a reduced set (which warns against the statistical quality in estimates of some steps) of protein-induced distortions in crystals (which grew and were diffracted at typically low or very low temperatures). Analysis of MD simulation data suggests a quite significant dependence of stiffness on sequence, which again highlights the intrinsic shortcomings of sequence-independent macroscopic models of DNA flexibility. In general, our simulations strongly suggest that some steps like CG, CA and TA appear as ideal ‘hinge’ points for global DNA bending and twisting, while AT and GC are on the contrary quite stiff points for these deformations. However, caution is needed in using these general concepts of ‘rigidity’ or ‘flexibility’ since different base pair steps show different stiffness against different helical deformations and one step which might be very difficult to unwind by twist deformation might be on the contrary easily deformed by modifying the slide of shift. Again, we should note that the concept of ‘flexibility’ should be linked to an exact definition of the deformation explored.
Figure 10.

Sequence-dependent force constants for helical deformation (translational ones in kcal/mol Å2, rotational ones in kcal/mol degree2) for the different unique steps obtained by averaging individual data for the four sequences in parmbsc0 and CHARMM27 simulations (data from Table). Olson's values are shown for comparison.
Local nucleobase dynamics
While DNA flexibility mostly manifests itself in movements involving base pairs as basic units, the individual flexibility of nucleobases is required for some biological processes like DNA methylation or repair (26,27,88,89). Accordingly, we complement our analysis of DNA geometry by inspecting the pattern of hydrogen bonding between nucleobases. Fraying effects leading to the break of one or both terminal pairs are found in most of the simulations, even when the terminal pairs are G-C, but the pattern of canonical hydrogen bonds (defined as the distance between the heteroatoms involved being <3.5 Å) in the central portion or the duplexes is quite well preserved (see Figure 11). Thus, the three H-bonds of each G-C pair are conserved during 93% (parmbsc0) or 74% (CHARMM27) of the time, while the two H-bonds of the A-T pairs are slightly less conserved [74% (parmbsc0) and 67% (CHARMM27)]. The significant higher fragility of G-C hydrogen bonds in CHARM27 compared to parmbsc0 can be understood by analysing the hydrogen bond energy in d(G-C) steps in MD-averaged structures [−23.5 kcal/mol for CHARMM27, −27.4 kcal/mol for parmbsc0; CCSD(T)/CBS estimate −28.8 kcal/mol from reference 90]. On average, we found a reversible loss of one of the Watson–Crick hydrogen bonds every 80 (parmbsc0) and 70 (CHARMM27) ps for A-T and every 170 (parmbsc0) and 55 (CHARMM27) ps for G-C. Most disruptions of the ideal pattern of hydrogen bonding is due to fast opening (<10 ps), which do not yield stable opened forms and which do not perturb the general structure of the duplex yielding to co-operative openings. A few long (>1 ns) opening events are found throughout the trajectories (sequence 1 for both parmbsc0 and CHARMM27 and sequence 2 for CHARMM27); in all cases they correspond to A-T pairs contiguous to terminal base pairs which are disrupted during the simulation. In one case (for SEQ2), CHARMM27 yields a base flipping which is not reversible in the simulation time considered here. This flipping movement is expected to occur in the millisecond time scale and accordingly can be considered an artefact of the simulation, probably originated in the perturbing effect of the fully disrupted terminal base pair and without much impact on the global dynamics of the duplex.
Figure 11.

Number of conserved canonical Watson and Crick hydrogen bonds (end pairs were excluded from this analysis) for the four sequences (TOP to BOTTOM: SEQ1 to SEQ4) in parmbsc0 and CHARMM27. Red: total number of hydrogen bonds. Blue: A-T hydrogen bonds. Green: C-G hydrogen bonds.
In summary, both force fields preserve reasonably well the pattern of canonical hydrogen bonding in the central portion of the duplex. Hydrogen bonds detected by parmbsc0 seem to be stronger than those detected by CHARMM27, the difference being especially noticeable for the G-C pairs. Temporary reversible loss of hydrogen bonding is common and fast according to both force fields, but no base flipping transitions are detected except for one CHARMM27 simulation, where the disrupted pair is contiguous to a terminal base pair.
Comparison with previous AMBER force fields
Most MD simulations in the literature have been performed with older AMBER force fields, in particular with parm94 [including an extensive recent study (37,38)], and parm99 (53,64). Unfortunately, as noted elsewhere (64), both force fields lead to severely distorted geometries in the >10-ns range, which implies that their use should be avoided in studies such as the present one. However, for the sake of completeness we analysed the behaviour of parm94/99 force fields in the ideal limit of no α/γ transitions (see Methods section). The removal of α/γ transitions produces parm99* trajectories with average helical properties similar to parmbsc0 and not two different groove geometries; on the contrary, parm94* calculations lead to slide and twist distributions which are farther from experimental values, yielding wider than expected grooves and an overestimation of groove asymmetry (see Supplementary Table 1 and Figures S1 and S2). Backbones show reduced flexibility compared to parmbsc0 in terms of puckering (parm99*, see Figure S3) and BI/BII equilibrium (parm94*, see Figure S4). Interestingly, very similar stiffness parameters are in general found for parmbsc0 and parm99*, while parm94* mostly predicts the twist stiffness greater than that of tilt (53), in qualitative disagreement with parmbsc0 and Olson's estimates (see Supplementary Table 2 and Figure S5). The ordering of stiffness for translational deformations, rise>>slide>shift, is uniformly followed by parmbsc0, charmm27, parm94*, parm99* and older simulation data (53), but only partially by Olson's values. Finally, we emphasize the similarity in sequence-dependent stiffness profiles between parmbsc0 and the two other corrected AMBER force fields. In summary, our results here suggest that in the absence of α/γ transitions (either fortuitous, due to the limited length of simulation, or to the use of a posteriori correction) old AMBER force fields, if corrected for α/γ transitions provide also a reasonable representation of B-DNA structure and dynamics, supporting then the quality of a large number of previous published works (see above).
Present model is based on the dinucleotide model which assumes that elastic properties can be modelled considering only near neighbours, neglecting then environment-effects. This can be a source or potential uncertainties, since elastic properties of a dinucleotide step d(XY) might depend on the nature of the flanking sequences d(A … ZXYA′ … Z′). In order to have a rough estimate of the level of error implicit to our averaged stiffness parameters we explored the dispersion of stiffness parameters for step d(XY) depending on the nature of the flanking bases A and B in the tetramers (37,38) d(AXYB) sampled during trajectories. Results displayed in Supplementary Table S3 demonstrate that in general the impact of neighbouring steps is not dramatic as standard deviations (associated to variation of flanking bases) account typically for <10% the value of the stiffness parameter. Twist and slide seem to be the helical coordinates whose stiffness parameters are more dependent on neighbouring effects, which seem to affect not equally to all steps [for example stiffness of d(CC) steps seems to be particularly dependent on flanking bases]. Table S3 suggests that in general CHARMM27 has a slightly lower neighbour dependence than parmbsc0, but in any case values are quite close (see Supplementary Table S3), confirming again the remarkable robustness of MD simulations to changes in the force field.
FINAL REMARKS
The field of MD simulations of nucleic acids is reaching its maturity and microsecond-long simulations are becoming possible, which allows us to obtain a more complete dynamic picture of DNA flexibility. The area has been dominated by two families of force fields, AMBER and CHARMM. Comparison studies (typically based on very short trajectories) are scarce and often overemphasize small differential points which can favour one force field over the other. However, in this paper, based on very long trajectories on a significant number of long duplexes, we found that there is much more agreements than differences between the structural and dynamical view of B-DNA provided by both force fields. We demonstrate that it is possible to arrive at a high-quality consensus picture of the basic structural dynamics characteristics of B-DNA, drawing an atlas which can help experimentalists in areas such as molecular biophysics, molecular biology and bio-nanotechnology.
SUPPLEMENTARY DATA
Supplementary Data are available at NAR Online.
ACKNOWLEDGEMENTS
Calculations were performed on the MareNostrum supercomputer at the Barcelona Supercomputer Center, and on EPFL clusters. The authors thank Leesa Heffler for help with the parm94*/99* simulations. This work has been supported by the Spanish Ministry of Education and Science (BIO2006-01602 and Consolider supercomputation for E-Science), the National Institute of Bioinformatics (Structural Bioinformatics Node) and the Fundación Marcelino Botín. Further support came from the Swiss National Science Foundation (project no. 205320-103833/1). Funding to pay the Open Access publication charges for this article was provided by the University of Barcelona.
Conflict of interest statement. None declared.
REFERENCES
- 1.Bajic VB, Seah SH. Dragon Gene Start Finder: an advanced system for finding approximate locations of the start of gene transcriptional units. Genome Res. 2003;13:1923–1929. doi: 10.1101/gr.869803. [DOI] [PMC free article] [PubMed] [Google Scholar]
- 2.Down TA, Hubbard TJP. Computational detection and location of transcription start sites in mammalian genomic DNA. Genome Res. 2002;12:458–461. doi: 10.1101/gr.216102. [DOI] [PMC free article] [PubMed] [Google Scholar]
- 3.Gross SS, Brent MR. Using multiple alignments to improve gene prediction. J. Comput. Biol. 2006;13:379–393. doi: 10.1089/cmb.2006.13.379. [DOI] [PubMed] [Google Scholar]
- 4.Knudsen S. Promoter2.0: for the recognition of PolII promoter sequences. Bioinformatics. 1999;15:356–361. doi: 10.1093/bioinformatics/15.5.356. [DOI] [PubMed] [Google Scholar]
- 5.Ponger L, Mouchiroud D. CpGProD: identifying CpG islands associated with transcription start sites in large genomic mammalian sequences. Bioinformatics. 2002;18:631–633. doi: 10.1093/bioinformatics/18.4.631. [DOI] [PubMed] [Google Scholar]
- 6.Solovyev VV, Shahmuradov IA. PromH: promoters identification using orthologous genomic sequences. Nucleic Acids Res. 2003;31:3540–3545. doi: 10.1093/nar/gkg525. [DOI] [PMC free article] [PubMed] [Google Scholar]
- 7.Korf I, Flicek P, Duan D, Brent MR. Integrating genomic homology into gene structure prediction. Bioinformatics. 2001;17(Suppl 1):S140–S148. doi: 10.1093/bioinformatics/17.suppl_1.s140. [DOI] [PubMed] [Google Scholar]
- 8.Brown RH, Gross SS, Brent MR. Begin at the beginning: predicting genes with 5' UTRs. Genome Res. 2005;15:742–747. doi: 10.1101/gr.3696205. [DOI] [PMC free article] [PubMed] [Google Scholar]
- 9.Feder ME, Mitchell-Olds T. Evolutionary and ecological functional genomics. Nat. Rev. Genet. 2003;4:651–657. doi: 10.1038/nrg1128. [DOI] [PubMed] [Google Scholar]
- 10.Pedersen AG, Jensen LJ, Brunak S, Staerfeldt HH, Ussery DW. A DNA structural atlas for Escherichia coli. J. Mol. Biol. 2000;299:907–930. doi: 10.1006/jmbi.2000.3787. [DOI] [PubMed] [Google Scholar]
- 11.Ponomarenko JV, Ponomarenko MP, Frolov AS, Vorobyev DG, Overton GC, Kolchanov NA. Conformational and physicochemical DNA features specific for transcription factor binding sites. Bioinformatics. 1999;15:654–668. doi: 10.1093/bioinformatics/15.7.654. [DOI] [PubMed] [Google Scholar]
- 12.Pedersen AG, Baldi P, Chauvin Y, Brunak S. The biology of eukaryotic promoter prediction - a review. Comput. Chem. 1999;23:191–207. doi: 10.1016/s0097-8485(99)00015-7. [DOI] [PubMed] [Google Scholar]
- 13.Pedersen AG, Baldi P, Chauvin Y, Brunak S. DNA structure in human RNA polymerase II promoters. J. Mol. Biol. 1998;281:663–673. doi: 10.1006/jmbi.1998.1972. [DOI] [PubMed] [Google Scholar]
- 14.Ohler U, Niemann H, Liao G, Rubin GM. Joint modeling of DNA sequence and physical properties to improve eukaryotic promoter recognition. Bioinformatics. 2001;17(Suppl 1):S199–S206. doi: 10.1093/bioinformatics/17.suppl_1.s199. [DOI] [PubMed] [Google Scholar]
- 15.Kanhere A, Bansal M. Structural properties of promoters: similarities and differences between prokaryotes and eukaryotes. Nucleic Acids Res. 2005;33:3165–3175. doi: 10.1093/nar/gki627. [DOI] [PMC free article] [PubMed] [Google Scholar]
- 16.Florquin K, Saeys Y, Degroeve S, Rouze P, Van de Peer Y. Large-scale structural analysis of the core promoter in mammalian and plant genomes. Nucleic Acids Res. 2005;33:4255–4264. doi: 10.1093/nar/gki737. [DOI] [PMC free article] [PubMed] [Google Scholar]
- 17.Goni JR, de la Cruz X, Orozco M. Triplex-forming oligonucleotide target sequences in the human genome. Nucleic Acids Res. 2004;32:354–360. doi: 10.1093/nar/gkh188. [DOI] [PMC free article] [PubMed] [Google Scholar]
- 18.Goni JR, Perez A, Torrents D, Orozco M. Determining promoter location based on first-principles calculations. Genome Biol. 2007;8:R263. doi: 10.1186/gb-2007-8-12-r263. [DOI] [PMC free article] [PubMed] [Google Scholar]
- 19.Goni JR, Vaquerizas JM, Dopazo J, Orozco M. Exploring the reasons for the large density of triplex-forming oligonucleotide target sequences in the human regulatory regions. BMC Genomics. 2006;7:1–10. doi: 10.1186/1471-2164-7-63. [DOI] [PMC free article] [PubMed] [Google Scholar]
- 20.Dempsey LA, Sun H, Hanakahi LA, Maizels N. G4 DNA binding by LR1 and its subunits, nucleolin and hnRNP D, a role for G-G pairing in immunoglobulin switch recombination. J. Biol. Chem. 1999;274:1066–1071. doi: 10.1074/jbc.274.2.1066. [DOI] [PubMed] [Google Scholar]
- 21.Wasserman SA, Cozzarelli NR. Biochemical topology - applications to DNA recombination and replication. Science. 1986;232:951–960. doi: 10.1126/science.3010458. [DOI] [PubMed] [Google Scholar]
- 22.Oleksi A, Blanco AG, Boer R, Uson I, Aymami J, Rodger A, Hannon MJ, Coll M. Molecular recognition of a three-way DNA junction by a metallosupramolecular helicate. Angew. Chem. Int. Ed. 2006;45:1227–1231. doi: 10.1002/anie.200503822. [DOI] [PubMed] [Google Scholar]
- 23.Lilley DMJ. The inverted repeat as a recognizable structural feature in supercoiled DNA-molecules. Proc. Natl Acad. Sci. USA Biol. Sci. 1980;77:6468–6472. doi: 10.1073/pnas.77.11.6468. [DOI] [PMC free article] [PubMed] [Google Scholar]
- 24.Lilley DMJ, Gough GW, Hallam LR, Sullivan KM. The physical-chemistry of cruciform structures in aupercoiled DNA-molecules. Biochimie. 1985;67:697–706. doi: 10.1016/s0300-9084(85)80157-7. [DOI] [PubMed] [Google Scholar]
- 25.Peter BJ, Ullsperger C, Hiasa H, Marians KJ, Cozzarelli NR. The structure of supercoiled intermediates in DNA replication. Cell. 1998;94:819–827. doi: 10.1016/s0092-8674(00)81740-7. [DOI] [PubMed] [Google Scholar]
- 26.Sancar A. DNA excision repair. Annu. Rev. Biochem. 1996;65:43–81. doi: 10.1146/annurev.bi.65.070196.000355. [DOI] [PubMed] [Google Scholar]
- 27.Vanhouten B. Nucleotide excision repair in Escherichia-coli. Microbiol. Rev. 1990;54:18–51. doi: 10.1128/mr.54.1.18-51.1990. [DOI] [PMC free article] [PubMed] [Google Scholar]
- 28.Birney E, Stamatoyannopoulos JA, Dutta A, Guigo R, Gingeras TR, Margulies EH, Weng ZP, Snyder M, Dermitzakis ET, Stamatoyannopoulos JA, et al. Identification and analysis of functional elements in 1% of the human genome by the ENCODE pilot project. Nature. 2007;447:799–816. doi: 10.1038/nature05874. [DOI] [PMC free article] [PubMed] [Google Scholar]
- 29.Feingold EA, Good PJ, Guyer MS, Kamholz S, Liefer L, Wetterstrand K, Collins FS, Gingeras TR, Kampa D, Sekinger EA, et al. The ENCODE (ENCyclopedia of DNA elements) Project. Science. 2004;306:636–640. doi: 10.1126/science.1105136. [DOI] [PubMed] [Google Scholar]
- 30.Perez A, Noy A, Lankas F, Luque FJ, Orozco M. The relative flexibility of B-DNA and A-RNA duplexes: database analysis. Nucleic Acids Res. 2004;32:6144–6151. doi: 10.1093/nar/gkh954. [DOI] [PMC free article] [PubMed] [Google Scholar]
- 31.Watson JD, Crick FHC. Molecular structure of nucleic acids – a structure for deoxyribose nucleic acid. Nature. 1953;171:737–738. doi: 10.1038/171737a0. [DOI] [PubMed] [Google Scholar]
- 32.Prevost C, Louisemay S, Ravishanker G, Lavery R, Beveridge DL. Persistence analysis of the static and dynamic helix deformations of DNA oligonucleotides - application to the crystal-structure and molecular-dynamics simulation of D(Cgcgaattcgcg)2. Biopolymers. 1993;33:335–350. doi: 10.1002/bip.360330303. [DOI] [PubMed] [Google Scholar]
- 33.Zhurkin VB, Ulyanov NB, Gorin AA, Jernigan RL. Static and statistical bending of DNA evaluated by Monte-Carlo simulations. Proc. Natl Acad. Sci. USA. 1991;88:7046–7050. doi: 10.1073/pnas.88.16.7046. [DOI] [PMC free article] [PubMed] [Google Scholar]
- 34.Beveridge DL, McConnell KJ. Nucleic acids: theory and computer simulation, Y2K. Curr. Opin. Struct. Biol. 2000;10:182–196. doi: 10.1016/s0959-440x(00)00076-2. [DOI] [PubMed] [Google Scholar]
- 35.Cheatham TE, III, Kollman PA. Molecular dynamics simulation of nucleic acids. Annu. Rev. Phys. Chem. 2000;51:435–471. doi: 10.1146/annurev.physchem.51.1.435. [DOI] [PubMed] [Google Scholar]
- 36.Orozco M, Perez A, Noy A, Luque FJ. Theoretical methods for the simulation of nucleic acids. Chem. Soc. Rev. 2003;32:350–364. doi: 10.1039/b207226m. [DOI] [PubMed] [Google Scholar]
- 37.Beveridge DL, Barreiro G, Byun KS, Case DA, Cheatham TE, Dixit SB, Giudice E, Lankas F, Lavery R, Maddocks JH, et al. Molecular dynamics simulations of the 136 unique tetranucleotide sequences of DNA oligonucleotides. I. Research design and results on d(C(p)G) steps. Biophys. J. 2004;87:3799–3813. doi: 10.1529/biophysj.104.045252. [DOI] [PMC free article] [PubMed] [Google Scholar]
- 38.Dixit SB, Beveridge DL, Case DA, Cheatham TE, Giudice E, Lankas F, Lavery R, Maddocks JH, Osman R, Sklenar H, et al. Molecular dynamics simulations of the 136 unique tetranucleotide sequences of DNA oligonucleotides. II: Sequence context effects on the dynamical structures of the 10 unique dinucleotide steps. Biophys. J. 2005;89:3721–3740. doi: 10.1529/biophysj.105.067397. [DOI] [PMC free article] [PubMed] [Google Scholar]
- 39.Olson WK, Gorin AA, Lu XJ, Hock LM, Zhurkin VB. DNA sequence-dependent deformability deduced from protein-DNA crystal complexes. Proc. Natl Acad. Sci. USA. 1998;95:11163–11168. doi: 10.1073/pnas.95.19.11163. [DOI] [PMC free article] [PubMed] [Google Scholar]
- 40.Hagerman PJ. Straightening out the bends in curved DNA. Biochim. Biophys. Acta. 1992;1131:125–132. doi: 10.1016/0167-4781(92)90066-9. [DOI] [PubMed] [Google Scholar]
- 41.Crothers DM, Drak J, Kahn JD, Levene SD. DNA bending, flexibility, and helical repeat by Cyclization Kinetics. Methods Enzymol. 1992;212:3–29. doi: 10.1016/0076-6879(92)12003-9. [DOI] [PubMed] [Google Scholar]
- 42.Levitt M. Computer simulation of DNA double-helix dynamics. Cold Spring Harb. Symp. Quant. Biol. 1983;47(Pt 1):251–262. doi: 10.1101/sqb.1983.047.01.030. [DOI] [PubMed] [Google Scholar]
- 43.Cheatham TE, Miller JL, Fox T, Darden TA, Kollman PA. Molecular-dynamics simulations on solvated biomolecular systems - the particle mesh Ewald method leads to stable trajectories of DNA, RNA, and proteins. J. Am. Chem. Soc. 1995;117:4193–4194. [Google Scholar]
- 44.Darden T, York D, Pedersen L. Particle mesh Ewald - an N.Log(N) method for Ewald sums in large systems. J. Chem. Phys. 1993;98:10089–10092. [Google Scholar]
- 45.Cornell WD, Cieplak P, Bayly CI, Gould IR, Merz KM, Ferguson DM, Spellmeyer DC, Fox T, Caldwell JW, Kollman PA. A 2Nd generation force-field for the simulation of proteins, nucleic-acids, and organic-molecules. J. Am. Chem. Soc. 1995;117:5179–5197. [Google Scholar]
- 46.Cheatham TE, Young MA. Molecular dynamics simulation of nucleic acids: successes, limitations, and promise. Biopolymers. 2000;56:232–256. doi: 10.1002/1097-0282(2000)56:4<232::AID-BIP10037>3.0.CO;2-H. [DOI] [PubMed] [Google Scholar]
- 47.Cheatham TE. Simulation and modeling of nucleic acid structure, dynamics and interactions. Curr. Opin. Struct. Biol. 2004;14:360–367. doi: 10.1016/j.sbi.2004.05.001. [DOI] [PubMed] [Google Scholar]
- 48.Giudice E, Lavery R. Simulations of nucleic acids and their complexes. Acc. Chem. Res. 2002;35:350–357. doi: 10.1021/ar010023y. [DOI] [PubMed] [Google Scholar]
- 49.Sponer J, Lankas F, editors. Computational Studies of RNA and DNA. Dordrecht: Springer; 2006. [Google Scholar]
- 50.Fadrna E, Spackova N, Stefl R, Koca J, Cheatham TE, Sponer J. Molecular dynamics simulations of guanine quadruplex loops: Advances and force field limitations. Biophys. J. 2004;87:227–242. doi: 10.1529/biophysj.103.034751. [DOI] [PMC free article] [PubMed] [Google Scholar]
- 51.Lankas F, Cheatham TE, Spackova N, Hobza P, Langowski J, Sponer J. Critical effect of the N2 amino group on structure, dynamics, and elasticity of DNA polypurine tracts. Biophys. J. 2002;82:2592–2609. doi: 10.1016/s0006-3495(02)75601-4. [DOI] [PMC free article] [PubMed] [Google Scholar]
- 52.Lankas F, Sponer J, Hobza P, Langowski J. Sequence-dependent elastic properties of DNA. J. Mol. Biol. 2000;299:695–709. doi: 10.1006/jmbi.2000.3781. [DOI] [PubMed] [Google Scholar]
- 53.Lankas F, Sponer J, Langowski J, Cheatham TE. DNA basepair step deformability inferred from molecular dynamics simulations. Biophys. J. 2003;85:2872–2883. doi: 10.1016/S0006-3495(03)74710-9. [DOI] [PMC free article] [PubMed] [Google Scholar]
- 54.Gonzalez O, Maddocks JH. Extracting parameters for base-pair level models of DNA from molecular dynamics simulations. Theor. Chem. Acc. 2001;106:76–82. [Google Scholar]
- 55.Coleman BD, Olson WK, Swigon D. Theory of sequence-dependent DNA elasticity. J. Chem. Phys. 2003;118:7127–7140. [Google Scholar]
- 56.Becker NB, Everaers R. From rigid base pairs to semiflexible polymers: coarse-graining DNA. Phys. Rev. E. 2007;76 doi: 10.1103/PhysRevE.76.021923. 021923. [DOI] [PubMed] [Google Scholar]
- 57.Becker NB, Wolff L, Everaers R. Indirect readout: detection of optimized subsequences and calculation of relative binding affinities using different DNA elastic potentials. Nucleic Acids Res. 2006;34:5638–5649. doi: 10.1093/nar/gkl683. [DOI] [PMC free article] [PubMed] [Google Scholar]
- 58.Sarai A, Kono H. PROTEIN-DNA recognition patterns and predictions. Annu. Rev. Biophys. Biomol. Struct. 2005;34:379–398. doi: 10.1146/annurev.biophys.34.040204.144537. [DOI] [PubMed] [Google Scholar]
- 59.Lankas F, Lavery R, Maddocks JH. Kinking occurs during molecular dynamics simulations of small DNA minicircles. Structure. 2006;14:1527–1534. doi: 10.1016/j.str.2006.08.004. [DOI] [PubMed] [Google Scholar]
- 60.Perez A, Luque FJ, Orozco M. Dynamics of B-DNA on the microsecond time scale. J. Am. Chem. Soc. 2007;129:14739–14745. doi: 10.1021/ja0753546. [DOI] [PubMed] [Google Scholar]
- 61.Rueda M, Ferrer-Costa C, Meyer T, Perez A, Camps J, Hospital A, Gelpi JL, Orozco M. A consensus view of protein dynamics. Proc. Natl Acad. Sci. USA. 2007;104:796–801. doi: 10.1073/pnas.0605534104. [DOI] [PMC free article] [PubMed] [Google Scholar]
- 62.Foloppe N, MacKerell AD. All-atom empirical force field for nucleic acids: I. Parameter optimization based on small molecule and condensed phase macromolecular target data. J. Comput. Chem. 2000;21:86–104. [Google Scholar]
- 63.MacKerell AD, Banavali NK. All-atom empirical force field for nucleic acids: II. Application to molecular dynamics simulations of DNA and RNA in solution. J. Comput. Chem. 2000;21:105–120. [Google Scholar]
- 64.Perez A, Marchan I, Svozil D, Sponer J, Cheatham TE, III, Laughton CA, Orozco M. Refinement of the AMBER force field for nucleic acids: improving the description of alpha/gamma conformers. Biophys. J. 2007;92:3817–3829. doi: 10.1529/biophysj.106.097782. [DOI] [PMC free article] [PubMed] [Google Scholar]
- 65.Gelpi JL, Kalko SG, Barril X, Cirera J, de la Cruz X, Luque FJ, Orozco M. Classical molecular interaction potentials: Improved setup procedure in molecular dynamics simulations of proteins. Proteins Struct. Funct. Genet. 2001;45:428–437. doi: 10.1002/prot.1159. [DOI] [PubMed] [Google Scholar]
- 66.Drew HR, Wing RM, Takano T, Broka C, Tanaka S, Itakura K, Dickerson RE. Structure of a B-DNA dodecamer – conformation and dynamics.1. Proc. Natl Acad. Sci. USA Biol. Sci. 1981;78:2179–2183. doi: 10.1073/pnas.78.4.2179. [DOI] [PMC free article] [PubMed] [Google Scholar]
- 67.Shields GC, Laughton CA, Orozco M. Molecular dynamics simulation of a PNA center dot DNA center dot PNA triple helix in aqueous solution. J. Am. Chem. Soc. 1998;120:5895–5904. [Google Scholar]
- 68.Ryckaert JP, Ciccotti G, Berendsen HJC. Numerical-integration of Cartesian equations of motion of a system with constraints - molecular-dynamics of N-alkanes. J. Comput. Phys. 1977;23:327–341. [Google Scholar]
- 69.Andersen HC. Rattle – a velocity version of the shake algorithm for molecular-dynamics calculations. J. Comput. Phys. 1983;52:24–34. [Google Scholar]
- 70.Cheatham TE, Cieplak P, Kollman PA. A modified version of the Cornell et al. force field with improved sugar pucker phases and helical repeat. J. Biomol. Struct. Dyn. 1999;16:845–862. doi: 10.1080/07391102.1999.10508297. [DOI] [PubMed] [Google Scholar]
- 71.Wang JM, Cieplak P, Kollman PA. How well does a restrained electrostatic potential (RESP) model perform in calculating conformational energies of organic and biological molecules? J. Comput. Chem. 2000;21:1049–1074. [Google Scholar]
- 72.Kale L, Skeel R, Bhandarkar M, Brunner R, Gursoy A, Krawetz N, Phillips J, Shinozaki A, Varadarajan K, Schulten K. NAMD2: Greater scalability for parallel molecular dynamics. J. Comput. Phys. 1999;151:283–312. [Google Scholar]
- 73.Phillips JC, Braun R, Wang W, Gumbart J, Tajkhorshid E, Villa E, Chipot C, Skeel RD, Kale L, Schulten K. Scalable molecular dynamics with NAMD. J. Comput. Chem. 2005;26:1781–1802. doi: 10.1002/jcc.20289. [DOI] [PMC free article] [PubMed] [Google Scholar]
- 74.Case DA, Cheatham TE, Darden T, Gohlke H, Luo R, Merz KM, Onufriev A, Simmerling C, Wang B, Woods RJ. The Amber biomolecular simulation programs. J. Computat. Chem. 2005;26:1668–1688. doi: 10.1002/jcc.20290. [DOI] [PMC free article] [PubMed] [Google Scholar]
- 75.Amadei A, Linssen ABM, Berendsen HJC. Essential dynamics of proteins. Proteins –Struct. Funct. Genet. 1993;17:412–425. doi: 10.1002/prot.340170408. [DOI] [PubMed] [Google Scholar]
- 76.Andricioaei I, Karplus M. On the calculation of entropy from covariance matrices of the atomic fluctuations. J. Chem. Phys. 2001;115:6289–6292. [Google Scholar]
- 77.Perez A, Blas JR, Rueda M, Lopez-Bes JM, de la Cruz X, Orozco M. Exploring the essential dynamics of B-DNA. J. Chem. Theory Comput. 2005;1:790–800. doi: 10.1021/ct050051s. [DOI] [PubMed] [Google Scholar]
- 78.Rueda M, Chacon P, Orozco M. Thorough validation of protein normal mode analysis: a comparative study with essential dynamics. Structure. 2007;15:565–575. doi: 10.1016/j.str.2007.03.013. [DOI] [PubMed] [Google Scholar]
- 79.Lu XJ, Olson WK. 3DNA: a software package for the analysis, rebuilding and visualization of three-dimensional nucleic acid structures. Nucleic Acids Res. 2003;31:5108–5121. doi: 10.1093/nar/gkg680. [DOI] [PMC free article] [PubMed] [Google Scholar]
- 80.Meyer T, Ferrer-Costa C, Perez A, Rueda M, Bidon-Chanal A, Luque FJ, Laughton CA, Orozco M. Essential dynamics: a tool for efficient trajectory compression and management. J. Chem. Theory Comput. 2006;2:251–258. doi: 10.1021/ct050285b. [DOI] [PubMed] [Google Scholar]
- 81.El Hassan MA, Calladine CR. Two distinct modes of protein-induced bending in DNA. J. Mol. Biol. 1998;282:331–343. doi: 10.1006/jmbi.1998.1994. [DOI] [PubMed] [Google Scholar]
- 82.Gonzalez C, Stec W, Reynolds MA, James TL. Structure and dynamics of a DNA-center-dot-RNA hybrid duplex with a chiral phosphorothioate moiety - NMR and molecular-dynamics with conventional and time-averaged restraints. Biochemistry. 1995;34:4969–4982. doi: 10.1021/bi00015a008. [DOI] [PubMed] [Google Scholar]
- 83.Hartmann B, Piazzola D, Lavery R. B-I-B-Ii transitions in B-DNA. Nucleic Acids Res. 1993;21:561–568. doi: 10.1093/nar/21.3.561. [DOI] [PMC free article] [PubMed] [Google Scholar]
- 84.Djuranovic D, Hartmann B. DNA fine structure and dynamics in crystals and in solution: the impact of BI/BII backbone conformations. Biopolymers. 2004;73:356–368. doi: 10.1002/bip.10528. [DOI] [PubMed] [Google Scholar]
- 85.Varnai P, Zakrzewska K. DNA and its counterions: a molecular dynamics study. Nucleic Acids Res. 2004;32:4269–4280. doi: 10.1093/nar/gkh765. [DOI] [PMC free article] [PubMed] [Google Scholar]
- 86.Varnai P, Djuranovic D, Lavery R, Hartmann B. alpha/gamma Transitions in the B-DNA backbone. Nucleic Acids Res. 2002;30:5398–5406. doi: 10.1093/nar/gkf680. [DOI] [PMC free article] [PubMed] [Google Scholar]
- 87.Olson WK, Marky NL, Jernigan RL, Zhurkin VB. Influence of fluctuations on DNA curvature – a comparison of flexible and static wedge models of intrinsically bent DNA. J. Mol. Biol. 1993;232:530–551. doi: 10.1006/jmbi.1993.1409. [DOI] [PubMed] [Google Scholar]
- 88.Gomez-Pinto I, Cubero E, Kalko SG, Monaco V, van der Marel G, van Boom JH, Orozco M, Gonzalez C. Effect of bulky lesions on DNA - solution structure of a DNA duplex containing a cholesterol adduct. J. Biol. Chem. 2004;279:24552–24560. doi: 10.1074/jbc.M311751200. [DOI] [PubMed] [Google Scholar]
- 89.Wang PY, Brank AS, Banavali NK, Nicklaus MC, Marquez VE, Christman JK, MacKerell AD. Use of oligodeoxyribonucleotides with conformationally constrained abasic sugar targets to probe the mechanism of base flipping by HhaI DNA (cytosine C5)-methyltransferase. J. Am. Chem. Soc. 2000;122:12422–12434. [Google Scholar]
- 90.Sponer J, Jurecka P, Hobza P. Accurate interaction energies of hydrogen-bonded nucleic acid base pairs. J. Am. Chem. Soc. 2004;126:10142–10151. doi: 10.1021/ja048436s. [DOI] [PubMed] [Google Scholar]