Abstract
A novel method is presented for joint prediction of alignment and common secondary structures of two RNA sequences. The joint consideration of common secondary structures and alignment is accomplished by structural alignment over a search space defined by the newly introduced motif called matched helical regions. The matched helical region formulation generalizes previously employed constraints for structural alignment and thereby better accommodates the structural variability within RNA families. A probabilistic model based on pseudo free energies obtained from precomputed base pairing and alignment probabilities is utilized for scoring structural alignments. Maximum a posteriori (MAP) common secondary structures, sequence alignment and joint posterior probabilities of base pairing are obtained from the model via a dynamic programming algorithm called PARTS. The advantage of the more general structural alignment of PARTS is seen in secondary structure predictions for the RNase P family. For this family, the PARTS MAP predictions of secondary structures and alignment perform significantly better than prior methods that utilize a more restrictive structural alignment model. For the tRNA and 5S rRNA families, the richer structural alignment model of PARTS does not offer a benefit and the method therefore performs comparably with existing alternatives. For all RNA families studied, the posterior probability estimates obtained from PARTS offer an improvement over posterior probability estimates from a single sequence prediction. When considering the base pairings predicted over a threshold value of confidence, the combination of sensitivity and positive predictive value is superior for PARTS than for the single sequence prediction. PARTS source code is available for download under the GNU public license at http://rna.urmc.rochester.edu.
INTRODUCTION
It is becoming increasingly clear that RNAs, called noncoding RNAs (ncRNAs), expressly serve a large number of direct functions in cellular biology in addition to the roles of conventional messenger RNAs and tRNAs that act in protein synthesis (1,2). Knowledge of ncRNA structures can help biologists in understanding their functions. Computational methods for estimating these structures are of significant interest due to their lower cost in comparison with experimental methods and due to their potential in identifying new ncRNAs (3–5). These methods begin with the primary structure of RNA consisting of a linear chain of nucleotides identified by their bases (A, U, G and C), which is determined by sequencing. Utilizing sequence data, a number of computational methods have been proposed for the estimation of secondary structure, i.e. the set of canonical AU, GC and GU pairs in the RNA molecule that are connected by hydrogen bonds. These are commonly referred to as RNA folding algorithms and include methods that operate on a single sequence (6–11) and methods that operate on multiple homologous sequences (11–18). The comparative analysis between sequences implicit in multisequence methods provides a significant advantage making these methods more accurate than single sequence methods. One approach to this problem is to use dynamic programming to determine a structural alignment between two or more sequences, i.e. to simultaneously align and determine the common secondary structure for the sequences. Among the proposed comparative sequence analysis methods for structural alignment by dynamic programming, the currently promising methods lie in one of two main classes: (i) methods based on thermodynamic models with experimentally determined parameters (6,18–20) and (ii) methods based on probabilistic models trained using a database of known examples for which secondary structure and alignment are known (16,15,21). A number of algorithms in these two classes were recently benchmarked (13). All of these algorithms may be viewed as variants of Sankoff 's algorithm (22).
This article introduces PARTS (Probabilistic Alignment for RNA joinT Secondary structure prediction), an algorithm for the prediction of the structural alignment of two RNA sequences, which may be viewed as another variant of Sankoff 's algorithm (22). As compared with pre-existing methods in this category, PARTS is novel in two respects. First, PARTS incorporates a more general model for structural alignment that is defined in terms of a newly introduced motif called matched helical regions. The model generalizes constraints imposed in prior work for the purpose of ensuring commonality of secondary structure in a structural alignment, while still permitting a computationally tractable solution via dynamic programming. Specifically, the structural alignment model in PARTS allows paired bases in one structure to align with unpaired bases in another, an event that is frequently seen in manually curated databases but excluded in the original formulations of Sankoff (22) and in subsequently developed structural alignment methods. Second, in addition to predicting the optimal, i.e. most likely, common secondary structures of the two sequences, PARTS provides estimates of the confidence in the predictions in the form of base pairing probabilities, information which is not currently available from the frequently used methods for the prediction of common secondary structure of multiple sequences. This information is valuable because it allows biologists to identify base pairs predicted with high confidence as targets for experimental study, even though the number of such base pairs may be small. For a single RNA sequence, base pairing probabilities for an equilibrium ensemble of RNA secondary structures have been estimated using a partition function calculation (23,24) but for multiple sequences, the problem has received only limited attention (25).
The scoring scheme used by PARTS evaluates the relative probability of each structural alignment using pseudo free energy changes, which constitute a joint measure of inter-sequence alignment probability and of the thermodynamic stability of individual structures in structural alignment. The pseudo free energy change is calculated using a combination of pairing probabilities from the single sequence partition function and alignment probabilities from a pairwise hidden Markov model. Using the scoring methodology, PARTS provides a maximum a posteriori probability (MAP) estimate of secondary structures and of the alignment of the RNA sequences. In addition, PARTS calculates a partition function over the common secondary structure space, i.e. all possible common foldings, of two RNA sequences in order to infer posterior pairing probabilities of all possible base pairs in the individual sequences.
MATERIALS AND METHODS
Given two RNA sequences, in order to formulate the simultaneous prediction of the common RNA secondary structure and alignment, the idea of structural alignment is defined to describe the search space over allowed common secondary structures. The concept of matched helical regions, which formally combines commonality of secondary structures and sequence alignment, is introduced and used for that purpose. A scoring method is then introduced to score each of the structural alignments. This model, using pseudo free energy changes, combines both alignment probability and conformation stability. MAP structural alignments and joint posterior base pairing probabilities are predicted using this scoring model. Efficient calculation of MAP common secondary structures and alignment, and posterior base pairing probabilities are presented in the final part of the Materials and Methods section.
RNA structural alignment
Given two homologous RNA sequences, the commonality of the structures of RNA sequences refers to equivalence of shapes of structures, i.e. commonality does not imply an exact matching of structures. The equivalence of shapes may be determined by comparing different levels of abstraction (26) of secondary structures in order to include varying levels of common structural details. The most basic level of structural detail to be included in common secondary structures is branching configuration as defined by Sankoff (22). Branching configuration, however, is not sufficient to define commonality because structures might still be highly dissimilar while having the same branching configuration. Sequence alignment can help to partly remedy this problem. Though sequence alignment is not directly related to individual secondary structures of sequences, it constrains the common secondary structures into which the sequences can fold. Sankoff (22) incorporated sequence alignment in common secondary structure prediction by imposing alignment constraints on base pairs that are at the closing ends of homologous helices. The alignment of unpaired nucleotides in loop regions is not constrained. Manually curated alignments (27,28) indicate that these constraints are often too restrictive. A generalization of this is therefore utilized in the present work that can be described in terms of matched helical regions, which are defined next.
A contiguous segment of nucleotides in an RNA sequence is called a fragment and two fragments in a sequence are said to be nonoverlapping if they do not have any nucleotide positions in common between them. Given two RNA sequences, (pseudo-knot free) secondary structures of these RNA sequences, and a valid sequence alignment between these RNA sequences, a matched helical region is composed of two pairs of nonoverlapping sequence fragments, one pair of fragments from each sequence such that four conditions are met:
In the secondary structures, there are no base pairs between nucleotides within any single fragment.
The fragment pair from a sequence includes at least one set of paired bases in the corresponding secondary structure.
Within the fragment pairs, two nucleotides that are paired in the structure corresponding to one sequence are either both inserted or both aligned to either paired or unpaired nucleotides.
Unpaired nucleotides in fragments are aligned to paired nucleotides.
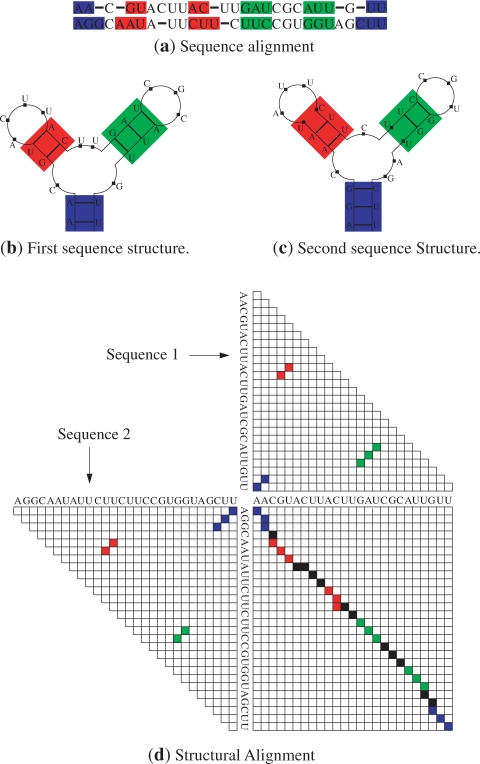
These conditions ensure that the two pairs of sequence fragments form ‘stem-like’ regions, which can be counterparts of each other in a common secondary structure allowable under the given sequence alignment. In this setting, a base pair within one structure may be inserted (with respect to the second sequence), aligned with a corresponding base pair in the second structure, or the two nucleotides within the base pair may be individually aligned with unpaired nucleotides within the second sequence. This definition can be mathematically formalized (29). Figure 1a and b illustrates structures and sequence alignment, respectively, of two pairs of fragments in two RNA sequences, which constitute a matched helical region. Given two RNA sequences, a structural alignment of these sequences refers to secondary structures of sequences, a valid sequence alignment and a set of matched helical regions that include all the base pairs in the structures of sequences. Thus a structural alignment imposes commonality of secondary structures by requiring that the corresponding ‘stem-like’ regions in the two sequences, defined by the matched helical regions, include all the base pairs in both secondary structures. A structural alignment of two hypothetical RNA sequences is illustrated in Figure 2. Sequence alignment and secondary structures are shown in Figure 2a, b and c, respectively. The matched helical regions are indicated by colored rectangles. The rectangles with same color enclose the fragments that make up a matched helical region. Figure 2d consists of dot plot representations of structures (triangular dot plots) and alignment (rectangular dot plot) of sequences. The structure dot plots indicate the base pairs in secondary structures where a base pair is represented by a square-shaped dot at the corresponding position. The color of a dot representing a base pair indicates the matched helical region that contains the base pair. A particular matched helical region is represented by the same color in dot plots and in alignment and secondary structure representations in Figure 2a, b and c. The sequence alignment dot plot represents the sequence alignment in Figure 2a. An alignment position in the alignment of the sequences shown in Figure 2a is represented by a square dot at the corresponding alignment position in dot plot. The color of a dot in the alignment dot plot indicates the matched helical region that includes the alignment position that the dot represents. Each matched helical region is represented with same color as in the structure dot plots.
Figure 1.
Example of a matched helical region. (a) shows pairing of nucleotides where bold lines represent hydrogen bonds. The fragments that make up matched helical regions are enclosed by dashed rectangles in (a). (b) shows the alignment of nucleotides in matched helical region, pairing of nucleotides are also shown in (b) by bold lines connecting base paired nucleotides. (b) illustrates alignment of base pairs, insertion of base pairs and alignment of base pairs to unpaired nucleotides.
Figure 2.
Structural alignment of two hypothetical RNA sequences. Sequence alignment and secondary structures are shown in (a), (b) and (c). Matched helical regions are indicated in (b) and (c) inside colored rectangles. (d) illustrates joint representation of sequence alignment and common secondary structures.
The structural alignment model is more representative of actual (manually determined) alignments than previously utilized models because, in matched helical regions, base pairs can be inserted and can be aligned to unpaired nucleotides or paired nucleotides at any position in both structures. This can be seen in Figure 2 where the nucleotides in the G–U pair in the first structure (Figure 2b) are aligned with the unpaired nucleotides in the second structure (Figure 2c) in the matched helical region indicated in green. Furthermore in the matched helical region shown in blue, the second sequence structure has a base pair insertion with respect to the first sequence that closes a multibranch loop. Typical implementations of pairwise secondary structure prediction methods disallow both of these events even though they are seen in homologous RNA secondary structures.
Probabilistic scoring of structural alignments
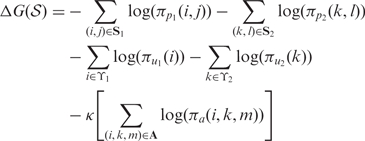
Multiple structural alignments are typically feasible for a given pair of RNA sequences. In order to jointly predict common secondary structure and alignment, a scoring methodology to evaluate the quality of the structural alignment is required. Using an analogy with Gibbs free energy based computation of secondary structure stability, in this work a pseudo free energy change of a structural alignment is utilized as a measure that quantifies both joint ‘stability’ of common secondary structures and sequence alignment in a structural alignment. The pseudo free energy change depends on the precomputed base pairing probabilities (24) in order to quantify stability of common secondary structures and on precomputed probabilities of alignment (13) to quantify the likelihood of sequence alignment in a structural alignment. The pseudo free energy change of a structural alignment  of two RNA sequences is defined as:
 |
1 |
where S1 and S2 represent the sets of base pairs in the first and second sequence, respectively. ϒ1 and ϒ2 correspond to the sets of unpaired bases in structures of respective sequences. πpq(r, s) is the precomputed base pairing probability of nucleotides at indices r and s in sequence q, and πuq(r) is the precomputed unpairing probability of nucleotide at index r in sequence q. A denotes an alignment between the two sequences and πa(i, k, m) is the precomputed probability of alignment state m at alignment position (i, k). m denotes an alignment state taking one of three values ALN, INS1, or INS2 depending, respectively, on whether i and k are aligned, i is an insertion in sequence 1, or k is an insertion in sequence 2. κ is a weighting parameter that controls the relative contributions of alignment and pairing probabilities to the pseudo free energy. The pseudo free energy computation is similar to Hofacker and Stadler (25), but it differs in two respects: (i) unpairing probabilities are explicitly included in the calculation of structural alignment scores and (ii) the space of allowable structural alignments is generalized as indicated above.
Interpreting pseudo free energy change similar to thermodynamic free energy change, a (pseudo) thermodynamic probabilistic model can be introduced, where the probability of a structural alignment  is
is
| 2 |
where  denotes the (pseudo) Boltzmann partition function. Based on this probabilistic model, the MAP structural alignment for given two sequences can be represented by
| 3 |
where X1 and X2 represents the first and second sequence, respectively. From Equation (3) it follows that the MAP structural alignment corresponds to the structural alignment with the lowest pseudo free energy and can therefore be determined by pseudo free energy minimization. The posterior base pairing probability of nucleotides in individual sequences can be determined as
| 4 |
where i□j corresponds to the event that nucleotide at index i and index j in first sequence are paired in the structure of first sequence.
Efficient computation of structural alignment
Joint MAP prediction of structural alignment as defined in Equation (3) requires finding the structural alignment that has global minimum pseudo free energy. Determination of joint a posteriori base pairing probabilities of nucleotides as given in Equation (4) requires summation of negative exponential of pseudo free energies of all possible structural alignments of sequences to determine the partition function, Z. In addition, an appropriate marginalization is required as formulated in Equation (4). The number of possible structural alignments of two RNA sequences increases exponentially in length of shorter sequence (26). A brute force approach to enumerate all the possible structural alignments is not feasible for typical length sequences.
Fortunately, for the combination of structural alignment and probabilistic models adopted here (This highlights the advantage of our definition of a structural alignment in terms of ‘Matched Helical Regions’. In comparison with prior methods, the structural alignment definition not only enlarges the search space to permit more of the known structural alignments, but it also does so while allowing a dynamic programming solution.) the problems of determining the MAP structural alignment and of estimating the base pairing probabilities, exhibit the overlapping subproblems property (30), which allows these problems to be recursively decomposed using a dynamic programming algorithm. The dynamic programming algorithm for MAP prediction determines the structural alignments of subsequences with minimum pseudo free energy and uses these energies and structural alignments to determine the structural alignment with minimum pseudo free energy for longer subsequences. Joint a posteriori base pairing probability calculation uses a similar approach. Partition function calculations sum exponentials of negative pseudo free energies of structural alignments of subsequences and use these scores to determine exponential negative pseudo free energy sums of structural alignments of longer subsequences. The details of the dynamic programming algorithms for joint MAP prediction and posterior base pair probability calculations are included in the Supplementary Data.
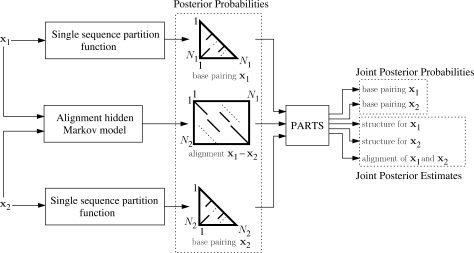
The dynamic programming algorithm is implemented in a program called PARTS. Figure 3 illustrates the inputs and outputs of the PARTS algorithm. The PARTS algorithm outputs an MAP estimate of the structural alignment and estimates of a posteriori base pairing probabilities of base pairs in individual sequences. Predictions of the common secondary structures and sequence alignment can be extracted from the MAP structural alignment.
Figure 3.
PARTS algorithm input-output flowchart. The precomputed base pairing probabilities and precomputed alignment probabilities are input to algorithm. Joint posterior base pairing probabilities of individual sequences and joint posterior estimates of individual structures and alignment of sequences are output.
PARTS is a dynamic programming algorithm with time complexity O(N6) and memory complexity O(N4) where N is the length of the shorter of the two sequences. For typical sequence lengths, without additional constraints, these requirements are often prohibitive on current desktop systems. The complexity of the algorithm is therefore decreased by constraining the search in the alignment and folding space using principled heuristics, as in prior work (13). Two nucleotides with low precomputed probability of being in the alignment, i.e. summation of probability that they are aligned or one is inserted, are not allowed in alignment. Similarly, two nucleotides, which precomputed probability of base pairing equal to 0.0 do not require storage in the arrays which handle base paired nucleotides.
Scoring of predicted structure and alignments
The structure and alignment prediction accuracies are reported in terms of sensitivity and positive predictive value (PPV). Sensitivity of structural (alignment) prediction is the ratio of number of correctly predicted base pairs (aligned positions) to the number of base pairs (aligned positions) in the correct structure (alignment). PPV of structural (alignment) prediction is the ratio of number of correctly predicted base pairs (aligned positions) to the number of base pairs (aligned positions) in the predicted structure (alignment). In accordance with prior work (31,32), the number of correctly predicted base pairs is determined by counting the base pairs in correct structure which match the base pairs in predicted structure with one nucleotide ‘slippage’, i.e. a predicted base pair at (i, j) is considered to be correctly predicted if there is a base pair at (i+1, j) or (i−1, j) or (i, j−1) or (i, j+1).
Alignment weight parameter selection
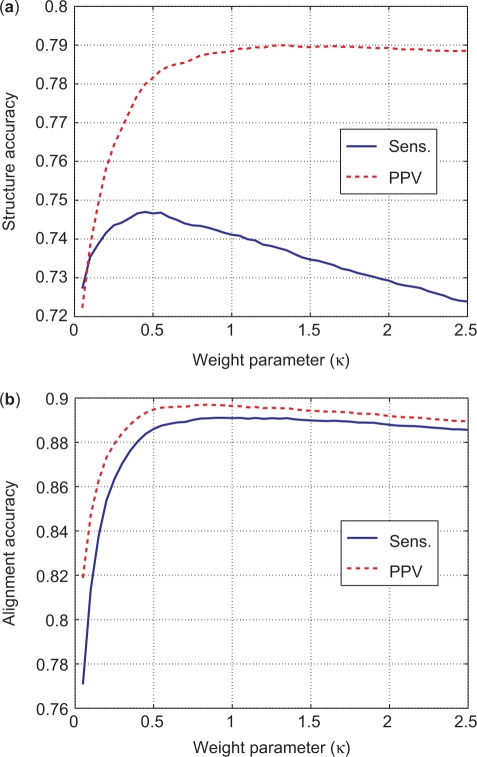
The alignment weight, κ in Equation (1), determines the relative contributions of the alignment and pairing probabilities to the overall scoring function. κ is empirically determined by choosing the alignment weight that maximizes PPV while maintaining a reasonable sensitivity for structural prediction. Figure 4a represents the structural prediction accuracy versus κ and Figure 4b represents the alignment prediction accuracy versus κ. Both sensitivity and PPV of alignment prediction increases as the weight of alignment is increased. Sensitivity of structural prediction has a peak around κ = 0.45. PPV of structure prediction increases slowly with increasing κ bigger than 1.0, however sensitivity decreases as κ is increased. As a suitable compromise, κ = 1.0 is chosen as the alignment weight in PARTS.
Figure 4.
Sensitivity and PPV of structure (a) and alignment (b) prediction as a function of the weight parameter κ. The prediction accuracy is averaged over a training data set of 1000 tRNA pairs from the Sprinzl Database (32) and 1000 5S rRNA pairs from 5S Ribosomal RNA Database (27). κ = 0.45 maximizes structure prediction sensitivity. Structure prediction PPV increases asymptotically with increasing κ. Alignment prediction sensitivity and PPV both decrease slowly for κ > 1.0.
RESULTS
The performance of PARTS in structure and alignment prediction, and time and memory requirements of PARTS are evaluated and compared with six other methods:
Dynalign (13), which is an implementation of Sankoff 's algorithm (22) for predicting the common secondary structure of two RNA sequences based on free energy minimization. Dynalign as included in RNAstructure version 4.5 was utilized. The single folding percent threshold was set to 25% (‘singlefold_subopt_percent=25’ option in the configuration file) and default values were utilized for all other parameters.
FOLDALIGN (17), an implementation of Sankoff 's algorithm for multiple structural alignment of RNA sequences that is based on a maximization of a score that includes structural free energies and alignment terms. Version 2.1.0 was utilized in global mode (‘-global’ option).
StemLoc (16), a Stochastic Context Free Grammar method. Version 0.19b was utilized in global mode (‘-g’ option) using 100 best alignments and 1000 best foldings to constrain alignment and folding spaces, respectively (‘-na 100 -nf 1000’ option).
Consan [15], a second Stochastic Context Free Grammar method. Version 1.2 was utilized using the model file obtained from training with the LSU and SSU RNA dataset included with Consan package (‘mltrain -s mixed80.mod mixed80.stk’).
LocARNA (18), a pairwise RNA sequence alignment algorithm that aligns base pairing probability matrices obtained from individual sequences under a linear gap penalty model. Version 0.99 was utilized with global options (‘–struct-local=false –sequ-local=false’). The base pairing matrices are computed with RNAfold program (with command line option ‘-p’) from Vienna RNA Package version 1.6.5.
Single sequence structure prediction based on the nearest neighbor model (6) and alignment obtained from a Hidden Markov Model (HMM) (13). These methods utlized corresponding software implementations as included in RNAstructure, version 4.5.
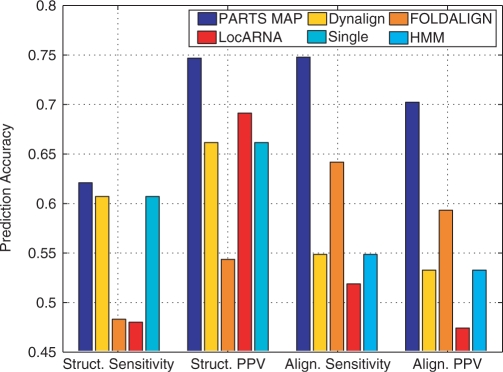
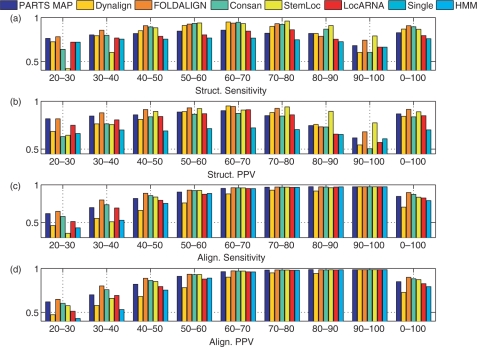
The methods were first evaluated over a dataset consisting of 40 randomly chosen RNase P pairs from the RNase P Database (28). Since the RNase family exhibits greater diversity in structural alignments, which was observed to be a problem for existing methods (See Discussion section for specific examples.) for secondary structure prediction, it was particularly chosen to evaluate the benefit of the more general structural alignment of PARTS. Consan and StemLoc could not be run over the RNase P dataset because the memory requirements of each algorithm generally exceeded our hardware capability. All other methods were used to predict common secondary structures and alignments for the chosen RNase P pairs. Figure 5 shows the sensitivity and PPV of structure and alignment prediction of four of the methods over the RNase P dataset (Results are presented in a bar graph format in order to allow ready comparisons. Numerical values are tabulated in the Supplementary Data.). Results in Figure 5 indicate that PARTS algorithm performs significantly better than the other comparative sequence analysis methods and marginally better than single sequence prediction method over the RNase P dataset, in both structure and alignment prediction. The improvement in the predictions over the other methods arises primarily due to the added generality of the structural alignment model in PARTS, which allows it to better handle the diversity in the RNase P family. This aspect is discussed in greater detail in the Discussion section that follows the current section.
Figure 5.
Structure and alignment prediction accuracy of five methods over the RNase P dataset. ‘Struct. Sensitivity’ and ‘Struct. PPV’ correspond to ‘Structure Sensitivity’ and ‘Structure PPV’, and ‘Align. Sensitivity’ and ‘Align. PPV’ correspond to ‘Alignment Sensitivity’ and ‘Alignment PPV’, respectively.
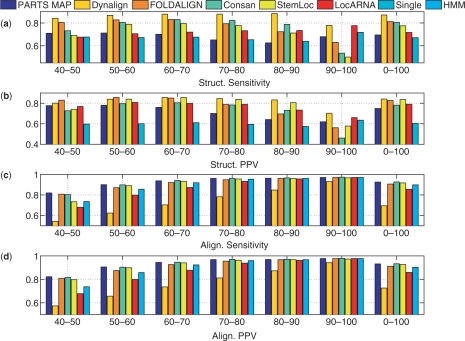
The methods were also tested over a tRNA dataset containing 2000 randomly chosen pairs of tRNA sequences (32) from the Sprinzl Database and a 5S rRNA dataset containing 2000 randomly chosen 5S rRNA sequences from the 5S rRNA Database (27). These datasets are included in order to evaluate the performance of methods over relatively short sequences. Figure 6 show the sensitivity and PPV of alignment and structure prediction of all methods over the tRNA dataset. Figure 7 show the sensitivity and PPV (using slippage counting of correctly predicted base pairs) of structure and alignment prediction of all methods benchmarked over the 5S rRNA dataset. For comparison, the results over each of the databases were stratified by percent sequence identity. The results for tRNA and 5S rRNA datasets show that PARTS performs better than single sequence method both in alignment prediction and in structure prediction, which highlights the fact that tackling the structure prediction and sequence alignment problems jointly offers advantage. When comparing against other methods that handle these problems jointly, the results are mixed. In general, the accuracy of PARTS MAP alignment prediction is among the highest: Comparable to Consan and better than others over the 5S rRNA dataset, and slightly worse than Consan and FOLDALIGN over the tRNA dataset. In terms of accuracy of predicted structures, the other methods outperform PARTS MAP except for tRNA dataset where it performs better than LocARNA. The extended structural alignment model of PARTS algorithm is not particularly advantageous for tRNA and 5S rRNA families because the diversity in structural alignment seen in the RNase P family is not seen in these families. In these cases, the more sophisticated scoring functions adopted by the other methods outperform the relatively simple pseudo free energy of PARTS algorithm. Specific limitations of the scoring model in PARTS are highlighted in the ensuing Discussion section.
Figure 6.
Structure and alignment prediction accuracies of seven methods over the tRNA dataset. The results are stratified with respect to percent sequence identity. ‘Struct. Sensitivity’ and ‘Struct. PPV’ correspond to ‘Structure Sensitivity’ and ‘Structure PPV’, and ‘Align. Sensitivity’ and ‘Align. PPV’ correspond to ‘Alignment Sensitivity’ and ‘Alignment PPV’, respectively.
Figure 7.
Structure and alignment prediction accuracies of seven methods over the 5S rRNA dataset. The results are stratified with respect to percent sequence identity. ‘Struct. Sensitivity’ and ‘Struct. PPV’ correspond to ‘Structure Sensitivity’ and ‘Structure PPV’, and ‘Align. Sensitivity’ and ‘Align. PPV’ correspond to ‘Alignment Sensitivity’ and ‘Alignment PPV’, respectively.
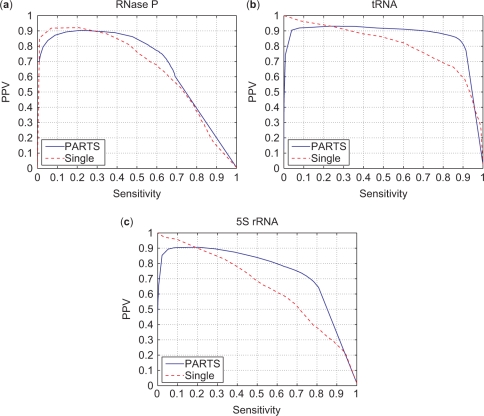
The posterior base pairing probability predictions of PARTS are compared with predictions obtained from a single sequence method (24). For a chosen threshold probability, Pthresh, the sensitivity and PPV of structures that are composed of base pairs whose pairing probability is estimated to be higher than Pthresh can be determined. Curves obtained by plotting the sensitivity and PPV against each other for varying Pthresh between 0 and 1 provide a comparison of the performance of PARTS posterior and single sequence posterior methods. These are shown in Figure 8a, b and c for the RNase P, tRNA and 5S rRNA datasets, respectively. The optimal performance with 100% sensitivity and 100% PPV corresponds to top right corner of the graphs. The curve corresponding to the PARTS algorithm passes closer to the top right corner in all three graphs, indicating the superiority of the base pairing probability estimates obtained by PARTS over the single sequence method.
Figure 8.
PPV versus Sensitivity of predicted base pairs with changing pairing probability threshold (Pthresh) when PARTS and single sequence partition function is run over RNase P, tRNA and 5S rRNA datasets.
The computation time and memory requirements of PARTS MAP, Dynalign, FOLDALIGN, Consan and StemLoc were determined over randomly chosen sets of 100 tRNA pairs, 100 5S rRNA pairs and 40 RNase P pairs. Tables 1 and 2 show the memory and computation time requirements, respectively, of all methods over these datasets for a dual-core AMD Opteron®-270 2.0 GHz system with 8 GBytes of main memory running Linux Fedora Core 5. The requirements of PARTS are higher than those for LocARNA, FOLDALIGN and Dynalign but significantly lower than StemLoc and Consan. The requirements for all methods increase with increasing the length of the RNA sequences. Correspondingly, the RNA families in increasing order of computational time and memory requirements are tRNA (average sequence length 77.10 nucleotides), 5S rRNA (average sequence length 119.44 nucleotides), and RNase P (average sequence length 345.91 nucleotides). A comparison across the families indicates that the time and memory requirements for PARTS scale in a manner comparable to Dynalign and FOLDALIGN. Note that the alignment and folding constraints described previously for calculations with Dynalign reduce the computation time and memory requirements of PARTS (13).
Table 1.
Memory requirements (in megabytes of main memory) of five methods over 100 random tRNA pairs and 100 random 5S rRNA pairs
| tRNA | 5S rRNA | RNase P | |||||||
|---|---|---|---|---|---|---|---|---|---|
| Min | Max | Avg | Min | Max | Avg | Min | Max | Avg | |
| PARTS | 16.1 | 193.5 | 58.1 | 26.9 | 111.4 | 50.4 | 212.8 | 7807.7 | 2042.2 |
| Dynalign | 15.9 | 22.0 | 17.7 | 17.3 | 21.1 | 18.6 | 38.3 | 548.6 | 141.3 |
| FOLDALIGN | 8.6 | 19.5 | 13.8 | 13.3 | 30.0 | 19.0 | 58.4 | 182.8 | 104.9 |
| Consan | 43.4 | 447.5 | 145.8 | 106.0 | 863.6 | 172.7 | N/A | N/A | N/A |
| StemLoc | 52.2 | 625.7 | 190.7 | 24.0 | 327.5 | 168.7 | N/A | N/A | N/A |
| LocARNA | 7.5 | 7.6 | 7.6 | 7.6 | 7.9 | 7.7 | 8.9 | 10.4 | 9.5 |
‘Min’ corresponds to minimum memory usage, ‘Max’ corresponds to maximum memory usage, and ‘Avg’ corresponds to average memory usage.
Table 2.
Run time statistics of five methods over 100 random tRNA pairs, 100 random 5S rRNA pairs and 40 RNase P pairs
| tRNA | 5S rRNA | RNase P | |||||||
|---|---|---|---|---|---|---|---|---|---|
| Min | Max | Avg | Min | Max | Avg | Min | Max | Avg | |
| PARTS | 1 | 88 | 15 | 3 | 41 | 9.91 | 155 | 69707 | 8813.7 |
| Dynalign | 1 | 39 | 6.48 | 2 | 34 | 5.89 | 81 | 52278 | 6603.3 |
| FOLDALIGN | 1 | 5 | 1.81 | 2 | 15 | 5.22 | 221 | 26226 | 6800.6 |
| Consan | 27 | 911 | 187.98 | 130 | 1381 | 303.07 | N/A | N/A | N/A |
| StemLoc | 2 | 533 | 34.14 | 3 | 75 | 16.7 | N/A | N/A | N/A |
| LocARNA | <0.5 | <0.5 | <0.5 | <0.5 | 1 | 0.52 | 12 | 53 | 25.75 |
‘Min’ corresponds to minimum running time, ‘Max’ corresponds to maximum running time and ‘Avg’ corresponds to average running time in seconds.
DISCUSSION
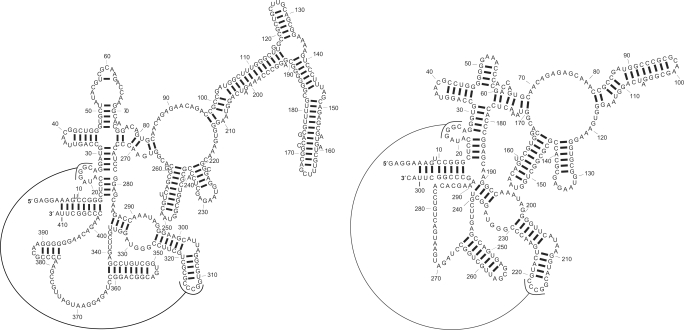
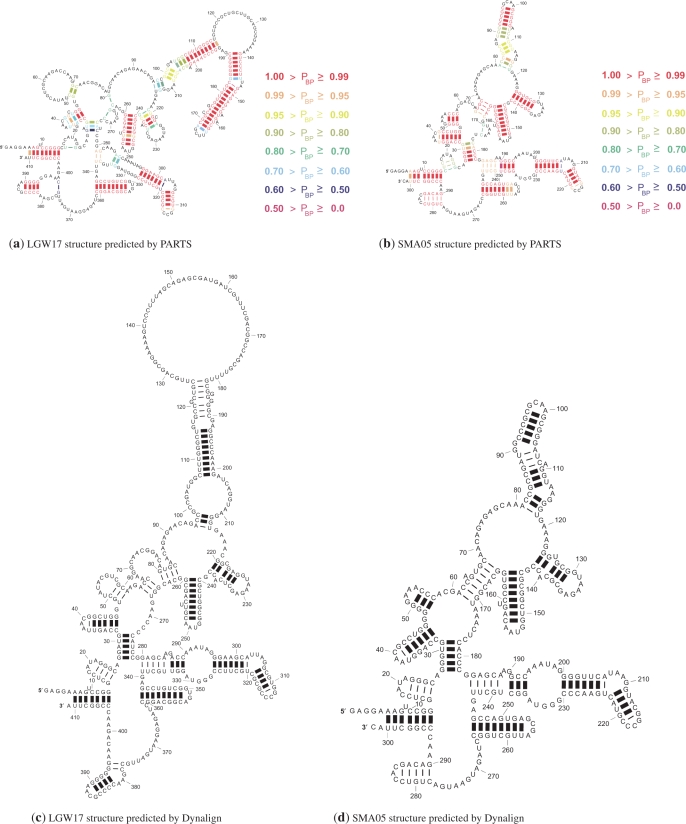
As indicated earlier, the structural alignment model in PARTS is more general than Sankoff 's original formulation allowing for base pair insertions anywhere in matched helical regions and alignment of paired bases in one structure with unpaired bases in the other. This generalization contributes a significant improvement to the prediction accuracy of PARTS over the RNase P dataset. We illustrate this by means of an example. Figure 9 shows known structures of LGW17 and SMA-05. Figure 10 illustrates structures of these sequences that are predicted by PARTS and Dynalign. The structures predicted by PARTS in Figure 10 are color annotated to also illustrate the posterior probabilities, as estimated by PARTS, for the base pairs in the predicted MAP structures. The structures of these sequences predicted by FOLDALIGN and LocARNA are included in the Supplementary Data. The structure prediction sensitivity and PPV values for SM-A05 are comparable: 80% and 77% PARTS, 73% and 70% for Dynalign, 80% and 77% FOLDALIGN, 69% and 68% for LocARNA. The base pair prediction sensitivity and PPV values for structure of LGW17 show significant variation: 73% and 88% for PARTS, 54% and 67% for Dynalign, 54% and 74% for FOLDALIGN, 47% and 68% for LocARNA. The predicted structures for LGW17 are generally similar except for the highly varying domain which starts with base pairs between nucleotides between 96 and 214 in each predicted structure. When the homologous helical branch in structure of SM-A05 is compared with this branch in structure of LGW17, the difference in the lengths of the helices is noticeable. In pairwise structure prediction, the length difference in helical branches can be handled in two ways: base pair insertions or alignment of base pairs to unpaired bases. Among all common secondary structure prediction methods, only the structural alignment model of PARTS handles both of these approaches. The alignment models of Dynalign and FOLDALIGN handle base pair insertions with constraints on placement of these insertions. The alignment model of LocARNA does not handle either of these. The predicted structures (and accuracies) of LGW17 show how the structural alignment model of PARTS, rooted in the flexibility provided by matched helical regions, helps to predict both helical branches. Dynalign and FOLDALIGN predict fewer correct base pairs. LocARNA predicts the lowest number of base pairs in the helical branch correctly.
Figure 9.
Known structures of RNase P sequences LGW17 (left) and SM-A05 (right).
Figure 10.
Structures of RNase P sequences LGW17 and SM-A05, from the RNase P dataset, as predicted by PARTS and Dynalign. Heavy lines indicate the correctly predicted base pairs.
There are several factors that affect the accuracy of the common secondary structure and alignment predictions of PARTS and other methods. The pseudo free energy computation in Equation (1) implicitly treats the precomputed probabilities for the base pairing and alignment states as though the events corresponding to these states are independent. Neither the base pairing events in a secondary structure nor the alignment events in a valid sequence alignment are truly independent. The assumption of independence is utilized nonetheless because it allows a significant reduction in memory requirements and computational complexity. Experiments that were conducted to determine base pairing probabilities in helical regions showed that PARTS tends to overestimate the probabilities of base pairing in long helices compared to shorter helices because of the independence assumption. This limitation deteriorates the accuracy of prediction of MAP common secondary structure, MAP alignment and joint posterior probabilities of base pairing. Another factor that affects performance of prediction accuracy of PARTS is the fact that alignment weight parameter is experimentally determined based on maximizing PPV of structure prediction accuracy. Figure 4a indicates that the κ value used in PARTS, κ= 1.0, does not lead to maximum sensitivity for structure prediction. This fact should be taken into account when PARTS is compared with other methods with respect to sensitivity of structure prediction.
The accuracy of secondary structure prediction methods can be improved by including more than two homologs in the joint prediction of structure. There are two potential approaches for addressing this: (i) Generalizing the two sequence methods to handle more sequences (11) or (ii) Combining results from pairwise prediction for more than two homologs (18,17,16). The former approach tends to be extremely computationally demanding even for three sequences hence considerable effort has been directed toward the latter approach. In particular, results from StemLoc, FOLDALIGN and LocARNA have been utilized in programs that combine the pairwise predictions from these methods over more than two sequences in order to improve accuracy (18,17,16). The pairwise predictions from PARTS could be similarly utilized, though this is beyond the scope of the present manuscript.
SUPPLEMENTARY DATA
Supplementary Data are available at NAR Online. These enumerate the PARTS recursions, and include structure prediction accuracy scores under exact match criteria and predicted structures for RNase P sequences LGW17 and SM-A05 obtained with LocARNA and FOLDALIGN. PARTS source code is available for download under the GNU public license at http://rna.urmc.rochester.edu.
ACKNOWLEDGEMENTS
This work was partially supported by National Institutes of Health grant HG004002 to DHM. DHM is an Alfred P. Sloan Foundation Research Fellow. Funding to pay the Open Access publication charges for this article was provided by the Univesity of Rochester and by the National Institutes of Health.
Conflict of interest statement. None declared.
REFERENCES
- 1.Eddy SR. Non-coding RNA genes and the modern RNA world. Nat. Rev. 2001;2:919–929. doi: 10.1038/35103511. [DOI] [PubMed] [Google Scholar]
- 2.Eddy SR. Computational genomics of noncoding RNA genes. Cell. 2002;109:137–140. doi: 10.1016/s0092-8674(02)00727-4. [DOI] [PubMed] [Google Scholar]
- 3.Uzilov AV, Keegan JM, Mathews DH. Detection of non-coding RNAs on the basis of predicted secondary structure formation free energy change. BMC Bioinformatics. 2006;7:173. doi: 10.1186/1471-2105-7-173. [DOI] [PMC free article] [PubMed] [Google Scholar]
- 4.Washietl S, Hofacker IL, Stadler PF. Fast and reliable prediction of noncoding RNAs. Proc. Natl Acad. Sci. USA. 2005;102:2454–2459. doi: 10.1073/pnas.0409169102. [DOI] [PMC free article] [PubMed] [Google Scholar]
- 5.Torarinsson E, Sawera M, Havgaard JH, Fredholm M, Gorodkin J. Thousands of corresponding human and mouse genomic regions unalignable in primary sequence contain common RNA structure. Genome Res. 2006;16:885–889. doi: 10.1101/gr.5226606. [DOI] [PMC free article] [PubMed] [Google Scholar]
- 6.Mathews DH, Disney MD, Childs JL, Schroeder SJ, Zuker M, Turner DH. Incorporating chemical modification constraints into a dynamic programming algorithm for prediction of RNA secondary structure. Proc. Natl Acad. Sci. USA. 2004;101:7287–7292. doi: 10.1073/pnas.0401799101. [DOI] [PMC free article] [PubMed] [Google Scholar]
- 7.Dowell RD, Eddy SR. Evaluation of several lightweight stochastic context-free grammars for RNA secondary structure prediction. BMC Bioinformatics. 2004;5:71. doi: 10.1186/1471-2105-5-71. [DOI] [PMC free article] [PubMed] [Google Scholar]
- 8.Zuker M. Mfold web server for nucleic acid folding and hybridization prediction. Nucleic Acids Res. 2003;31:3406–3415. doi: 10.1093/nar/gkg595. [DOI] [PMC free article] [PubMed] [Google Scholar]
- 9.Hofacker IL. Vienna RNA secondary structure server. Nucleic Acids Res. 2003;31:3429–3431. doi: 10.1093/nar/gkg599. [DOI] [PMC free article] [PubMed] [Google Scholar]
- 10.Yoon B-J, Vaidyanathan PP. Optimal alignment algorithm for context-sensitive hidden Markov Models. Proceedings of the IEEE International Conference Acoustics, Speech, and Signal Proceedings (ICASSP) 2005;Vol. 4:293–296. [Google Scholar]
- 11.Masoumi B, Turcotte M. Simultaneous alignment and structure prediction of three RNA sequences. Int. J. Bioinform. Res. Appl. 2005;1:230–245. doi: 10.1504/IJBRA.2005.007581. [DOI] [PubMed] [Google Scholar]
- 12.Hofacker IL, Fekete M, Stadler PF. Secondary structure prediction for aligned RNA sequences. J. Mol. Biol. 2002;319:1059–1066. doi: 10.1016/S0022-2836(02)00308-X. [DOI] [PubMed] [Google Scholar]
- 13.Harmanci AO, Sharma G, Mathews DH. Efficient pairwise RNA structure prediction using probabilistic alignment constraints in dynalign. BMC Bioinformatics. 2007;8:130. doi: 10.1186/1471-2105-8-130. [DOI] [PMC free article] [PubMed] [Google Scholar]
- 14.Harmanci AO, Sharma G, Mathews DH. Toward turbo decoding of RNA secondary structure. Proceedings of the IEEE International Conference Acoustics, Speech, and Signal Proceedings (ICASSP) 2007;Vol. 1:365–368. [Google Scholar]
- 15.Dowell RD, Eddy SR. Efficient pairwise RNA structure prediction and alignment using sequence alignment constraints. BMC Bioinformatics. 2006;7:400. doi: 10.1186/1471-2105-7-400. [DOI] [PMC free article] [PubMed] [Google Scholar]
- 16.Holmes I. Accelerated probabilistic inference of RNA structure evolution. BMC Bioinformatics. 2005;6:73. doi: 10.1186/1471-2105-6-73. [DOI] [PMC free article] [PubMed] [Google Scholar]
- 17.Havgaard JH, Torarinsson E, Gorodkin J. Fast pairwise structural RNA alignments by pruning of the dynamical programming matrix. PLoS Comput. Biol. 2007;3:10. doi: 10.1371/journal.pcbi.0030193. [DOI] [PMC free article] [PubMed] [Google Scholar]
- 18.Will S, Reiche K, Hofacker IL, Stadler PF, Backofen R. Inferring noncoding rna families and classes by means of genome-scale structure-based clustering. PLoS Comput. Biol. 2007;3:4. doi: 10.1371/journal.pcbi.0030065. [DOI] [PMC free article] [PubMed] [Google Scholar]
- 19.Xia T, SantaLucia JJ, Kierzek R, Schroeder SJ, Jiao X, Cox C, Turner DH. Thermodynam‘ic parameters for an expanded nearest-neighbor model for formation of RNA duplexes with Watson-Crick pairs. Biochemistry. 1998;37:14719–14735. doi: 10.1021/bi9809425. [DOI] [PubMed] [Google Scholar]
- 20.Condon A, Hoos H, Mathews D, Murphy K. Efficient parameter estimation for RNA secondary structure prediction’. Bioinformatics. 2007;23:13. doi: 10.1093/bioinformatics/btm223. [DOI] [PubMed] [Google Scholar]
- 21.Do C, Woods D, Batzoglou S. CONTRAfold: RNA secondary structure prediction without energy-based models. Bioinformatics. 2006;22:14. doi: 10.1093/bioinformatics/btl246. [DOI] [PubMed] [Google Scholar]
- 22.Sankoff D. Simultaneous solution of RNA folding, alignment and protosequence problems. SIAM J. Appl. Math. 1985;45:810–825. [Google Scholar]
- 23.McCaskill JS. The equilibrium partition function and base pair binding probabilities for RNA secondary structure. Biopolymers. 1988;29:1105–1119. doi: 10.1002/bip.360290621. [DOI] [PubMed] [Google Scholar]
- 24.Mathews DH. Using an RNA secondary structure partition function to determine confidence in base pairs predicted by free energy minimization. RNA. 2004;10:1178–1190. doi: 10.1261/rna.7650904. [DOI] [PMC free article] [PubMed] [Google Scholar]
- 25.Hofacker IL, Stadler PF. Cold Spring Harbor Laboratory Press; 2004. In Lecture Notes in Computer Science, Computational Science - ICCS 2004; pp. 728–735. [Google Scholar]
- 26.Giegerich R, Voß B, Rehmsmeier M. Abstract shapes of RNA. Nucleic Acids Res. 2004;32:4834–4851. doi: 10.1093/nar/gkh779. [DOI] [PMC free article] [PubMed] [Google Scholar]
- 27.Szymanski M, Barciszewska MZ, Barciszewski J, Erdmann VA. 5S ribosomal RNA database Y2K. Nucleic Acids Res. 2000;28:166–167. doi: 10.1093/nar/28.1.166. [DOI] [PMC free article] [PubMed] [Google Scholar]
- 28.Brown J. The Ribonuclease P database. Nucleic Acids Res. 1999;27:314. doi: 10.1093/nar/27.1.314. [DOI] [PMC free article] [PubMed] [Google Scholar]
- 29.Harmanci AO, Sharma G, Mathews DH. Probabilistic structural alignment of RNA sequences. Accepted for presentation in IEEE International Conference on Acoustics, Speech and Signal Processing; March 30–April 4, 2008; Las Vegas, Nevada. [Google Scholar]
- 30.Cormen TH, Leiserson CE, Rivest RL, Stein C. Introduction to Algorithms. Cambridge, MA: 2nd edn. The MIT Press; 2001. [Google Scholar]
- 31.Lu ZJ, Turner DH, Mathews DH. A set of neighbor parameters for predicting the enthalpy change of RNA secondary structure formation. Nucleic Acids Res. 2006;34:13. doi: 10.1093/nar/gkl472. [DOI] [PMC free article] [PubMed] [Google Scholar]
- 32.Sprinzl M, Horn C, Brown M, Ioudovitch A, Steinberg S. Compilation of tRNA sequences and sequences of tRNA genes. Nucleic Acids Res. 1998;26:148–153. doi: 10.1093/nar/26.1.148. [DOI] [PMC free article] [PubMed] [Google Scholar]


