


Abstract
Metagenomics is providing striking insights into the ecology of microbial communities. The recently developed massively parallel 454 pyrosequencing technique gives the opportunity to rapidly obtain metagenomic sequences at a low cost and without cloning bias. However, the phylogenetic analysis of the short reads produced represents a significant computational challenge. The phylogenetic algorithm CARMA for predicting the source organisms of environmental 454 reads is described. The algorithm searches for conserved Pfam domain and protein families in the unassembled reads of a sample. These gene fragments (environmental gene tags, EGTs), are classified into a higher-order taxonomy based on the reconstruction of a phylogenetic tree of each matching Pfam family. The method exhibits high accuracy for a wide range of taxonomic groups, and EGTs as short as 27 amino acids can be phylogenetically classified up to the rank of genus. The algorithm was applied in a comparative study of three aquatic microbial samples obtained by 454 pyrosequencing. Profound differences in the taxonomic composition of these samples could be clearly revealed.
INTRODUCTION
In metagenomics, the collective genomes from natural microbial communities are randomly sampled from the environment and subsequently sequenced (1–3). By directly accessing the genomic DNA of coexisting microbial species, these approaches have the potential of giving a comprehensive view of the evolution, lifestyle and diversity of free-living microbes (4–7). Moreover, considering that a vast majority of microbes resists cultivation with conventional methods (8–10), metagenomics has the potential to highly enlarge our window into the hidden world of microbes.
The massively parallel pyrosequencing system recently developed by 454 Life Sciences has dramatically dropped the time and cost constraints of DNA sequencing (11). Pyrosequencing not only produces large amounts of data at a low cost, but also allows sequencing of environmental DNA without a prior cloning step (12,13). Despite these advantages, the main drawback of the 454 technology is that at present only short reads are obtained (≈100 bp with the GS 20 and 250–300 bp with the GS FLX system). Short read length, inherent genetic heterogeneity within populations, inter-species gene conservation and variable species richness and evenness all make the assembly of environmental 454 reads into longer contiguous DNA sequences (contigs) a fundamental computational challenge.
Assessing the taxonomic composition of microbial communities is an essential question in metagenomics; but is still in its infancy. In this study, a novel method for the phylogenetic classification of unassembled 454 reads of an environmental sample is presented. The obtained taxonomic profiles can in turn be used to quantitatively characterize the underlying microbial communities.
Since the pioneering work of Carl Woese and colleagues (14,15), 16S rRNAs and 18S rRNAs are commonly used to determine evolutionary relationships between organisms. Analogously, one type of strategy uses 16S rRNA, 18S rRNA or other slowly evolving marker genes as ‘phylogenetic anchors’ to predict the taxonomic origins of environmental genomic fragments (3,16). While these methods frequently yield a high accuracy, only a small fraction of fragments can be taxonomically characterized, depending on the size of the used marker gene database. To overcome this limitation, novel methods have recently been devised that analyze the presence of short oligonucleotides or motifs to classify environmental DNA sequences into taxonomic groups (17,18). These methods give the capacity to accurately infer the source organisms of longer stretches of DNA, but to our knowledge cannot be applied to genomic sequences shorter than 1000 bp. On the other hand, simply classifying genomic fragments based on a best BLAST hit will only yield reliable results if close relatives are available for comparison (19). The recently published MEGAN software addresses this problem by classifying DNA fragments based on a lowest common ancestor algorithm (20).
The phylogenetic algorithm presented herein uses all Pfam (21) domain and protein families as phylogenetic markers to identify the source organisms of environmental DNA fragments as short as 80 bp. The method has two components: the first component identifies domain and protein family fragments in unassembled reads of a sample using Pfam profile hidden Markov models (pHMMs). Profile HMMs are very accurate for the detection of weak functional signals and short conserved functional sequences, which makes this technique particularly adequate for the analysis of unassembled 454 reads. In this study, environmental domain and protein family fragments identified in the reads of an environmental sample are defined as environmental gene tags (EGTs), which can be used to quantitatively characterize a metagenome. In the second component, a phylogenetic tree is reconstructed for each matching Pfam family. Environmental gene tags are classified into a higher-order taxonomy based on their phylogenetic relationships to family members with known taxonomic affiliations.
The algorithm was extensively evaluated on synthetic data sets. Environmental gene tags as short as 27 amino acids can accurately be classified with an average specificity ranging from 97% for superkingdom to 93% for order. The average sensitivity ranges from 84% for superkingdom to 61% for order. Moreover, the power of the method for studying the taxonomic composition of environmental samples was demonstrated in a comparative analysis of three aquatic microbial ecosystems. The analysis clearly revealed profound differences in the taxonomic composition of microbial communities from different aquatic habitats. All source code is available from http://www.cebitec.uni-bielefeld.de/brf/carma/carma.html
MATERIALS AND METHODS
Data sets
The Pfam fragment pHMM library (Pfam_fs), the Pfam MySQL database, the full multiple alignment of each Pfam family, as well as a fasta version of Pfam's; underlying sequence database (pfamseq) were downloaded from the Pfam web site (Pfam version 20.0). Pfam families with less than 10 members were excluded from the data set. Duplicate sequences were removed from each multiple alignment: if multiple copies of the same sequence of one organism were present (e.g. 100% identical sequences from different strains), only one of these was retained.
To evaluate the classification accuracy of our algorithm, 77 complete genomes were downloaded from GenBank (22). Genomes included in this dataset stem from taxonomic groups that are both over- and under-represented in the Pfam database. The taxonomic origin of the organisms was obtained from the US National Center for Biotechnology Information (NCBI) Taxonomy database (23). A synthetic metagenome was constructed as a standard of truth, by fragmenting the 77 complete genomes using the ReadSim software (R. Schmid et al., submitted for publication). In this study, the software was applied to simulate pyrosequencing using the GS 20 system. Using ReadSim, fragments of length ranging between 80 and 120 bp were randomly drawn from the 77 complete genomes with 2-fold coverage. The average fragment length was set to 100 bp, which corresponds to the average read length produced by the GS 20 sequencer. Additionally, artificial sequencing errors were introduced at homopolymers according to an internal error model. The ReadSim software was downloaded from http://www-ab.informatik.uni-tuebingen.de/software/readsim/.
The 454 reads of three ‘real’ microbial samples—a coral reef sample, a solar saltern sample and a stromatolite sample—were downloaded from the SDSU Center for Universal Microbial Sequencing (http://scums.sdsu.edu/). The coral reef sample was isolated from coral reef waters at the Kingman atoll located in the northern Line Islands of the central Pacific (coordinates: −162.3347833 W 6.38566667 N; Dinsdale et al., submitted for publication). The solar saltern sample was collected from the solar salterns in San Diego, CA (coordinates: −117.107356 W, 32.599040 N; Rodriguez-Brito et al., unpublished data). The stromatolite sample was taken from Rios Mesquites, Mexico (coordinates: −102.066390 W 26.985876 N; Desnues et al., unpublished data). Total community DNA of all three samples was purified as described elsewhere (12) and in their papers, and sequenced using pyrosequencing by 454 Life Sciences, Branford, CT, USA.
Algorithm
The presented method relies on two algorithmic components: the first is used for the detection of Pfam domain and protein family fragments (EGTs) that are conserved in an environmental sample. The second reconstructs a phylogenetic tree (family tree) for each matching Pfam family. These trees consist of all previously detected EGTs matching the family (matching EGTs) as well as all family members with a known taxonomic origin, called taxaknown members. Environmental gene tags are phylogenetically classified based on their location with respect to the taxaknown members in the reconstructed trees.
Detecting EGTs
Environmental gene tags are identified using the profile hidden Markov models (pHMMs) from the Pfam database. Pfam is a comprehensive database of manually curated domain and protein families (21). Each family is represented by a full multiple alignment of all known family members as well as by a pHMM, which can be employed to search for new, unknown family members.
First, a similarity search of each read of a sample is conducted against Pfam's; underlying sequence database using BLASTX (24) with the ‘−w 15’ frameshift option. This computes the 6-frame translations, predicts frameshifts, and identifies candidate members of Pfam families. Reads without a BLAST hit of E-value ≤ 10 are excluded from further analysis. This preprocessing step highly reduces the amount of computational effort that needs to be done when searching with the pHMMs. At the same time, the relaxed E-value cut-off of 10 during the BLAST search ensures that the overall sensitivity of the approach is reduced only for a small number of families.
Following the BLAST preprocessing step, all remaining reads are screened for conserved Pfam domain and protein families using the highly accurate Pfam pHMMs. Each read is translated according to its best BLASTX hit (i.e. in the hit reading frame), including all frameshifts predicted by BLASTX. In case that a read has BLASTX hits to more than one Pfam family, it is separately translated for each hit family. Subsequently, the translated sequences are aligned to the matching families using their local pHMM from the Pfam_fs database (E-value cut-off of 0.01). By using local pHMMs, even domain and protein families that are only partly covered by a read can be identified. The sequences of all identified Pfam family fragments (EGTs) are added to the multiple alignment of the matching Pfam family using hmmalign from the hmmer package (25).
Phylogenetic classification of short EGTs
EGTs are classified into a higher-order taxonomy based on the reconstruction of a phylogenetic tree. The multiple alignments of taxaknown members and matching EGTs of each Pfam family are used to calculate a pairwise distance of all combinations of taxaknown members and matching EGTs. The distance between two sequences is defined as their pairwise sequence identity, i.e. the fraction of identical amino acids in the aligned region. In case that the sequences of two EGTs do not have a sufficient overlap, their distance is estimated as described in section ‘Estimating distance of non-overlapping EGTs’ below. An unrooted phylogenetic tree is reconstructed from the pairwise distances using the neighbor-joining clustering method [with the NEIGHBOR program from the PHYLIP package (26)]. An adapted version of the algorithm developed by Nguyen et al. (27) is employed for parsing the reconstructed trees. EGTs are classified depending on their phylogenetic relationships with respect to taxaknown members. If an EGT g is localized within a group of taxaknown members sharing a common taxon t, then g is classified as t. Otherwise, it is classified as ‘unknown taxon’ (Figure 1).
Figure 1.

Unrooted phylogenetic tree reconstructed from a toy example multiple alignment. The multiple alignment shown was constructed from taxaknown members of a given Pfam family (PF1,…,PF7) and EGTs matching that family (EGT1,EGT2,EGT3). A phylogenetic tree reconstructed from the alignment is illustrated on the right. The environmental gene tag EGT1 is localized in a subtree c*(EGT1) of cyanobacteria (depicted in blue). Hence, it is classified as ‘Bacteria Cyanobacteria’. As c*(EGT1) contains cyanobacteria from different genera, EGT1 is classified as an unknown taxon at the rank of genus.
In detail, let T be an unrooted, binary family tree with nodes V. For an EGT g∈V, let c*(g) denote the subtree of T that has the smallest number of taxaknown members, while at the same time fulfilling the two conditions:
g∈c*(g)
c*(g) has at least three taxaknown members
Notably, for unrooted binary trees, three different subtrees arise from each internal node. For each taxonomic rank (superkingdom, phylum, class, order and genus) if at least 80% of the taxaknown members of c*(g) share a common taxon t, then g is also classified as t, otherwise it is classified as ‘unknown taxon’. The values used for the internal parameters were determined during an optimization phase of the algorithm.
Estimating distance of non-overlapping EGTs
Extremely short reads (e.g. 100 bp long) frequently cover a Pfam family only partially. Sequences of such EGTs may not overlap in the computed multiple alignment (for example, EGT2 and EGT3 in Figure 1). As the pairwise sequence identity of non-overlapping EGTs cannot be assessed from an alignment, their distance is estimated as follows: let S be the set of all sequences contained in a multiple alignment and d (s,s′) be the pairwise distance of two sequences s,s′∈S. If the sequences s,s′∈S of two EGTs overlap with less than 10 amino acids, their distance is estimated by the additive estimation as proposed by Landry et al. (28):
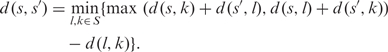 |
The main idea behind the additive estimation is that if for a given distance matrix d a tree T exists that represents d, i.e. such that the tree distance of any two nodes in T corresponds to their pairwise distance in d, then for any objects a,b,c,e represented in d the four-point-condition must hold:
Hence, missing values in d can be estimated with the additive estimation.
Measuring the accuracy
The classification accuracy of CARMA was evaluated on short DNA fragments with known taxonomic origins. By comparing the predicted taxa with the known taxa, the sensitivity, specificity, false negative rate, false positive rate and unknown rate were assessed as follows. For a taxonomic class i, let Pi be the total number of EGTs from i; TPi the number of EGTs that is correctly classified into i; FPi the number of EGTs that is erroneously assigned to i; FNi the number of EGTs from i that is misclassified into some class j ≠ i; and Ui the number of EGTs from i that is classified as unknown taxon. Note that Pi = TPi + FNi + Ui. The sensitivity measures the proportion of EGTs that is correctly classified. For a taxonomic group i, it is defined as Sni = TPi/Pi. The specificity measures the reliability of classifications and is defined as Spi = TPi/TPi + FPi. The false negative rate is defined as FNratei = FNi/Pi. It measures the proportion of EGTs from a taxonomic class i that is falsely assigned to any class j ≠ i. The unknown rate measures the proportion of EGTs that cannot be phylogenetically classified and is defined as Uratei = Ui/Pi. The false positive rate is the proportion of EGTs that is falsely assigned to a class i. It is defined as FPratei = FPi/∑j ≠ i Pj.
Measuring the accuracy on synthetic metagenome
In a first experiment, the accuracy of the complete algorithm was evaluated on a synthetic metagenome consisting of fragments from a wide range of taxonomic groups with average length of 100 bp. The taxonomic origin of fragments was predicted using our complete classification algorithm: first, EGTs (fragments of Pfam families) were identified in the 100 bp fragments and subsequently classified. Usually, a high fraction of reads in environmental samples stems from genomes that have not been sequenced yet. To account for this, all known Pfam members belonging to a species represented in the set of 77 complete genomes were excluded from the full multiple alignments. As a consequence, at the rank of genus a high fraction of EGTs could not be classified into their taxonomic group. In this experiment, the performance was therefore evaluated only up to the rank of order.
Measuring the accuracy for the phylogenetic classification of short EGTs
In a second experiment, the accuracy for the phylogenetic classification of EGTs was evaluated using a 10-fold cross-validation approach for all taxa represented in the Pfam database. As previously mentioned, each Pfam protein family is represented by a full multiple alignment of all known family members. During the cross-validation, all known members of each family were randomly partitioned into 10 subsamples. Each of the 10 subsamples were withdrawn from the full multiple alignment and classified as follows: from each withdrawn sequence, only 33 contiguous amino acids were randomly selected as artificial EGTs. These artificial EGTs were again added to the multiple alignment of the remaining nine subsamples. Based on the resulting multiple alignment, each artificial EGT was classified as described in the previous section ‘Phylogenetic Classification of Short EGTs’. The accuracy was separately evaluated at each taxonomic rank (superkingdom, phylum, class, order and genus).
In general, the accuracy of CARMA highly depends on the representation of taxonomic groups in the Pfam database. In the performance evaluation, the accuracy was separately evaluated for well represented (≥ 4000 Pfam members) and for poorly represented taxa (< 4000 Pfam members). Notably, some of the well-represented taxonomic groups are represented by only one sequenced organism.
Measuring the diversity
Traditionally, diversity and evenness are measured at the rank of species. Nonetheless, as quantitative species information is not available for the three aquatic environmental samples analyzed in this study, diversity and evenness of prokaryotes were measured at the rank of phylum, class, order and genus using Shannon's; diversity index (29) (also called Shannon–Wiener index). In the context of this work, for a taxonomic rank r, Shannon's; diversity index is defined as
where pi is the proportion of EGTs that is classified into the i-th taxonomic group of rank r. The species evenness can then be defined as
where Hmax is the total number of taxa found at rank r.
Phylogenetic analysis using 16S rDNA anchors
In a third experiment, the composition of the solar saltern, stromatolite and coral reef samples was characterized by using 16S rDNA fragments found in these samples as phylogenetic anchors. Fragments of 16S rDNA genes were detected in a BLAST search of all reads of each sample versus the rRNA database (release 9.54) of the Ribosomal Database Project (RDP) II (30). All subregions of reads having a significant BLAST hit (E-value cut-off of 10− 5) were phylogenetically classified using the RDP Classifier, a naive Bayesian rRNA classifier described by Wang and coworkers (31).
RESULTS
Accuracy for synthetic metagenome
In the first experiment, the complete algorithm—i.e. the detection of EGTs followed by their phylogenetic classification—was evaluated on a synthetic metagenome consisting of short DNA fragments from 77 complete genomes. To simulate pyrosequencing on a GS 20 system, fragments were randomly sampled from the complete genomes with length 80–120 bp and mean length of 100 bp; to account for sequencing errors produced by the 454 systems, artificial sequencing errors were introduced at homopolymers. The created synthetic metagenome represents a complex microbial community, with sequence fragments from both archaea and bacteria, 10 phyla, 11 classes, 29 orders and 62 genera.
An EGT was found in ≈15% of the ≈2.7 million fragments analyzed. In light of the short fragment length, a high classification accuracy was achieved (Figure 2). On average, the taxonomic origin was correctly predicted for 84% (superkingdom) to 61% (order) of identified EGTs. While the proportion of correctly classified EGTs decreases from superkingdom to order, the proportion of misclassified EGTs (false negative rate) is about 7% for all taxonomic ranks. Conversely, the proportion of EGTs that cannot be assigned to any taxonomic group (unknown rate) increases from 10% at rank of superkingdom to 31% at rank of order. For all taxonomic ranks, reliable predictions are obtained with an average specificity ranging from 90% to 97%. The false positive rate, i.e. the probability that an EGT is wrongly classified into a certain taxonomic group, depends on the representation of that group in the Pfam protein families database (Figure 3). For example, while for the well-represented proteobacteria and firmicutes the false positive rate was 3.8% and 0.6%, for the less represented euryarchaeota and crenarchaeota a false positive rate of 0.25% and 0.02% was obtained. The average false positive rate ranged from 2.5% for superkingdom to 0.1% for order, the highest measured false positive rate was 4.7% (for bacteria).
Figure 2.

Accuracy obtained for the taxonomic assignment of 80–120 bp long fragments from 77 complete genomes. The sensitivity (Sens), specificity (Spec), false negative rate (FNrate) and proportion of EGTs that could not be assigned to any taxonomic group (Urate) are shown as colored bars.
Figure 3.

False positive rate for the phylogenetic classification of 80–120 bp long fragments from 77 complete genomes. Shown is the proportion of EGTs misclassified into different taxonomic groups for four taxonomic ranks: superkingdom, phylum, class and order.
Accuracy for the phylogenetic classification of short EGTs
In the second experiment, the classification of short EGTs was extensively evaluated for a wide range of taxonomic categories, including DNA fragments from archaea, bacteria, eukaryotes and viruses. On the whole, EGTs could be accurately classified up to the rank of genus (Supplementary Figures 1 and 2). For well-represented classes (all four superkingdoms, 20 phyla, 27 classes, 59 orders and 69 genera), between 97% (superkingdom) and 68% (genus) of predicted taxa were correct (specificity). The average sensitivity ranged from 90% (superkingdom) to 40% (genus). Between 7% (superkingdom) and 44% (genus) of EGTs could not be assigned to any taxonomic group and hence were classified as unknown taxa.
The accuracy depends on how well a taxonomic class is represented in the Pfam database. The taxa of EGTs from poorly represented classes frequently cannot be inferred from the phylogenetic tree, in this case EGTs should be classified as unknown taxa. As expected, the average sensitivity for poorly represented classes considerably dropped (to 8–19%), while the unknown rate increased (to 34% at the rank of phylum and to 63% at the rank of genus). Also, for poorly represented classes reliable predictions were obtained, with an average specificity ranging from 84% to 65% over all taxonomic ranks. Notably, also taxonomic groups that were considered as well represented (≥ 4000 Pfam members) may be represented by only one sequenced organism. This is for example true for most of the well represented eukaryotic genera, which explains the low sensitivity of our algorithm for these groups.
The background noise that can be expected for each taxonomic group was measured by the false positive rate, i.e. the probability that an EGT is by chance falsely classified into that group. Also this experiment revealed that the false positive rate highly depends on the number of members representing the taxa in Pfam (Supplementary Figures 3 and 4). In summary, for well-represented taxonomic groups the average false positive rate ranged from 0.7% at the rank of superkingdom to 0.12% at genus. For poorly represented taxa, the average false positive rate was below 0.004% at all taxonomic ranks. Noteworthy, particularly in light of advances in sequencing technology, longer fragments of length 200 bp and 400 bp resulted in a slightly improved accuracy (sensitivity, specificity, false negative rate and unknown rate) (data not shown).
Comparative analysis of microbial communities from disparate aquatic environments
To identify taxonomic trends in microbial communities from disparate aquatic environments, the method presented herein was applied in a comparative analysis of three short-read metagenomes isolated from Kingman coral reefs, San Diego solar salterns and Rios Mesquites stromatolites. All three samples were sequenced with the GS 20 pyrosequencing system. For a high proportion of EGTs identified in the three samples, a taxonomic origin was predicted ranging from 75–92% (superkingdom) to 33–42% (genus) (Table 1). The phylogenetic characterization indicated a significant difference in the taxonomic composition of the samples (Figure 4). In contrast to the coral reef and stromatolite samples, where bacteria dominated (68% and 79% of EGTs), 49% of EGTs from the solar saltern sample were classified as archaea and only 20% as bacteria.
Table 1.
Taxonomic characterization of three metagenomes obtained by 454 pyrosequencing. The sample size (number of reads produced), the number of identified EGTs and the proportion of EGTs for which a taxonomic origin was predicted at different taxonomic ranks are shown
| Sample | Size | EGTs | Proportion of EGTs taxonomically assigned | ||||
|---|---|---|---|---|---|---|---|
| Superkingdom (%) | Phylum (%) | Class (%) | Order (%) | Genus (%) | |||
| Coral reef | 188.445 | 3.577 | 75 | 66 | 53 | 53 | 33 |
| Stromatolite | 124.694 | 7.414 | 92 | 77 | 72 | 70 | 37 |
| Solar saltern | 582.681 | 55.605 | 92 | 71 | 57 | 56 | 42 |
| Average | 86 | 68 | 61 | 60 | 37 | ||
Figure 4.

Taxonomic characterization of three environmental samples obtained by 454 pyrosequencing. Bars illustrate the proportion of EGTs classified into different taxonomic groups. pEGTs is the fraction of EGTs classified as bacteria or archaea.
For the prokaryotic fraction of EGTs (pEGTs), the coral reef sample obtained the highest predicted diversity and evenness (Table 2). While proteobacteria was the most abundant phylum (59% of pEGTs), a significant proportion of pEGTs was also assigned to actinobacteria (4% of pEGTs), bacteroidetes (4% of pEGTs), cyanobacteria (4% of pEGTs), firmicutes (4% of pEGTs) and planctomycetes (3% of pEGTs). At the rank of order and genus, the coral reef sample was highly diverse, with rhodobacterales (11% of pEGTs) being the most prevalent order and Silicibacter (5% of pEGTs) and Pirellula (3% of pEGTs) the most abundant genera.
Table 2.
Prokaryotic diversity (H′) and evenness (J) in three aquatic microbial samples at rank of phylum, class, order, and genus
| Phylum | Class | Order | Genus | |||||
|---|---|---|---|---|---|---|---|---|
| Sample | H′ | J | H′ | J | H′ | J | H′ | J |
| Coral reef | 1.2 | 0.46 | 1.7 | 0.55 | 3.9 | 0.81 | 4.2 | 0.83 |
| Stromatolite | 1.1 | 0.42 | 1.16 | 0.37 | 2.7 | 0.55 | 3.6 | 0.70 |
| Solar saltern | 0.8 | 0.31 | 1.0 | 0.32 | 1.4 | 0.28 | 2.6 | 0.45 |
The stromatolite sample had an intermediate predicted diversity and evenness for the prokaryotic fraction of EGTs (Table 2). At the rank of phylum, it was mainly dominated by cyanobacteria (57% of pEGTs). Additionally, a considerable fraction of pEGTs was classified as proteobacteria (15% of pEGTs) and firmicutes (4% of pEGTs). Nostocales (20% of pEGTs) and chroococcales (17% of pEGTs) were the most abundant orders.
According to our predictions, the solar saltern sample had the lowest prokaryotic diversity and evenness (Table 2). The majority of pEGTs was assigned to different halobacteria (58% of pEGTs), namely Natronomonas (14% of pEGTs), Haloarcula (12% of pEGTs), Halobacterium (8% of pEGTs) and Haloferax (1% of pEGTs). At the rank of phylum, euryarchaeota (69% of pEGTs) was the most prevalent group followed by proteobacteria (12% of pEGTs). The remaining phyla were only poorly represented (≤ 2% of pEGTs).
The results clearly revealed differences in the cyanobacterial composition between the coral reef and stromatolite environments (Figure 4). Synechococcus-like species were predicted to be the most prevalent cyanobacteria in the stromatolite sample (6% of pEGTs), but Prochlorococcus-like species were predicted to be the dominant cyanobacteria in the coral reef sample (2% of pEGTs). A large fraction of pEGTs from the stromatolite sample was assigned to diverse genera of the cyanobacteria group: Synechococcus (6%), Nostoc (5%), Crocosphaera (4%), Anabaena (4%), Gloeobacter (1%), Synechocystis (2%), Trichodesmium (2%) and Prochlorococcus (0.7%). In contrast, for the coral reef sample Prochlorococcus (2% of pEGTs), Synechococcus (0.2% of pEGTs) and Synechocystis (0.2% of pEGTs) were the only cyanobacteria with a considerable number of assigned pEGTs.
These findings reflected the environments where the samples were collected. Marine microbial communities have been reported as complex and diverse, with a high proportion of proteobacteria and a considerable number of cyanobacteria (Prochlorococcus and Synechococcus) (3). The stromatolites were formed by cyanobacteria (32). However, compared to some earlier studies of stromatolites (33), the proportion of cyanobacteria predicted in the Rios Mesquites stromatolite was remarkably high. On the other hand, the high proportion of different halobacteria found in the solar saltern sample reflected the stress condition caused by high-salt concentration, shaping the community composition of this habitat.
The amount of eukaryotic DNA in a sample highly influences the proportion of reads that can be phylogenetically classified. This can be explained by the high proportion of intergenic and hence non-coding regions in eukaryotic genomes. According to our predictions, the solar saltern sample has the lowest proportion of eukaryotic DNA (≈6% of EGTs, Figure 4) and the highest percentage of reads in which an EGT could be identified (≈10%). The stromatolite sample has a medium proportion of eukaryotic DNA (≈11%), and in ≈6% of its reads an EGT was found. The coral reef sample has the highest proportion of eukaryotic DNA (≈23%), but the lowest percentage of reads carrying an EGT (≈2%). On the other hand, the synthetic metagenome used in this study, containing DNA fragments from only bacteria and archaea, has a considerably higher proportion of reads carrying an EGT (≈15%), when compared to the three aquatic samples.
Notably, with the presented approach, only the diversity and evenness of those organisms that come from taxonomic groups represented in the Pfam database can be assessed. For example, if a large fraction of the organisms constituting a sample stem from genera that are not represented by Pfam, our approach may wrongly measure a low diversity on that taxonomic rank. However, for the three aquatic samples analyzed in this study, the two samples with the lowest measured diversity (the stromatolite and the solar saltern samples) have the highest proportion of ETGs that could be phylogenetically classified (Table 1), indicating that the predicted low diversity is not an artifact of the applied method. Since the number of represented taxonomic groups in Pfam continuously increases, our method will be able to provide a more comprehensive picture of the overall diversity of a sample in the future.
Comparison with 16S rDNA derived taxonomic characterization
As a standard of truth, the composition of the solar saltern, stromatolite and coral reef samples was characterized using 16S rDNA fragments as phylogenetic anchors. The obtained taxonomic profiles were in turn used to verify the results of the phylogenetic classification of Pfam protein family fragments presented in the previous section. In total, 151 fragments of 16S rDNA genes were identified in the solar saltern sample, nine in the stromatolite, and four in the coral reef sample. Owing to the low number of 16S rDNA fragments found, the composition of the stromatolite sample was only characterized up to the rank of phylum and the coral reef sample only on the rank of superkingdom. The solar saltern sample was characterized up to the rank of genus.
The phylogenetic classification of Pfam protein families and 16S rDNA fragments in general revealed similar compositional trends (Figure 4 and Supplementary Figure 5). Both approaches indicated that the solar saltern sample is dominated by archaea, while the stromatolite and coral reef samples are dominated by bacteria. For the solar saltern sample, at lower taxonomic ranks strikingly similar taxonomic profiles were obtained. According to both approaches, euryarchaeota, bacteroidetes and proteobacteria are the most abundant phyla; halobacteria, sphingobacteria and gammaproteobacteria the most common classes; and halobacteriales and sphingobacteriales the most prevalent orders. On rank of genus, both methods predicted that the solar saltern sample is dominated by different halophil archaea and by salinibacter. The stromatolite sample is dominated by cyanobacteria according to both approaches.
Despite the strikingly high consistency of the results produced by the two methods, some degree of variation can still be identified. For example, in the solar saltern sample salinibacter is predicted to be the most abundant genus by the 16S rDNA analysis, but as the fourth most abundant genus by our phylogenetic algorithm. The discrepancies found may be explained by the low number of 16S rDNA fragments identified in the solar saltern sample, thus providing only a rough picture of its taxonomic composition. A second possible explanation for the variation found may be the low classification accuracy of both methods at rank genus for 100 bp long fragments. For the classification of 100 bp fragments at rank genus, the RDP Classifier achieves an accuracy of 70% (31) and our algorithm has an average specificity of 68% for well represented and 72% for poorly represented taxonomic groups (Supplementary Figure 2). A third reason for the discrepancies found may be that the taxonomic profiles obtained by the classification of 16S rDNAs are affected by the different number of rRNA copies present in the genomes constituting a sample. In contrast, the profiles obtained by the phylogenetic classification of Pfam protein families characterize the composition of the entire gene content of a metagenome and hence are affected by variations in genome size. Overall, both methods predict similar taxonomic trends for the three aquatic environmental samples studied, but the phylogenetic classification of fragments from Pfam protein families provides a considerably deeper and more detailed picture of the taxonomic groups present in the samples.
CONCLUSION
The novel software CARMA was developed for predicting the taxonomic origins of short environmental DNA fragments. In the first phase, domain and protein family fragments (EGTs) are identified in the unassembled reads of a sample using Pfam profile hidden Markov models. In the second phase, a phylogenetic tree (family tree) is reconstructed for each matching Pfam family. EGTs are phylogenetically classified based on their location in the respective family tree. With this strategy, families that are not suited to infer phylogenies, such as rapidly evolving families or families with members that are frequently inherited by horizontal gene transfer, are implicitly identified. Trees reconstructed from these families have ‘mixed subtrees’ with members from various different taxa. In this case, the contained EGTs are classified as ‘unknown taxa’.
The results shown in this study clearly demonstrate that short fragments of Pfam domain and protein families are well suited as phylogenetic markers for inferring the taxonomic affiliations of short environmental DNA fragments. In comparison to methods that rely on only a few marker genes, such as 16S rDNA or recA genes, the use of all Pfam families provides a deeper picture into the taxonomic composition of environmental microbial samples. In this work, the comparative study of three aquatic microbial communities illustrates how the predicted taxonomic profiles yield detailed insights into the taxonomic composition of environmental samples sequenced with 454 pyrosequencing technique. In combination with 454 pyrosequencing, our method allows to rapidly and cost-effectively assay microbial communities.
SUPPLEMENTARY DATA
Supplementary data are available at NAR Online.
ACKNOWLEDGEMENTS
L.K. was supported by the DFG Graduiertenkolleg 635 Bioinformatik, by the International NRW Graduate School in Bioinformatics and Genome Research and by the Federal Ministry of Education and Research (BMBF) project 0313805A. Parts of this work were conducted during a research visit of L.K. at Rob Edwards' and Forest Rohwer's; groups, San Diego State University, CA. A.G. acknowledges the BMBF for financial support. N.N.D. was supported by the German Academic Exchange Service (DAAD). We thank Christelle Desnues, Elizabeth Dinsdale and Beltran Rodriguez-Brito for sharing data prior to publication. We would also like to acknowledge Eric R. Alegre for his help developing the original tree-parsing algorithm and Björn Fischer, Achim Neumann, Ralf Nolte, Volker Tölle and Torsten Kasch for their support on running our software at the Center for Biotechnology. The authors would also like to thank the anonymous reviewers for their valuable comments. Funding to pay the Open Access publication charges was provided by the DFG Graduiertenkolleg 635 Bioinformatik and by the Institute for Bioinformatics (IfB), Center for Biotechnology.
Conflict of interest statement. None declared.
REFERENCES
- 1.Breitbart M, Salamon P, Andresen B, Mahaffy JM, Segall AM, Mead D, Azam F, Rohwer F. Genomic analysis of uncultured marine viral communities. Proc. Natl. Acad. Sci. USA. 2002;99:14250–14255. doi: 10.1073/pnas.202488399. [DOI] [PMC free article] [PubMed] [Google Scholar]
- 2.Tyson GW, Chapman J, Hugenholtz P, Allen EE, Ram RJ, Richardson PM, Solovyev VV, Rubin EM, Rokhsar DS, Banfield JF. Community structure and metabolism through reconstruction of microbial genomes from the environment. Nature. 2004;428:37–43. doi: 10.1038/nature02340. [DOI] [PubMed] [Google Scholar]
- 3.Venter JC, Remington K, Heidelberg JF, Halpern AL, Rusch D, Eisen J, Wu D, Paulsen I, Nelson KE, Nelson W, et al. Environmental genome shotgun sequencing of the Sargasso Sea. Science. 2004;304:66–74. doi: 10.1126/science.1093857. [DOI] [PubMed] [Google Scholar]
- 4.Béjà O, Aravind L, Koonin EV, Suzuki MT, Hadd A, Nguyen LP, Jovanovich SB, Gates CM, Feldman RA, Spudich J, et al. Bacterial rhodopsin: evidence for a new type of phototrophy in the sea. Science. 2000;289:1902–1906. doi: 10.1126/science.289.5486.1902. [DOI] [PubMed] [Google Scholar]
- 5.Gill SR, Pop M, Deboy RT, Eckburg PB, Turnbaugh PJ, Samuel BS, Gordon JI, Relman DA, Fraser-Liggett CM, Nelson KE. Metagenomic analysis of the human distal gut microbiome. Science. 2006;312:1355–1359. doi: 10.1126/science.1124234. [DOI] [PMC free article] [PubMed] [Google Scholar]
- 6.Hansen SK, Rainey PB, Haagensen JAJ, Molin S. Evolution of species interactions in a biofilm community. Nature. 2007;445:533–536. doi: 10.1038/nature05514. [DOI] [PubMed] [Google Scholar]
- 7.Martín HG, Ivanova N, Kunin V, Warnecke F, Barry KW, McHardy AC, Yeates C, He S, Salamov AA, et al. Metagenomic analysis of two enhanced biological phosphorus removal (EBPR) sludge communities. Nat. Biotechnol. 2006;24:1263–1269. doi: 10.1038/nbt1247. [DOI] [PubMed] [Google Scholar]
- 8.Hugenholtz P. Exploring prokaryotic diversity in the genomic era. Genome Biol. 2002;3 doi: 10.1186/gb-2002-3-2-reviews0003. REVIEWS0003. [DOI] [PMC free article] [PubMed] [Google Scholar]
- 9.Hugenholtz P, Goebel BM, Pace NR. Impact of culture-independent studies on the emerging phylogenetic view of bacterial diversity. J. Bacteriol. 1998;180:4765–4774. doi: 10.1128/jb.180.18.4765-4774.1998. [DOI] [PMC free article] [PubMed] [Google Scholar]
- 10.Rappé MS, Giovannoni SJ. The uncultured microbial majority. Annu. Rev. Microbiol. 2003;57:369–394. doi: 10.1146/annurev.micro.57.030502.090759. [DOI] [PubMed] [Google Scholar]
- 11.Margulies M, Egholm M, Altman WE, Attiya S, Bader JS, Bemben LA, Berka J, Braverman MS, Chen Y-J, et al. Genome sequencing in microfabricated high-density picolitre reactors. Nature. 2005;437:376–380. doi: 10.1038/nature03959. [DOI] [PMC free article] [PubMed] [Google Scholar]
- 12.Edwards RA, Rodriguez-Brito B, Wegley L, Haynes M, Breitbart M, Peterson D, Saar M, Alexander S, Alexander EC, Rohwer F. Using pyrosequencing to shed light on deep mine microbial ecology under extreme hydrogeologic conditions. BMC Genomics. 2006;7:57. doi: 10.1186/1471-2164-7-57. [DOI] [PMC free article] [PubMed] [Google Scholar]
- 13.Turnbaugh PJ, Ley RE, Mahowald MA, Magrini V, Mardis ER, Gordon JI. An obesity-associated gut microbiome with increased capacity for energy harvest. Nature. 2006;444:1027–1031. doi: 10.1038/nature05414. [DOI] [PubMed] [Google Scholar]
- 14.Woese CR. Bacterial evolution. Microbiol. Rev. 1987;51:221–271. doi: 10.1128/mr.51.2.221-271.1987. [DOI] [PMC free article] [PubMed] [Google Scholar]
- 15.Woese CR, Fox GE. Phylogenetic structure of the prokaryotic domain: the primary kingdoms. Proc. Natl. Acad. Sci. USA. 1977;74:5088–5090. doi: 10.1073/pnas.74.11.5088. [DOI] [PMC free article] [PubMed] [Google Scholar]
- 16.Tringe SG, Rubin EM. Metagenomics: DNA sequencing of environmental samples. Nat. Rev. Genet. 2005;6:805–814. doi: 10.1038/nrg1709. [DOI] [PubMed] [Google Scholar]
- 17.McHardy AC, Martín HG, Tsirigos A, Hugenholtz P, Rigoutsos I. Accurate phylogenetic classification of variable-length DNA fragments. Nat. Methods. 2007;4:63–72. doi: 10.1038/nmeth976. [DOI] [PubMed] [Google Scholar]
- 18.Teeling H, Meyerdierks A, Bauer M, Amann R, Glöckner FO. Application of tetranucleotide frequencies for the assignment of genomic fragments. Environ. Microbiol. 2004;6:938–947. doi: 10.1111/j.1462-2920.2004.00624.x. [DOI] [PubMed] [Google Scholar]
- 19.Koski LB, Golding GB. The closest BLAST hit is often not the nearest neighbor. J. Mol. Evol. 2001;52:540–542. doi: 10.1007/s002390010184. [DOI] [PubMed] [Google Scholar]
- 20.Huson DH, Auch AF, Qi J, Schuster SC. MEGAN analysis of metagenomic data. Genome Res. 2007;17:377–386. doi: 10.1101/gr.5969107. [DOI] [PMC free article] [PubMed] [Google Scholar]
- 21.Finn RD, Mistry J, Schuster-Böckler B, Griffiths-Jones S, Hollich V, Lassmann T, Moxon S, Marshall M, Khanna A, et al. Pfam: clans, web tools and services. Nucleic Acids Res. 2006;34:D247–D251. doi: 10.1093/nar/gkj149. [DOI] [PMC free article] [PubMed] [Google Scholar]
- 22.Benson DA, Karsch-Mizrachi I, Lipman DJ, Ostell J, Wheeler DL. GenBank. Nucleic Acids Res. 2007;35:D21–D25. doi: 10.1093/nar/gkl986. [DOI] [PMC free article] [PubMed] [Google Scholar]
- 23.Wheeler DL, Barrett T, Benson DA, Bryant SH, Canese K, Chetvernin V, Church DM, DiCuccio M, Edgar R, et al. Database resources of the National Center for Biotechnology Information. Nucleic Acids Res. 35:D5–12. doi: 10.1093/nar/gkl1031. [DOI] [PMC free article] [PubMed] [Google Scholar]
- 24.Altschul SF, Gish W, Miller W, Myers EW, Lipman DJ. Basic local alignment search tool. J. Mol. Biol. 1990;215:403–410. doi: 10.1016/S0022-2836(05)80360-2. [DOI] [PubMed] [Google Scholar]
- 25.Eddy SR. Profile hidden Markov models. Bioinformatics. 1998;14:755–763. doi: 10.1093/bioinformatics/14.9.755. [DOI] [PubMed] [Google Scholar]
- 26.Felsenstein J. Phylip: phylogeny inference package (version 3.2) Cladistics. 1989;5:164–166. [Google Scholar]
- 27.Nguyen TX, Alegre ER, Kelley ST. Phylogenetic analysis of general bacterial porins: a phylogenomic case study. J. Mol. Microbiol. Biotechnol. 2006;11:291–301. doi: 10.1159/000095631. [DOI] [PubMed] [Google Scholar]
- 28.Landry P-A, Lapointe F-J, Kirsch JAW. Estimating phylogenies from lacunose distance matrices: additive is superior to ultrametric estimation. Mol. Biol. Evol. 1996;13:818–823. [Google Scholar]
- 29.Shannon CE, Weaver W. The Mathematical Theory of Communication. Urbana, IL: Urbana, University of Illinois Press; 1963. [Google Scholar]
- 30.Cole JR, Chai B, Farris RJ, Wang Q, Kulam-Syed-Mohideen AS, McGarrell DM, Bandela AM, Cardenas E, Garrity GM, Tiedje JM. The ribosomal database project (RDP-II): introducing myRDP space and quality controlled public data. Nucleic Acids Res. 2007;35:D169–D172. doi: 10.1093/nar/gkl889. [DOI] [PMC free article] [PubMed] [Google Scholar]
- 31.Wang Q, Garrity GM, Tiedje JM, Cole JR. Naive Bayesian classifier for rapid assignment of rRNA sequences into the new bacterial taxonomy. Appl. Environ. Microbiol. 2007;73:5261–5267. doi: 10.1128/AEM.00062-07. [DOI] [PMC free article] [PubMed] [Google Scholar]
- 32.Allwood AC, Walter MR, Kamber BS, Marshall CP, Burch IW. Stromatolite reef from the Early Archaean era of Australia. Nature. 2006;441:714–718. doi: 10.1038/nature04764. [DOI] [PubMed] [Google Scholar]
- 33.Papineau D, Walker JJ, Mojzsis SJ, Pace NR. Composition and structure of microbial communities from stromatolites of Hamelin Pool in Shark Bay, Western Australia. Appl. Environ. Microbiol. 2005;71:4822–4832. doi: 10.1128/AEM.71.8.4822-4832.2005. [DOI] [PMC free article] [PubMed] [Google Scholar]