

Abstract
Centrosomes and their associated microtubules direct events during mitosis and control the organization of animal cell structures and movement during interphase. The centrosome replicates during the cell cycle, directs the assembly of bipolar mitotic spindles, and plays an important role in maintaining the fidelity of cell division. Recently, tumor suppressors such as p53 and retinoblastoma protein pRB have been localized to the centrosome in a cell cycle-dependent manner. Immunofluorescence microscopy and analysis of isolated centrosomes now provide evidence that BRCA1 protein, a suppressor of tumorigenesis in breast and ovary, also is associated with centrosomes during mitosis. Our results indicate that BRCA1 localizes with the centrosome during mitosis and coimmunoprecipitates with γ-tubulin, a centrosomal component essential for nucleation of microtubules. Furthermore, γ-tubulin associates preferentially with a hypophosphorylated form of BRCA1.
Breast cancer affects one in eight women in the Western world, with genetic predisposition caused by BRCA1 accounting for/3% of breast cancer cases. This gene is also responsible for a familial predisposition to ovarian cancer. Most of the mutations that have been identified in these families are frame-shift, nonsense, or splice-site alterations, that generate truncated BRCA1 protein (1–3).
BRCA1 encodes a protein of 1,863 amino acids (≈220-kDa). The presence of an N-terminal zinc-ring domain and a C-terminal transactivation domain suggest that BRCA1 might be a transcription factor (4). Indeed, BRCA1 contains two putative nuclear localization signals (5), and its C-terminal domain shows transcription-activation activity when fused to the GAL4 DNA-binding domain (6, 7). BRCA1 protein is a component of the RNA polymerase II complex (8), and coactivates p53-mediated transcription (9). As BRCA1 also forms a complex with rad51 in mitotic and meiotic chromosomes, it may be involved in DNA repair and the maintenance of genomic integrity (10). Knockout experiments in mice have revealed that BRCA1 might be required for cell proliferation, because homozygous BRCA1 knockout mice die at an early stage of embryogenesis (11, 12).
BRCA1 protein is localized mainly in the nucleus (13). It is expressed and phosphorylated in a cell cycle-dependent fashion (14, 15); the mRNA increases at G1/S, remains high through S and G2/M, and decreases in G1. Some investigators have reported that protein and mRNA levels rise and fall in parallel during progression of the cell cycle (16, 17), but others have seen no obvious changes in protein concentration (18). BRCA1 is phosphorylated in S and M phases (14, 15, 19) and after DNA damage (19, 20). However, when MCF-7 cells are arrested in G2/M by colchicine, most of their BRCA1 protein is hypophosphorylated (19).
The centrosome controls assembly of microtubules, a process that plays a central role in organizing cell structure, determining cell polarity, directing cell movement during interphase, and orchestrating formation of the bipolar spindle during mitosis (21). In mammalian cells the centrosome is comprised of a pair of centrioles (short cylinders constructed from nine triplet microtubules consisting of α/β tubulin dimers) and amorphous pericentriolar material. The centrosome normally duplicates once during each cell cycle starting at the G1/S transition; duplication usually is completed by G2. As mitosis begins, the two centrosomes separate to organize the bipolar mitotic spindle. The centrosome contains hundreds of proteins, some of which have been identified, e.g., γ-tubulin (22, 23) and pericentrin (24). Both are components of pericentriolar material. γ-Tubulin is associated with the minus-end of microtubules and is responsible for their nucleation (25).
An increasing number of proteins that regulate the cell cycle, especially those that control G2/M progression, have been localized to the centrosome; cyclin A, cyclin B (26), p34cdc2 (27, 28), and 14-3-3 (29) are examples. Brown et al. (30) reported that the p53 tumor suppressor also is associated with the centrosome in interphase cells; moreover, p53−/− mouse embryonic fibroblasts show a high frequency of abnormal mitoses with amplified centrosomes (31). pRB is also present in mitotic spindles and centrosomes during mitosis (32), but deficiency of pRB does not affect centrosome duplication (31).
Here we report that BRCA1 protein is associated with centrosomes during mitosis, on the basis of immunofluorescence staining of whole cells and biochemical analysis of isolated centrosomes. We also show that BRCA1 interacts with γ-tubulin, a key structural component of the centrosome. We suggest that BRCA1 may interact with other centrosome components to help control appropriate assembly of mitotic spindles and regulate G2/M progression, or to modify the BRCA1 protein itself to prepare for the next cell cycle. BRCA1 protein also may associate with the centrosomes to ensure appropriate distribution to the two daughter cells.
MATERIALS AND METHODS
Cell Culture and Transfection.
COS-7 (simian virus 40-transformed monkey kidney) and 293 (adenovirus-transformed human kidney) cells were cultured in low-glucose DMEM supplemented with 10% fetal bovine serum. An immortalized human mammary epithelial cell line, 184A1, was maintained in MCDB170 medium (33). MCF7 cells were grown in MEM supplemented with nonessential amino acids, sodium pyruvate, and 10% fetal bovine serum. A primary normal human mammary epithelial cell strain, BE46, and its derivative (E6/BE46) immortalized by the E6 oncogene of HPV16, were cultured in CDM3 medium (34).
Immunofluorescence Microscopy.
Cells were grown to exponential phase in glass chamber slides and fixed in 2% neutral paraformaldehyde in PBS for 30 min on ice, then permeabilized in 0.2% Triton X-100 in Tris-buffered saline (TBS) (10 mM Tris, pH 7.5/150 mM NaCl/1 mM KCl) for 10 min at room temperature or fixed in cold methanol for 5 min. All antibodies were diluted in TBS with 0.1% Triton X-100, 1% BSA, and 3% goat serum. Incubation with primary antibody was carried out for 1 h at room temperature. After three washes with TBS, incubation with secondary antibody was carried out for 30 min at room temperature, followed by staining of DNA with 4′,6′-diamidino-2-phenylindole (DAPI) for 5–10 min. Slides were mounted with Antifade (Molecular Probes) after three washes in TBS, and examined with a fluorescence microscope (Zeiss) under the 100× objective. Color slides were taken using Kodak Ektachrome 400 film. Primary antibodies for these experiments included BRCA1 MS110 (1:100 dilution, mouse IgG1, Calbiochem Ab-1); BRCA1 C-20 (1:100, rabbit polyclonal IgG, Santa Cruz Biotechnology); γ-tubulin GTU-88 (1:2000, mouse IgG1, Sigma); α-tubulin DM1A (1:1000, mouse IgG1, ICN); and pericentrin 4B (1:500, rabbit polyclonal, a gift from S. Doxsey, University of Massachusetts Medical Center). Secondary antibodies included affinity-purified and human serum-adsorbed fluorescein isothiocyanate-conjugated goat anti-mouse IgG (Southern Biotechnology Associates) and Texas Red-conjugated AffiniPure goat anti-rabbit IgG (Accurate Scientific, Westbury, NY). Secondary antibodies were used at final dilutions of 1:200 to 1:400.
Centrosome Isolation and Western Analysis.
Isolation of centrosomes was based on a method developed by Moudjou and Bornens (35). Exponentially growing COS-7 or MCF7 cells were incubated with culture medium containing 1 μg/ml cytochalasin D and 0.2 μM nocodazole for 1 h at 37°C, to depolymerize actin and microtubule filaments. Cells then were harvested by trypsinization and lysed in a solution of 1 mM Hepes (pH 7.2), 0.5% Nonidet P-40, 0.5 mM MgCl2, 0.1% 2-mercaptoethanol with proteinase inhibitors (EDTA-free proteinase inhibitor cocktail, Boehringer Mannheim) and phosphatase inhibitors (50 mM sodium fluoride, 1 mM sodium orthovanadate). Swollen nuclei and chromatin aggregates were removed by centrifugation at 2,500 × g for 10 min, and the supernatant was filtered through a 50-μm nylon mesh. Hepes was adjusted to 10 mM, DNase I (Boehringer Mannheim) was added to 2 units/ml, and the mixture was incubated for 30 min on ice. The lysate then was underlaid with 60% sucrose solution (60% wt/wt sucrose in 10 mM Pipes, pH 7.2/0.1% Triton X-100/0.1% 2-mercaptoethanol). Centrosomes were sedimented into the sucrose cushion by centrifugation at 10,000 × g for 30 min. This crude centrosome preparation was purified further by discontinuous sucrose gradient centrifugation at 120,000 × g for 1 h. Usually 1–3 × 10⁷ cells were lysed in 5 ml of lysis buffer, and the cushion consisted of 0.5 ml of 60% sucrose. After centrifugation, 1.5 ml from the bottom layer was resuspended and loaded onto a discontinuous gradient consisting of 500 μl of 70%, 300 μl of 50%, and 300 μl of 40% sucrose solutions. Fractions were collected from the bottom, 200 μl per fraction, from fractions 1-7; the remaining solution (≈1 ml) was collected as fraction 8. Each fraction was diluted in 1 ml of 10 mM Pipes buffer, pH 7.2. Centrosomes were recovered by centrifugation at 15,000 rpm for 10 min in a microfuge and denatured in SDS sample buffer (62.5 mM Tris, pH 6.8/10% glycerol/2% SDS/1.4% 2-mercaptoethanol/0.001% bromophenol blue). Whole-cell lysates were prepared by sonicating cells briefly in a modified RIPA buffer (50 mM Tris, pH 8.0/150 mM NaCl/0.1% SDS/0.1% sodium deoxycholate/1% Nonidet P-40) with proteinase and phosphatase inhibitors, followed by centrifugation at 13,000 rpm for 10 min in a microfuge to remove cell debris, and denatured in SDS sample buffer. Proteins were separated by SDS/4–15% polyacrylamide gels and transferred to nitrocellulose membranes. Membranes were blocked in 100 mM Tris (pH 7.5) 150 mM NaCl, 0.1% Tween 20 (TBST) with 2% dry milk for 30 min at room temperature. Primary and secondary antibody hybridizations were carried out in TBST with 2% dry milk for 30–60 min; membranes were washed in TBST. Signals were detected by using enhanced chemiluminescence (Amersham or Pierce). Primary antibodies for these experiments included (i) BRCA1 MS110 (mouse IgG1, 1:5 dilution, a gift from R. Scully, Dana-Farber Cancer Institute, or 1:50 dilution, Calbiochem Ab-1); (ii) BRCA1 MS13 (1:50, mouse IgG1, Calbiochem Ab-2); (iii) BRCA1 D-20 (1:50, rabbit polyclonal IgG, Santa Cruz Biotechnology); (iv) γ-tubulin GTU-88 (1:10,000, mouse IgG1, Sigma); (v) α-tubulin DM1A (1:250, mouse IgG1, ICN); (vi) cyclin B (1:1000, mouse IgG1, Transduction Laboratories, Lexington, KY); (vii) p34cdc2 (1:1000, mouse IgG1, Transduction Laboratories); and (viii) lamin X67 and X233 (1:40, mouse IgG1, American Research, Beltsville, MD). The secondary antibody was horseradish peroxidase-conjugated goat anti-mouse or anti-rabbit (Pierce).
Flow Cytometry.
Cells were trypsinized and resuspended in ice-cold PBS (devoid of magnesium and calcium ions) at a density of 1–2 × 10⁶/ml, fixed by adding 2 ml ice-cold methanol per ml of cells in PBS with vortexing, and incubated at least 30 min on ice. Cells were collected by centrifugation at 1,000 × g, resuspended in a solution containing 0.5 ml of propidium iodide and 0.5 ml of ribonuclease A (200 units/ml), and incubated at least 30 min at room temperature before analysis by flow cytometry.
Immunoprecipitation.
Cells were lysed in PBS with 0.1% Nonidet P-40, 0.1% Triton X-100, protease inhibitors (20 μg/ml aprotinin/10 μg/ml leupeptin/1 mM phenylmethylsulfonyl fluoride/1 μg/ml pepstatin A) and phosphatase inhibitors (50 mM sodium fluoride, 1 mM sodium orthovanadate), and sonicated briefly. Lysates cleared by centrifugation at 13,000 rpm for 15 min were incubated with 3 μg of BRCA1 C-20 with or without 20 μg of C-20 peptide; or incubated with 7–14 μg of γ-tubulin antibody for 30 min on ice. Either protein A-Sepharose or protein G-agarose (Sigma) was added and the incubation was continued for 1–2 h at 4°C. Samples were washed four times with the lysis buffer, denatured in SDS sample buffer, fractionated on SDS/6% or 4–12% polyacrylamide gels, and blotted to nitrocellulose membranes. Western hybridization was performed as described above. MS110 was used to detect immunoprecipitated BRCA1; γ-tubulin was detected by the same antibody used for immunoprecipitation. In vitro transcription and translation of full-length BRCA1 were carried out by using a kit from Promega and BRCA1 cDNA in pCR-Script (a gift from Jeff Holt, Vanderbilt University) as template.
RESULTS
BRCA1 Is Localized to the Centrosome During Mitosis.
Two BRCA1-specific antibodies were used for these studies: MS110, a mouse mAb raised against a BRCA1-GST fusion protein containing amino acids 1–304 of human BRCA1 protein (13), and C-20, a rabbit polyclonal antibody raised against a peptide corresponding to amino acids 1843–1862 of human BRCA1. Immunofluorescence staining of a population of replicating COS-7 cells revealed the usual dot pattern in the nucleus. However, a unique staining pattern reminiscent of centrosomes was observed in mitotic cells (Figs. 1–3).
Figure 1.

Coimmunostaining of COS-7 cells with mouse monoclonal γ-tubulin antibody and rabbit polyclonal BRCA1 antibody C-20. (A) A prometaphase to metaphase cell; (B) an early anaphase cell, and (C) a late anaphase cell. The colocalized signals of BRCA1 and γ-tubulin are yellow. DAPI counterstained DNA. Arrows indicate the positions of centrosomes.
Figure 3.

BRCA1 protein is detected in centrosome fractions purified by a discontinuous sucrose gradient. (A) COS-7 cells (≈1 × 10⁷) were harvested in exponential growth phase. The proteins in each sucrose gradient fraction were separated by 4–15% gradient SDS/PAGE and subjected to Western blot analysis. (B) Approximately 5 × 10⁶ of control COS-7 cells (cell cycle distribution: G0/G1, 37.21%; S, 45.15%; G2/M, 17.64%; CV, 6.25%) and cells arrested in G2/M by sequential treatment with thymidine and nocodazole (G0/G1, 5.51%; S, 36.60%; G2/M, 57.89%; CV, 8.69%) were used for centrosome preparations. Western blot analyses of fractions 1–3 of each sample are shown here. Whole-cell lysates were prepared from ≈2 × 10⁵ cells. MS110 was used to detect BRCA1.
To confirm the localization of BRCA1 protein at mitotic centrosomes, we conducted a series of double-staining experiments using C-20 and MS110 for BRCA1 staining, γ-tubulin and pericentrin antibodies for centrosome staining, and α-tubulin antibody for microtubule staining. In addition, DAPI staining of DNA was used to locate the nucleus. Double-staining of COS-7 cells with γ-tubulin antibody and BRCA1 C-20 antibody provided direct evidence for the presence of BRCA1 protein at mitotic centrosomes. Two-color (BRCA1+γ-tubulin) or three-color (BRCA1+γ-tubulin+DAPI) composite images showed colocalization of the BRCA1 and γ-tubulin signals at mitotic centrosomes (Fig. 1). The concentration of BRCA1 signal at mitotic centrosomes was apparent from prometaphase to metaphase (Fig. 1A) and early anaphase (Fig. 1B). As with γ-tubulin (Fig. 1) (23), BRCA1 staining diminished at the centrosome as cells proceeded to late anaphase (Fig. 1C) and telophase (data not shown). Results were similar when COS-7 cells were costained with MS110 (Fig. 2a) and pericentrin antibody (Fig. 2b). Both BRCA1 MS110 (Fig. 2d) and C-20 (Fig. 2e) stained mitotic centrosomes. In contrast, interphase cells had one or two centrosomes juxtaposed to the nucleus (Fig. 2g) and exhibited only nuclear dot staining pattern of BRCA1 (Fig. 2h), with no overlap between the nuclear BRCA1 dots and the interphase centrosomes (Fig. 2g–i). The same staining results were obtained whether the fixative was neutral paraformaldehyde or methanol. Control experiments using normal mouse IgG and rabbit IgG to replace primary antibodies or using C-20 peptide to block C-20 antibody did not show staining of the centrosome (data not shown).
Figure 2.
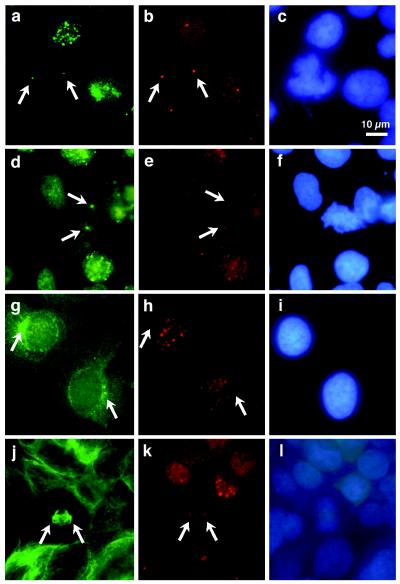
Immunostaining of COS-7 and E6/BE46 cells. Cells were costained with mouse monoclonal BRCA1 antibody MS110 (a) and rabbit polyclonal pericentrin antibody 4B (b); with MS110 (d) and rabbit polyclonal BRCA1 antibody C-20 (e); with mouse monoclonal γ-tubulin antibody (g) and C-20 (h); or with mouse monoclonal α-tubulin antibody (j) and C-20 (k). c, f, i, and l include DAPI counterstain of DNA. a–f highlight mitotic COS-7 cells; g–i are interphase COS-7 cells; j–l illustrate a mitotic E6/BE46 cell. Arrows indicate the positions of centrosomes.
BRCA1 was also present at mitotic centrosomes of human breast epithelial cells (BE46, E6/BE46, and 184A1), 293 cells, and breast cancer MCF7 cells. An example of E6/BE46 costained with α-tubulin antibody and BRCA1 C-20 is seen in Fig. 2j–l and shows the BRCA1 signal concentrated at the spindle poles.
220-kDa BRCA1 Protein Is Present in Isolated Centrosomes.
Centrosomes were isolated from COS-7 and MCF7 cells by discontinuous sucrose gradient fractionation (35) and subjected to SDS/PAGE and Western analysis. The cells were harvested for these procedures after brief treatment with nocodazole and cytochalasin D to disrupt microtubules and the actin cytoskeleton. Fractions enriched for centrosomes were indicated by the presence of γ-tubulin.
BRCA1 protein was detected by Western hybridization with the MS110 antibody. As shown in Fig. 3A, the distribution of 220-kDa BRCA1 protein among the fractions parallels the distribution of γ-tubulin; the BRCA1 and γ-tubulin protein signals were strongest in fractions 2 and 3, corresponding to 55 ≈ 60% wt/wt sucrose. Because of variation of the sucrose gradient, the strongest signal sometimes concentrated only in one fraction as in Fig. 3B control. However, only a small portion of the total BRCA1 protein was present in the centrosome fractions. To eliminate the possibility of contamination with interphase nuclei that have abundant BRCA1 protein, the same blot was probed with lamin antibodies. We detected no lamins in the centrosome fractions (Fig. 3A). Results were the same with MCF7 cells (data not shown). These biochemical data confirmed the presence of 220-kDa BRCA1 protein at the centrosome.
BRCA1 Protein Is Enriched in Centrosomes Isolated from Cells Arrested in G2/M.
Levels of BRCA1 protein in centrosome fractions from exponentially growing COS-7 cells were compared with their counterparts from cells arrested in G2/M. Cells were incubated with 2 μM thymidine for 10–12 h and then with 1 μM nocodazole for 12–14 h at 37°C (36). Flow cytometric analysis indicated that the G2/M population was enriched 3–4-fold by this treatment (Fig. 3B). Centrosome preparations from equal numbers of control and mitosis-arrested cells were subjected to Western analysis. Two components of the mitotic cyclin-dependent kinase, cyclin B and p34cdc2, were used as controls; both of these proteins accumulate at the centrosome in a cell cycle-dependent manner (26, 27). γ-Tubulin served as the indicator for centrosome fractions. Cyclin B, p34cdc2, γ-tubulin, and BRCA1 were each enriched in the centrosome fractions from COS-7 cells arrested in G2/M; the level of BRCA1 protein in these centrosomes was 3–4 times the amount seen in control cells (Fig. 3B). No lamin was detected in the centrosome fractions.
Association Between γ-tubulin and BRCA1.
The association between BRCA1 and the mitotic centrosome was further confirmed by coimmunoprecipitation of BRCA1 and γ-tubulin protein. Western blot analysis demonstrated that both were present in the immunoprecipitate generated from COS-7 cells by BRCA1 C-20 antibody. MS110 was used to detect the BRCA1 and γ-tubulin antibody for γ-tubulin (Fig. 4, lane 2). α-Tubulin was not immunoprecipitated by C-20 (data not shown). No BRCA1 or γ-tubulin proteins were detected using rabbit IgG, the negative control (Fig. 4, lane 1). When C-20 peptide was added to block the C-20 antibody, neither BRCA1 nor γ-tubulin was immunoprecipitated (data not shown). Reciprocally, monoclonal γ-tubulin antibody, but not mouse IgG, also brought down BRCA1 protein (Fig. 4, lanes 3 and 4). These results indicate that a specific, but perhaps not direct, interaction between γ-tubulin and BRCA1 does occur.
Figure 4.

Coimmunoprecipitation of BRCA1 and γ-tubulin. Immunoprecipitation was performed by using rabbit polyclonal BRCA1 antibody C-20 (lane 2) or mouse monoclonal γ-tubulin antibody (lane 4), from 400 μg of COS-7 cell lysate. Normal rabbit IgG (lane 1) and mouse IgG (lane 3) were negative controls. Samples were separated by SDS/6% polyacrylamide gels and immunoblotted by BRCA1 MS110 and γ-tubulin antibody.
The phosphorylation status of BRCA1 varies during the cell cycle. This phosphoprotein migrates as a ≈220-kDa doublet upon SDS/6% polyacrylamide gels (13). The more slowly migrating band that corresponds to the hyperphosphorylated isoform of BRCA1 is predominant in S phase (14, 15, 19). A more rapidly migrating band represents the hypophosphorylated isoform (13, 20). In our experiments, BRCA1 immunoprecipitated by γ-tubulin antibody appears to migrate slightly faster than BRCA1 immunoprecipitated by C-20 from whole- cell lysates (Fig. 4). To test whether BRCA1 is hypophosphorylated when associated with γ-tubulin, we resolved immunoprecipitated samples on an SDS/4–12% polyacrylamide gel with longer separation times to better resolve high-molecular-weight proteins. As shown in Fig. 5, the BRCA1 protein immunoprecipitated by γ-tubulin antibody (lane 4), or present in isolated centrosomes (lane 1), corresponded to the hypophosphorylated form, which comigrates with in vitro-translated BRCA1 (lanes 2 and 3). The majority of BRCA1 protein immunoprecipitated by C-20 migrated more slowly (Fig. 5, lane 5); however, the hypophosphorylated BRCA1 band was visible after longer exposure (data not shown). To exclude the possibility that the BRCA1 associated with the centrosome might not be a full-length protein, the blot containing lanes 1–2 was hybridized with D-20, a rabbit polyclonal antibody raised against amino acids 2–21 of human BRCA1 protein; with MS13, which recognizes the N-terminal region of BRCA1; and with C-20, which recognizes the C-terminal region of BRCA1. All of these antibodies recognized the BRCA1 protein in the isolated centrosomes (data not shown), indicating that the hypophosphorylated BRCA1 associated with the centrosome is a full-length protein.
Figure 5.

γ-tubulin associates preferentially with hypophosphorylated BRCA1. Samples were separated by 4–12% SDS/PAGE, and immunoblotted by BRCA1 MS110. Lane 1, isolated centrosomes; lanes 2 and 3, in vitro transcription/translation product of full-length BRCA1; lane 4, immunoprecipitation by γ-tubulin antibody; and lane 5, immunoprecipitation by C-20.
DISCUSSION
We provide here evidence demonstrating an association of BRCA1 protein with the centrosome in mitotic cells. This evidence includes the results of immunofluorescence microscopy using polyclonal and monoclonal BRCA1-specific antibodies that recognize a C-terminal and an N-terminal domain of the protein respectively (Figs. 1 and 2). Biochemical analysis of isolated centrosomes further supports the presence of 220-kDa BRCA1 protein in the centrosomes (Fig. 3A). Furthermore, quantitative analysis of the 220-kDa BRCA1 protein associated with centrosomes isolated from equal numbers of exponentially growing control cells and cells arrested in G2/M (Fig. 3B) indicates that the enrichment of BRCA1 in arrested cells is proportional to the enrichment of the G2/M population. This observation is consistent with results of immunofluorescence staining that localize BRCA1 to centrosomes in mitotic cells but not in interphase cells.
Coimmunoprecipitation of BRCA1 with γ-tubulin (Fig. 4) suggests an interaction between these two proteins. γ-Tubulin, a crucial component of the centrosome, is responsible for nucleation of microtubules. It forms complexes with other components of the centrosome such as pericentrin (37), and mammalian homologues of the yeast spindle pole body components Spc97p and Spc98p (38, 39). However, to our knowledge, BRCA1 is the first tumor suppressor protein found to be associated with γ-tubulin, albeit perhaps indirectly, an observation that suggests that BRCA1 may be a regulator of mitotic-spindle assembly and of the G2/M checkpoint. Supporting evidence for involvement of BRCA1 in regulation of G2/M comes from a discovery by Larson et al. (40) that overexpression of a dominant-negative C-terminal peptide containing amino acids 1,293–1,863 alters G2/M progression and results in a decrease of the G2/M population and a reduction in the efficacy of colchicine in inducing G2/M arrest (40). It is also possible that BRCA1 associates with centrosomes during mitosis as a way to achieve appropriate distribution between the two daughter cells, as may be the case with other nuclear proteins such as NuMA (41), a molecule that also is required for the proper completion of mitosis (42). We also show that the BRCA1 protein associated with the centrosomes is hypophosphorylated (Fig. 5), suggesting that phosphorylation status may be important in determining the centrosome functions and/or subcellular distribution of BRCA1, or may be the result of its association with the centrosome.
BRCA1 is involved in progression of the cell cycle. Its expression and phosphorylation are cell cycle dependent, and overexpression induces growth arrest (43) or apoptosis (44). On the other hand, cellular proliferation is accelerated when BRCA1 expression is suppressed by antisense oligonucleotides (45) or by overexpression of dominant-negative BRCA1 peptides (40). Furthermore, breast tumors carrying BRCA1 mutations accumulate more chromosomal abnormalities (46) compared with breast tumors without BRCA1 mutations. It is likely that BRCA1 plays a continuous role throughout the cell cycle: expression and phosphorylation is induced at G1/S transition, and a complex with rad51 is associated with chromosomes during S phase and participates in DNA repair (10). Moreover, as a component of RNA polymerase II (8) or as a coactivator of p53-mediated transcription (9), BRCA1 may regulate the expression of other genes required for cell cycle progression. An increasing number of proteins involved in the G2/M checkpoint are found to associate with centrosomes during cell cycling, e.g., cyclin B (26), p34cdc2 (27, 28), p53 (30), and 14-3-3 (29). Therefore, it is possible that BRCA1 also plays a functional role with mitotic centrosomes.
Acknowledgments
We thank Dr. Ralph Scully for providing BRCA1 MS110 antibody, Dr. Stephen Doxsey for providing pericentrin antibody, Dr. Jeff Holt for providing BRCA1 cDNA, and Drs. Mary Beckerle, Mark Winey, and Stephen Doxsey for useful comments on this manuscript. This work was supported by funding from the Huntsman Cancer Institute.
ABBREVIATION
- DAPI
4′,6′-diamidino-2-phenylindole
References
- 1. Newman B, Mu H, Butler L M, Millikan R C, Moorman P G, King M-C. J Am Med Assn. 1998;279:915–921. doi: 10.1001/jama.279.12.915. [DOI] [PubMed] [Google Scholar]
- 2.Szabo C I, King M-C. Hum Mol Genet. 1995;4:1811–1817. doi: 10.1093/hmg/4.suppl_1.1811. [DOI] [PubMed] [Google Scholar]
- 3.Couch F J, Weber B L the Breast Cancer Information Core. Hum Mutat. 1996;8:8–18. doi: 10.1002/humu.1380080102. [DOI] [PubMed] [Google Scholar]
- 4.Miki Y, Swensen J, Shattuck-Eidens D, Futreal P A, Harshman K, Tavtigian S, Liu Q, Cochran C, Bennett L M, Ding W, et al. Science. 1994;266:66–71. doi: 10.1126/science.7545954. [DOI] [PubMed] [Google Scholar]
- 5.Chen Y, Chen C-F, Riley D J, Allred D C, Chen P-L, Von Hoff D, Osborne C K, Lee W-H. Science. 1995;270:789–791. doi: 10.1126/science.270.5237.789. [DOI] [PubMed] [Google Scholar]
- 6.Chapman M S, Verma I M. Nature (London) 1996;382:678–679. doi: 10.1038/382678a0. [DOI] [PubMed] [Google Scholar]
- 7.Monteiro A N A, August A, Hanafusa H. Proc Natl Acad Sci USA. 1996;93:13595–13599. doi: 10.1073/pnas.93.24.13595. [DOI] [PMC free article] [PubMed] [Google Scholar]
- 8.Scully R, Anderson S F, Chao D M, Wei W, Ye L, Young R A, Livingston D M, Parvin J D. Proc Natl Acad Sci USA. 1997;94:5605–5610. doi: 10.1073/pnas.94.11.5605. [DOI] [PMC free article] [PubMed] [Google Scholar]
- 9.Ouchi T, Monteiro A N A, August A, Aaronson S A, Hanafusa H. Proc Natl Acad Sci USA. 1998;95:2302–2306. doi: 10.1073/pnas.95.5.2302. [DOI] [PMC free article] [PubMed] [Google Scholar]
- 10.Scully R, Chen J, Plug A, Xiao Y, Weaver D, Feunteun J, Ashley T, Livingston D M. Cell. 1997;88:265–275. doi: 10.1016/s0092-8674(00)81847-4. [DOI] [PubMed] [Google Scholar]
- 11.Gowen L C, Johnson B L, Latour A M, Sulik K K, Koller B H. Nat Genet. 1996;12:191–194. doi: 10.1038/ng0296-191. [DOI] [PubMed] [Google Scholar]
- 12.Hakem R, de la Pompa J L, Sirard C, Mo R, Woo M, Hakem A, Wakeham A, Potter J, Reitmair A, Billia F, et al. Cell. 1996;85:1009–1023. doi: 10.1016/s0092-8674(00)81302-1. [DOI] [PubMed] [Google Scholar]
- 13.Scully R, Ganesan S, Brown M, De Caprio J A, Cannistra S A, Feunteun J, Schnitt S, Livingston D M. Science. 1996;272:123–125. doi: 10.1126/science.272.5258.123. [DOI] [PubMed] [Google Scholar]
- 14.Chen Y, Farmer A A, Chen C-F, Jones D C, Chen P-L, Lee W-H. Cancer Res. 1996;56:3168–3172. [PubMed] [Google Scholar]
- 15.Ruffner H, Verma I M. Proc Natl Acad Sci USA. 1997;94:7138–7143. doi: 10.1073/pnas.94.14.7138. [DOI] [PMC free article] [PubMed] [Google Scholar]
- 16.Vaughn J P, Davis P L, Jarboe M D, Huper G, Evans A C, Wiseman R W, Berchuck A, Iglehart J D, Futreal P A, Marks J R. Cell Growth Differ. 1996;7:711–715. [PubMed] [Google Scholar]
- 17.Gudas J M, Li T, Nguyen H, Jensen D, Rauscher F J, III, Cowan K H. Cell Growth Differ. 1996;7:717–723. [PubMed] [Google Scholar]
- 18.Aprelikova O, Kuthiala A, Bessho M, Ethier S, Liu E T. Oncogene. 1996;13:2487–2491. [PubMed] [Google Scholar]
- 19.Thomas J E, Smith M, Tonkinson J L, Rubinfeld B, Polakis P. Cell Growth Differ. 1997;8:801–809. [PubMed] [Google Scholar]
- 20.Scully R, Chen J, Ochs R L, Keegan K, Hoekstra M, Feunteun J, Livingston D M. Cell. 1997;90:425–435. doi: 10.1016/s0092-8674(00)80503-6. [DOI] [PubMed] [Google Scholar]
- 21.Kellogg D R, Moritz M, Alberts B M. Annu Rev Biochem. 1994;63:639–674. doi: 10.1146/annurev.bi.63.070194.003231. [DOI] [PubMed] [Google Scholar]
- 22.Zheng Y, Jung M K, Oakley B R. Cell. 1991;65:817–823. doi: 10.1016/0092-8674(91)90389-g. [DOI] [PubMed] [Google Scholar]
- 23.Stearns T, Evans L, Kirschner M. Cell. 1991;65:825–836. doi: 10.1016/0092-8674(91)90390-k. [DOI] [PubMed] [Google Scholar]
- 24.Doxsey S J, Stein P, Evans L, Calarco P D, Kirschner M. Cell. 1994;76:639–650. doi: 10.1016/0092-8674(94)90504-5. [DOI] [PubMed] [Google Scholar]
- 25.Stearns T, Kirschner M. Cell. 1994;76:623–637. doi: 10.1016/0092-8674(94)90503-7. [DOI] [PubMed] [Google Scholar]
- 26.Bailly E, Pines J, Hunter T, Bornens M. J Cell Sci. 1992;101:529–545. doi: 10.1242/jcs.101.3.529. [DOI] [PubMed] [Google Scholar]
- 27.Bailly E, Doree M, Nurse P, Bornens M. EMBO J. 1989;8:3985–3995. doi: 10.1002/j.1460-2075.1989.tb08581.x. [DOI] [PMC free article] [PubMed] [Google Scholar]
- 28.Pockwinse S M, Krockmalnic G, Doxsey S J, Nickerson J, Lian J B, van Wijnen A J, Stein J L, Stein G S, Penman S. Proc Natl Acad Sci USA. 1997;94:3022–3027. doi: 10.1073/pnas.94.7.3022. [DOI] [PMC free article] [PubMed] [Google Scholar]
- 29.Pietromonaco S F, Seluja G A, Aitken A, Elias L. Blood Cells Mol Dis. 1996;22:225–237. doi: 10.1006/bcmd.1996.0103. [DOI] [PubMed] [Google Scholar]
- 30.Brown C R, Doxsey S J, White E, Welch W J. J Cell Physiol. 1994;160:47–60. doi: 10.1002/jcp.1041600107. [DOI] [PubMed] [Google Scholar]
- 31.Fukasawa K, Choi T, Kuriyama R, Rulong S, Vande Woude G F. Science. 1996;271:1744–1747. doi: 10.1126/science.271.5256.1744. [DOI] [PubMed] [Google Scholar]
- 32.Thomas R C, Edwards M J, Marks R. Exp Cell Res. 1996;223:227–232. doi: 10.1006/excr.1996.0076. [DOI] [PubMed] [Google Scholar]
- 33.Stampfer M R, Bartley J C. Proc Natl Acad Sci USA. 1985;82:2394–2398. doi: 10.1073/pnas.82.8.2394. [DOI] [PMC free article] [PubMed] [Google Scholar]
- 34.Petersen O W, van Deurs B. Cancer Res. 1987;47:856–866. [PubMed] [Google Scholar]
- 35.Moudjou M, Bornens M. In: Cell Biology: A Laboratory Handbook. Celis J E, editor. San Diego.: Academic; 1994. pp. 595–604. [Google Scholar]
- 36.Krek W, DeCaprio J A. Methods Enzymol. 1995;254:114–124. doi: 10.1016/0076-6879(95)54009-1. [DOI] [PubMed] [Google Scholar]
- 37.Dictenberg J B, Zimmerman W, Sparks C A, Young A, Vidair C, Zheng Y, Carrington W, Fay F S, Doxsey S J. J Cell Biol. 1998;141:163–174. doi: 10.1083/jcb.141.1.163. [DOI] [PMC free article] [PubMed] [Google Scholar]
- 38.Murphy S M, Urbani L, Stearns T. J Cell Biol. 1998;141:663–674. doi: 10.1083/jcb.141.3.663. [DOI] [PMC free article] [PubMed] [Google Scholar]
- 39.Tassin A-M, Celati C, Moudjou M, Bornens M. J Cell Biol. 1998;141:689–701. doi: 10.1083/jcb.141.3.689. [DOI] [PMC free article] [PubMed] [Google Scholar]
- 40.Larson J S, Tonkinson J L, Lai M T. Cancer Res. 1997;57:3351–3355. [PubMed] [Google Scholar]
- 41.Compton D A, Szilak I, Cleveland D W. J Cell Biol. 1992;116:1395–1408. doi: 10.1083/jcb.116.6.1395. [DOI] [PMC free article] [PubMed] [Google Scholar]
- 42.Compton D A, Cleveland D W. J Cell Biol. 1993;120:947–957. doi: 10.1083/jcb.120.4.947. [DOI] [PMC free article] [PubMed] [Google Scholar]
- 43.Somasundaram K, Zhang H, Zeng Y-X, Houvras Y, Peng Y, Zhang H, Wu G S, Licht J D, Weber B L, El-Deiry W S. Nature (London) 1997;389:187–190. doi: 10.1038/38291. [DOI] [PubMed] [Google Scholar]
- 44.Shao N, Chai Y L, Shyam E, Reddy P, Rao V N. Oncogene. 1996;13:1–7. [PubMed] [Google Scholar]
- 45.Thompson M E, Jensen R A, Obermiller P S, Page D L, Holt J T. Nat Genet. 1995;9:444–450. doi: 10.1038/ng0495-444. [DOI] [PubMed] [Google Scholar]
- 46.Tirkkonen M, Johannsson O, Agnarsson B A, Olsson H, Ingvarsson S, Karhu R, Tanner M, Isola J, Barkardottir R B, Borg A, et al. Cancer Res. 1997;57:1222–1227. [PubMed] [Google Scholar]