

Abstract
15N relaxation data for Ca2+-bound rat β-parvalbumin (a.k.a. oncomodulin) were analyzed using the Lipari-Szabo formalism and compared with existing data for rat α-parvalbumin. Although the average S2 values for the two proteins are very similar (0.85 for α, 0.84 for β), residue-by-residue inspection reveals systematic differences. α tends to have the lower S2 value in helical regions; β tends to have the lower value in the loop regions. Rat β was also examined in the Ca2+-free state. The 59 assigned residues displayed an average order parameter (0.90) significantly greater than the corresponding residues in the Ca2+-loaded form. The pentacarboxylate variants of rat β—S55D and G98D—also were examined in the Ca2+-bound state. Although both mutations significantly heighten Ca2+ affinity, they utilize distinct energetic strategies. S55D improves the Ca2+-binding enthalpy; G98D improves the binding entropy. They also show disparate peptide backbone dynamics. Whereas β G98D displays an average order parameter (0.87) slightly greater than that of the wild-type protein, β S55D displays an average order parameter (0.82) slightly lower than wild-type β. Furthermore, whereas just two backbone N-H bonds in β G98D show internal motion on the 20–200-psec timescale, fully 52 of the 93 residues analyzed in β S55D show this behavior. These findings suggest that the increased electrostatic repulsion attendant to introduction of an additional carboxylate into the CD site ligand array impedes backbone vibrational motion throughout the molecule.
Keywords: Calcium-binding proteins, EF-hand proteins, parvalbumins, NMR, dynamics
Diverse biological phenomena are regulated by oscillations in cytosolic Ca2+ levels. These Ca2+ signals are a product of manifold metal ion–protein interactions involving membrane channel proteins, ATP-driven Ca2+ pumps, and myriad Ca2+-binding proteins. Signal specificity is achieved through differences in location, amplitude, duration, and frequency (e.g., Berridge 1997). A detailed understanding of Ca2+ signaling clearly will require correspondingly detailed knowledge of the kinetics and thermodynamics of Ca2+– and Mg2+–protein interactions.
Participants in virtually every Ca2+-signaling pathway, EF-hand proteins were the first intracellular Ca2+-binding proteins identified and characterized (Kretsinger 1980; Celio et al. 1996). Certain EF-hand family members, notably calmodulin and troponin C, function as Ca2+-dependent regulatory proteins. Others, notably parvalbumin and calbindin, serve as cytosolic Ca2+ buffers. By simply binding Ca2+, the latter help to shape the Ca2+ signal, limiting its amplitude, extent of propagation, and/or duration.
The EF-hand Ca2+-binding motif consists of a 12-residue metal ion-binding loop flanked by short helical elements. Positioned at the approximate vertices of an octahedron, the ligands are labeled +x, +y, +z, −y, −x, and −z. The side chains of loop residues 1, 3, 5, 9, and 12 furnish the +x, +y, +z, −x, and −z ligands, respectively. The main-chain carbonyl of loop residue 7 serves as the −y ligand, and a water molecule often occupies the −x position. Coordination by the −z carboxylate (generally glutamate) is bidentate for Ca2+, monodentate for Mg2+.
The EF-hand family shows substantial diversity in divalent metal ion-binding behavior (Seamon and Kretsinger 1983). The Ca2+- and Mg2+-binding constants measured in vitro span four orders of magnitude. EF-hand motifs with Ca2+- and Mg2+-binding constants in excess of 107 M−1 and 104 M−1, respectively, are termed Ca2+/Mg2+ sites. Lower affinity sites are termed Ca2+ specific. Inquiry into the structural basis for these variations is in its third decade. Although the fundamental determinants of metal ion specificity and affinity, that is, size and charge, must be identical in proteins and small molecule chelators, the protein architecture introduces additional complexity (Falke et al. 1994; Linse and Forsén 1995).
Parvalbumins are small (Mr 12,000), vertebrate-specific members of the EF-hand protein family (Wnuk et al. 1982; Pauls et al. 1996). The parvalbumin (PV) molecule (Fig 1 ▶) has long been a popular system for structure–affinity studies. Its relatively simple façade—roughly 110 amino acids, two classic EF hands, minimal cooperativity, no known effector-binding capacity—conceals a store of subtle complexity. Beginning with the crystal structure of carp parvalbumin (Kretsinger and Nockolds 1973), which established the EF-hand structural paradigm, biophysical characterization of this protein family has contributed substantively to our knowledge of EF-hand structure–affinity relationships. The PV family includes α and β sublineages (Moncrief et al. 1990), which differ in isoelectric point (β <5) and C-terminal helix length (one residue longer in α).
Fig. 1.

Ribbon diagram of the rat β-parvalbumin tertiary structure, prepared with Molscript (Kraulis 1991), using the crystallographic coordinates determined by Ahmed et al. (1993).
The parvalbumin Ca2+-binding sites are called the CD and EF sites, in reference to the helical elements flanking the metal ion-binding loops. The CD site spans residues 41–70; the EF site spans residues 80–108. As shown in Figure 2 ▶, the mode of ligation differs at two positions: the +z and −x positions in the CD and EF loops. Note that the mammalian β-parvalbumin is unique in having an aspartate at the −x position; glutamate is found at this position in all other parvalbumins. In addition to the CD and EF sites, the N-terminal domain, encompassing residues 1 through 40, harbors a vestigial EF-hand motif. This so-called AB domain suffered a two-residue deletion that abolished its metal ion-binding capacity.
Fig. 2.

Ligation in the rat β-parvalbumin Ca2+-binding loops. The CD and EF site ligand arrays in the wild-type protein differ at the +z and −x postions. The +z residue is serine in the CD site, aspartate in the EF site. The −x residue is aspartate in the CD site and glycine in the EF site. Although a water molecule serves as the actual −x ligand in both cases, the coordinating water molecule in the CD site bridges the bound Ca2+ and the aspartyl side chain. In the S55D and G98D variants, aspartate replaces the +z serine and −x glycine, respectively. As a result, the ligand arrays in the CD site of S55D and the EF site of G98D are identical: three directly coordinated aspartyl carboxylates, one indirectly coordinated aspartyl moiety, and a glutamyl carboxylate.
Individual parvalbumin isoforms can show widely different metal ion-binding properties. The rat α and β-PVs are illustrative. The α CD and EF sites, both Ca2+/Mg2+ sites, behave equivalently during titrations with Ca2+ or Mg2+ (Pauls et al. 1993; Eberhard and Erne 1994). However, the β CD and EF sites are distinctly nonequivalent (Hapak et al. 1989; Cox et al. 1990; Palmisano et al. 1990). Whereas the EF site is a Ca2+/Mg2+ site, the CD site displays a Ca2+-specific signature. This diversity, in proteins that show 49% sequence identity (Fig. 3 ▶), provides an attractive system for examining the influence of protein context on divalent ion affinity.
Fig. 3.

A comparison of the rat α- and β-parvalbumin primary structures. Sequence data for the two proteins were obtained from Epstein et al. (1986) and Gillen et al. (1987), respectively.
The high-resolution X-ray structures of rat α and β offer little insight into the origins of their disparate divalent ion-binding behaviors. Heteronuclear nuclear magnetic resonance (NMR) relaxation techniques offer a powerful strategy for studying atomic motion in proteins and thus offer an additional approach to this problem (Peng and Wagner 1994; Palmer et al. 1996). In favorable cases, they provide information on nearly every residue in the molecule, on a timescale ranging from picoseconds to milliseconds. 15N relaxation properties can furnish insight into the behavior of the peptide backbone; 13C-methyl relaxation properties can furnish insight into side-chain motion. Baldellon et al. (1998) previously reported 15N relaxation data for the Ca2+-bound α isoform. We herein report corresponding data for the Ca2+-loaded and Ca2+-free states of rat β-parvalbumin.
We also present data gathered on the Ca2+-bound states of the pentacarboxylate variants of rat β, that is, S55D and G98D. These mutations add a fifth carboxylate to the ligand arrays of the CD and EF sites, respectively. Although data obtained on peptide analogs predicted that these alterations would reduce Ca2+ affinity (Marsden et al. 1988), S55D and G98D both increase the Ca2+ affinity of their respective binding sites by a factor of approximately 12 (Henzl et al. 1996a). Interestingly, however, they appear to achieve this effect via distinct mechanisms. Whereas the more favorable free energy of Ca2+ binding for S55D reflects a more favorable enthalpy of binding, that of G98D is almost entirely entropic. It was of interest to learn whether the two variants would likewise show distinctive 15N relaxation properties.
Results
The relaxation behavior of an amide 15N nucleus is dominated by the dipolar interaction with the attached proton spin and by chemical shift anisotropy. 15N relaxation data—R1, R2, and NOE—for a given field strength can be converted into three spectral density values, J(0), J(ωN), and J(ωN + ωH). R2 also may include a contribution (Rex) from chemical/conformational exchange on the microsecond-millisecond timescale. Lipari and Szabo (1982a,b) showed that these spectral density values can be recovered using a model-free formalism, which includes the contributions from the overall tumbling motion of the macromolecule, internal motions of the 1H-15N bond vector, and any chemical/conformational exchange phenomena.
The original Lipari-Szabo treatment yields an order parameter (S2), which is indicative of the amplitude of the local motion of N-H bond vector, a correlation time for that motion (τe), and a rate constant for conformational exchange. Extensions of the original treatment have been developed to allow for motion on two distinct timescales (Clore et al. 1990a,1990b).
Assignment of amide resonances
The HSQC spectrum of Ca2+-bound rat β-PV is shown in Figure 4A ▶. 15N and 1HN chemical shifts previously were reported for 104 of the 107 amides (Henzl et al. 1996b). Most chemical shifts in the S55D and G98D variants were virtually unchanged, permitting assignments to be made by inspection. In G98D, the remaining resonances were assigned using a combination of TOCSY-HSQC and NOESY-HSQC experiments. However, a similar strategy proved unsuccessful in S55D. Instead, CBCA(CO)NH and HNCACB data sets, collected on 13C,15N-labeled S55D, were used to complete the assignments.
Fig. 4.

HSQC spectra of (A) Ca2+-bound rat β-parvalbumin and (B) Ca2+-free β in 150 mM NaCl at pH 6.0.
Although removal of Ca2+ from rat β profoundly alters the appearance of the HSQC spectrum (Fig. 4B ▶), the apoprotein retains its native fold. Under solution conditions comparable to those used for the NMR work, the protein denatures cooperatively (ΔHvH/Δ Hcal = 1.0) at 52°C, with ΔH = 82 kcal/mole, and ΔCp = 1.4 kcal/mole−1 K−1. The reduced dispersion in the HSQC spectrum results primarily from loss of structure in the CD- and EF-binding loops. The AB domain, the D/E loop, and the E helix retain chemical shifts comparable to those observed in the Ca2+-bound form.
Even with 13C,15N-labeled material, we were able to unambiguously assign just 59 of the residues, because of a combination of severe spectral overlap and exchange broadening. Most of the assigned residues are located in the AB domain of the protein (residues 1–40). The remaining residues fall primarily in the D and E helices and in the D–E interhelical region.
Measured relaxation parameters
The relaxation rate parameters, R1, R2, and NOE, were obtained from proton-detected 15N-1H heteronuclear correlation spectra. The R1 and R2 decay curves were fit with two or three-parameter nonlinear functions.
The values of R1, R2, and 15N NOE are presented in graphical form in Figure 5 ▶ for Ca2+-bound and Ca2+-free wild-type β and for the Ca2+-bound forms of β G98D and β S55D. The corresponding numerical data are tabulated in the supplementary material. Statistical summaries of the relaxation parameters for each sample are presented in Table 1. The averages of the relaxation parameters listed there represent the trimmed mean values, calculated from those values falling within one standard deviation of the overall mean value.
Fig. 5.

Graphs of R1, R2, and NOE as a function of amino acid residue number for wild-type rat β (Ca2+-bound and Ca2+-free) and for Ca2+-bound β S55D and β G98D. wt, wild type.
Table 1.
Average relaxation and dynamics parametersa
| Ca2+-bound β | Ca2+-free β | β G98D | β S55D | |
| R1 (s−1) | 2.50 | 2.50 | 2.53 | 2.34 |
| R2 (s−1) | 5.83 | 7.00 | 6.16 | 6.14 |
| NOE | 0.70 | 0.68 | 0.73 | 0.64 |
| R2/R1 | 2.33 | 2.81 | 2.43 | 2.63 |
| S2 | 0.84 | 0.90 | 0.87 | 0.82 |
a Average over those residues having R2/R1 values within one standard deviation from the overall mean.
Sedimentation equilibrium studies
The association state of each sample was examined by analytical ultracentrifugation. At low protein concentration (∼150 μM), in 0.15 M NaCl, all four samples behave as ideal monomers. The top panels of Figure 6 ▶ display the best least-squares fit to an ideal, single-species model. The apparent molecular weights derived from the least-squares analyses, indicated on the figures, are somewhat higher than the sequence-derived values. This discrepancy might reflect an interaction of the highly charged proteins with solvent cations. Alternatively, it might reflect inaccuracy in the partial specific volume. The value used for the calculations, 0.724, does not include the contribution of the bound Ca2+ ions, expected to be negative. A 1% error in the value of  produces a 3% error in the apparent molecular weight.
Fig. 6.

Sedimentation equilibrium analyses of wild-type β (Ca2+-bound and Ca2+-free), β S55D, and β G98D. Samples of the proteins were centrifuged to equilibrium at 20°C, in a Beckman XL-I analytical ultracentrifuge, as described in Materials and Methods. The top panels show absorbance data collected at relatively low protein concentration (150 μM). These data were treated with an ideal single-species model, yielding the apparent molecular weights indicated on the graphs. The bottom panels present data collected with interference optics at protein concentrations comparable to those used in the NMR relaxation studies. These data were analyzed with a nonideal single-species model, fixing the molecular weights at the values obtained at low concentration. Values for the second virial coefficient, in units of L mole g−2, are displayed on the graphs. A subset of the data points are shown for clarity.
At high protein concentrations, comparable to those used for the NMR studies, the data show pronounced nonideality. Nonlinear least-squares analyses of the data—using the vendor-supplied nonideal model—are displayed in the bottom panels of Figure 6 ▶. The solid line fits to the data were obtained by fixing the molecular weight at the value determined at low concentration, then varying the second virial coefficient, B, to obtain the lowest χ2 value. Again, the agreement between the observed and calculated values is very good. The value of B is shown in each figure.
Estimation of the overall correlation time
For bond vectors subject solely to rapid, low-amplitude intramolecular motion, the R2/R1 ratio is approximately independent of the internal motion and provides a reliable indicator of the rate at which each N-H vector reorients with global tumbling. Thus, an estimate of the overall rotational correlation time (τm) for each sample was obtained from the trimmed average R2/R1 ratio, excluding residues with R2/R1 values greater than one standard deviation from the mean (Kay et al. 1989; Palmer et al. 1991). Exclusion of R2/Rl ratios outside this range is intended to eliminate N-H bond vectors that undergo chemical exchange or large amplitude internal motions. The values of τm ranged between 4.3 and 5.0 nsec (Table 2).
Table 2.
Rotational diffusion parameters
| Ca2+-bound β | Ca2+-free β | β G98D | β S55D | |
| τm (ns) | 4.27 ± 0.02 | 5.05 ± 0.09 | 4.44 ± 0.03 | 4.73 ± 0.43 |
| Diso (10−7 s) | 3.92 ± 0.02 | 3.37 ± 0.02 | 3.76 ± 0.03 | 3.52 ± 0.04 |
| D/D⊥ | 1.09 ± 0.03 | 0.90 ± 0.04 | 0.90 ± 0.04 | 1.04 ± 0.06 |
| θ (deg) | 1.07 ± 0.21 | 0.21 ± 0.27 | 0.31 ± 0.28 | 1.40 ± 1.02 |
| ϕ (deg) | 4.31 ± 0.23 | 0.81 ± 1.21 | 5.16 ± 0.90 | 1.97 ± 0.98 |
| Fa | 5.69 | 1.10 | 6.93 | 0.84 |
aF-statistics were used to assess the significance of the improvement afforded by the axially-symmetric model.
Although the accuracy of τm values determined from the trimmed R2/R1 ratio has been questioned (Lee and Wand 1999), the agreement with alternative methods (Dellwo and Wand 1989; Barbato et al. 1992; Lefevre et al. 1996) is generally good, at least for 15N relaxation. For example, the τm of 4.1 nsec estimated for ubiquitin using the trimmed R2/R1 mean (Tjandra et al. 1995a) is identical to that determined by extensive optimization of model-free fits, using R1 data obtained at two fields together with NOE data obtained at a single field (Schneider et al. 1992).
To obtain the trimmed averages, we discarded 22 of 93 R2/R1 values from the Ca2+-bound wild-type β data set; 11 of 59 from the Ca2+-free β data set; 14 of 87 from the G98D data set; and 22 of 93 from the S55D data set. Interestingly, the τm's calculated from the overall R2/R1 average, and the trimmed mean were virtually identical for Ca2+-bound wild-type β (4.29 and 4.27 nsec, respectively); for Ca2+-bound G98D (4.45 and 4.44 nsec); and for Ca2+-bound S55D (4.76 and 4.73 nsec). The corresponding τm values determined for Ca2+-free wild-type β were likewise very similar (5.22 and 5.05 nsec) although not identical. Intuitively, we expect a larger hydrodynamic radius and, hence, larger τm for the Ca2+-free protein, due to increased electrostatic repulsion between the unliganded carboxylates in the Ca2+-binding loops.
Anisotropic rotational diffusion
Rat β-parvalbumin is a prolate ellipsoidal molecule. The principal moments of inertia, calculated from the refined crystallographic structure of (Ahmed et al. 1993) are in the ratio of 1.00 : 0.84 : 0.76. Thus, rotational diffusion of the rat β molecule should be well accommodated by an axially symmetric diffusion tensor. The dimensions and orientation of the diffusion tensor were estimated for each sample from the trimmed mean R2/R1 ratio (Tjandra et al. 1995a).
Each data set was analyzed using both spherically isotropic and axially symmetric [Dzz (≡ D∥) > Dxx = Dyy (D⊥)] diffusion models. Table 2 summarizes the results. The axially symmetric model yielded better agreement between the predicted and observed R2/R1 ratios in all four cases. However, the F statistical test (Bevington and Robinson 1992) suggested that the minor reductions in χ2 obtained for Ca2+-free β and for the β S55D variant were probably not significant.
Model-free analysis
Model-free analysis was performed as described in Materials and Methods. The spectral density functions for most amide N-H vectors could be modeled with simply an order parameter, S2, and an overall rotational correlation time, τm. The remainder required either a correlation time for internal motion (τe) or a conformational exchange rate constant (Rex). None of the residues showed a second timescale of subnanosecond internal motion. The model selection statistics and average order parameters are summarized for each sample in Table 3, and the model-free parameters are plotted in Figure 7 ▶.
Table 3.
Model selection statisticsa
| Number of residues accommodated by each model | ||||
| Ca2+-bound β | Ca2+-free βb | β G98D | β S55D | |
| Model 1 (S2f) | 82 | 50 | 83 | 41 |
| Model 2 (S2f, τe) | 3 | 4 | 2 | 52 |
| Model 3 (S2f, Rex) | 8 | 3 | 0 | 0 |
| Model 4 (S2f, S2s, Rex) | 0 | 0 | 0 | 0 |
| Model 5 (S2f, S2s, τs) | 0 | 0 | 0 | 0 |
a The number of residues fit to each of the five models for each sample.
b A14 and Q19 were not satisfactorily fit by any of the models.
Fig. 7.

Graphs of the model-free parameters—S2, τe, and Rex—as a function of residue number for wild-type β (Ca2+-bound and Ca2+-free), β S55D, and β G98D.
Ca2+-bound wild-type β-PV
Although assignments previously had been made for 104 amides, spectral degeneracies prevented us from examining Ser 39/Asp 87, Ser 42/Ser 108, Asp 53/Gln 54, and Arg 75/Glu 76. Of the remaining 93 signals, the relaxation properties for all but eight could be accommodated by the simplest model (S2 only). Three residues (T3, I5, K28) required inclusion of τe; another eight (Glu 9, Thr 32, Ala 40, Gly 56, Tyr 65, Ser 72, Glu 79, Val 106) required addition of a conformational exchange parameter.
The average order parameter for the entire data set is 0.84. Residues showing particularly low values of S2 include Ile 5, Leu 6, Ser 7, Gln 27, Lys 28, Asn 52, and Asn 91. Residues 5–7 and 27–28 reside in loops. Asn 52 and Asn 91 are the second residues in the CD- and EF-binding loops, respectively. Low order parameters are apparently a characteristic for this position, having been reported previously for calmodulin (Barbato et al. 1992) and rat α-parvalbumin (Baldellon et al. 1998), but not calbindin D9k (Kördel et al. 1992).
Ca2+-free wild-type β-PV
The HSQC spectrum of Ca2+-free β (Fig. 4B ▶) shows lower resolution than that of the Ca2+-bound wild-type protein. Analysis was possible for just 59 residues in the apoprotein, located primarily in the AB domain (residues 1–41), helix D, and the D/E interhelix region. As we observed for the Ca2+-bound protein, the relaxation properties for most signals were satisfactorily accommodated by the simplest model. Four residues (Ala 12, Phe 29, Glu 76, Ala 99) required inclusion of τe values; three (Asp 22, Ser 39, Ala 40) required inclusion of Rex terms. The average order parameter for the 59 residues is 0.90, higher than that observed for the Ca2+-bound protein. The lowest value in the data set is 0.79.
Ca2+-bound G98D
Analysis was possible for 87 of the 107 amides in G98D. The relaxation behavior of this variant is noteworthy for its qualitative similarity to the wild-type protein. In particular, the S2 values track those of wild-type β quite closely.
The relaxation behavior of essentially all of the residues can be described by an order parameter alone. Just two of the observable residues (T3 and L6) show internal motion on the 20–200-psec timescale, requiring inclusion of a τe value for the model-free analysis. None required a conformational exchange parameter.
The average S2 value for the entire data set is 0.87, slightly higher than the value obtained for the wild-type protein. Within the EF-binding loop (residues 90–101), the order parameters are significantly higher than those observed in the wild-type protein.
Ca2+-bound S55D
The parameters plotted for β S55D in Figure 7 ▶ suggest that the conformational dynamics of S55D differ perceptibly from those observed for wild-type β and β G98D. Whereas just two residues in the latter show evidence of retarded internal motion, 52 residues in β S55D—more than half of those assigned and analyzed—require the inclusion of τe in the Lipari-Szabo treatment. None required a conformational exchange parameter.
The average order parameter for the entire S55D data set is 0.82, slightly lower than the corresponding value for wild-type β and significantly lower than that measured for β G98D. However, within the mutated CD-binding loop, the order parameters are on average larger than those determined for the corresponding residues in the wild-type protein.
Discussion
Several EF-hand proteins have been examined by NMR relaxation methods. The backbone dynamics of calbindin D9k have been studied extensively by 15N relaxation in the Ca2+-loaded state (Kördel et al. 1992; Skelton et al. 1992) and in the apo and (Cd2+)1 states (Skelton et al. 1992; Akke et al. 1993a). Using data for the apo-, Cd2+-, and fully bound states, Akke et al. (1993b) sought to explain the cooperative Ca2+ binding in terms of the order parameters for the three states, a pioneering effort to link changes in S2 with changes in thermodynamic parameters. More recently, Malmendal et al. (1998) studied the 15N relaxation properties of a site-specific calbindin variant in which the N-terminal pseudo-EF hand had been replaced by a consensus EF-hand loop. Chazin and colleagues recently have compared the backbone dynamics of the (Ca2+)1 form of calbindin N56A, which binds Ca2+ preferentially in the N-terminal pseudo-EF hand, with those of the apo- and Ca2+-loaded wild-type protein (Mäler et al. 2000).
The main-chain dynamics of full-length calmodulin have been studied in the Ca2+-loaded (Barbato et al. 1992) and Ca2+-free (Tjandra et al. 1995b) states. More recently, investigators have studied the 15N relaxation properties of the C-terminal domain at low calcium levels (Malmendal et al. 1999) and at saturating Ca2+ levels in the presence of the E140Q mutation (Evenäs et al. 1999).
Lee et al. (2000) have used deuterium NMR relaxation methods to probe methyl group dynamics in calmodulin, both free and complexed with the calmodulin target peptide from smooth-muscle myosin light chain kinase. Although the methyl S2 values increase on average by 0.07 on complexation, the response is highly position dependent. For example, whereas Met 72 and Met 124 become much more rigid (ΔS2 > 0.5), several other side chains—having significant solvent exposure—show increased mobility. Very recently, Lee and Wand (2001) studied the temperature dependence of the calmodulin methyl group dynamics in the calmodulin-peptide complex, in an effort to extract residual entropy and heat capacity values from side-chain order parameters.
Comparison of rat α- and β-parvalbumin dynamics
α- and β-parvalbumins are distinguished by PI (>5 for α), C-terminal helix length (generally one residue longer in α), and lineage-specific sequence differences (e.g., Cys 18 in β). Because of their greater net charge and shorter C-terminal helix, β isoforms are widely believed to have intrinsically lower conformational stability. However, we recently showed that Ca2+-free rat β-parvalbumin is intrinsically more stable than rat α (Henzl and Graham 1999; Henzl et al. 2000). Although the stabilities of both isoforms are modulated by monovalent cation concentration, the superior stability of the β isoform persists at very low ionic strength.
Despite sequence identity at 53 of 108 residues, the rat α- and β-parvalbumin isoforms show distinct metal ion-binding properties. In 0.15 M NaCl, 0.025 M Hepes-NaOH at pH 7.4, the Ca2+ affinities of the β EF and CD sites are ∼5 and 100 times lower, respectively, than those of the corresponding sites in α. A satisfactory explanation for this difference, currently lacking, could furnish substantial insight into protein–metal ion interactions.
Baldellon et al. (1998) previously published detailed 15N relaxation data, acquired at 400 and 600 mHz, for Ca2+-bound rat α-parvalbumin. Their discussion included a systematic comparison with corresponding data for calmodulin and calbindin D9k. The parvalbumin molecule was shown to show significantly greater rigidity, as reflected in the order parameters. The average order parameter for rat α was 0.85, and, with few exceptions, deviations from the mean value did not exceed 0.1. Differences between rat α and the two other EF-hand proteins were greatest in the vicinity of the linker between EF hands and at the C terminus. The limited mobility of the parvalbumin linker region was attributed to stabilization by the salt bridge between Arg 75 and Glu 81 and by backbone hydrogen bonds between Gly 64 and Leu 77 and between Ser 71 and Ala 74. The rigidity of the C-terminal region, on the other hand, was attributed to a network of hydrogen bonds and electrostatic interactions between the C-terminal carboxylate and residues in the BC loop.
Our data indicate that Ca2+-bound rat β-parvalbumin displays rigidity comparable to rat α. The average order parameter determined for β, 0.84, is nearly identical to the rat α value (0.85), and the individual order parameters show a similarly limited dispersion. The minor difference in average S2 may reflect the lower data acquisition temperature (32°C) used for the α isoform.
Despite the near equality of their average S2 values, the α- and β-parvalbumins show systematic differences in their individual order parameters. These differences are plotted versus residue number in Figure 8A ▶, with positive values corresponding to amide groups having greater rigidity in α. The α isoform has consistently higher S2 values in the helical regions. This tendency might reflect its substantially lower net charge and consequently lower degree of electrostatic repulsion. Whereas the predicted charge on α is −5 to −7, depending on the ionization status of the two histidines, the predicted charge on β is −15 to −16. In contrast, β shows significantly larger S2 values in several of the loop regions. Three of these clusters fall in the N-terminal AB domain, a vestigial EF-hand motif lacking metal ion-binding activity. A fourth cluster falls in the CD site between residues 57 and 62. In addition, there are several isolated residues or pairs of residues displaying larger order parameters in β, including Thr 3, Gln 71/Ser 72, Ser 80, and Asp 100. Several other examples, Phe 47/Arg 48, Ser 55, Gly 95, Ile 97, and Ala 99 are of questionable significance.
Fig. 8.

A residue-by-residue comparison of order parameters in (A) Ca2+-bound rat α- and β-parvalbumins, (B) Ca2+-bound and Ca2+-free rat β, (C) Ca2+-bound β and β G98D, and (D) Ca2+-bound β and β S55D.
The parvalbumin backbone depicted in Figure 9 ▶ has been color-coded to indicate the relative magnitudes of the order parameters in α and β. Regions of the polypeptide chain shown in cyan have lower mobility in α; those shown in magenta are apparently less mobile in β. Residues for which complete data are unavailable are displayed in yellow.
Fig. 9.

Depiction of the relative rigidity of the rat α- and β-parvalbumin peptide backbones. Cyan coloring denotes regions having the higher order parameter in the α isoform; magenta denotes regions having the higher order parameter in β. Residues for which data were unavailable for both proteins are shown in yellow.
Discounting Gln 19, residues 18–25 show reduced mobility in the β isoform. This apparent rigidity may be attributable to the proline residues at positions 21 and 26. The limited conformational opportunities available to proline would tend to immobilize the extended loop linking the A and B helices. We have suggested previously that Pro 21 and Pro 26 are important conformational determinants of rat β-parvalbumin, responsible in part for the β isoform's unexpectedly greater stability in the Ca2+-free state. Recent scanning calorimetry findings from our lab support this hypothesis (S. Agah, J.D. Larson, and M.T. Henzl, unpubl.).
Additional islands of reduced mobility in β occur at the boundaries of the AB domain. At the N-terminal end of the A helix, residues 7–9 show S2 values larger than those found at the corresponding positions in α. Similarly, in the BC loop, connecting the B and C helices, residues 37, 38, and 40 show larger S2 values than those found in α. The absence of data for Ser 39, due to spectral overlap with Thr 87, prevents us from determining whether that residue shows similar behavior. The origins of the heightened rigidity displayed by these segments are uncertain. Conceivably, they are a reflection of the increased stability of the AB domain conferred by Pro 21 and Pro 26.
There is another segment of the backbone in the CD-binding loop, spanning residues 57–59 and 61–62, that shows perceptibly greater rigidity in the β isoform. A priori, we would expect rigidity to parallel Ca2+ affinity. Thus, given that the Ca2+ affinity measured in vitro for the α CD site is ∼100 times higher than measured for β, this observation is unexpected. Although we presently have no way of knowing whether the relationship is causal, it is noteworthy that the defining primary structural feature of the mammalian β-parvalbumin, that is, the sequence triad Tyr 57, Leu 58, and Asp 59, falls in this region. Note that residue 60 is glycine in rat β and shows substantial disorder in the X-ray structure of the Ca2+-bound protein (Ahmed et al. 1993). In all likelihood, were this residue replaced by one having a side chain, for example, aspartate, as in guinea pig β (Henzl et al. 1997), its order parameter would be significantly higher.
The two rat parvalbumins also appear to differ with regard to low-frequency internal motion. Whereas 29 of the 107 main-chain N-H bonds in rat α display evidence for conformational exchange, just eight of the backbone amides in rat β require inclusion of an Rex term. These are scattered throughout the molecule: Glu 9, Thr 32, Ala 40, Gly 56, Tyr 65, Ser 72, Glu 79, and Val 106
Comparison of Ca2+-free and Ca2+-bound rat β-parvalbumin
Because of severe overlap and line broadening, we were able to assign and analyze just 59 of the amide groups in Ca2+-free rat β. As observed for the Ca2+-bound protein, the spectral density values for the majority of residues could be recovered with the simplest Lipari–Szabo model, requiring only an order parameter. Only four residues showed significant internal motion on the 20–200-psec timescale (Ala 12, Phe 29, Glu 76, Ala 99), and just three others (Asp 22, Ser 39, Ala 40) required a conformational exchange term. The behaviors of A14 and Q19 were not satisfactorily accommodated by any of the four models.
Interestingly, the average order parameter for the 59 assigned residues in Ca2+-free β (0.90) was significantly higher than that for the corresponding residues in the Ca2+-bound protein. Figure 8B ▶ provides graphic illustration of this fact. Of the 54 residues for which relaxation data are available in both states, 49 show lower mobility/greater rigidity in the Ca2+-free form. This result, seemingly counterintuitive, might constitute evidence for a Ca2+-induced conformational rearrangement of the AB domain and D/E regions of molecule. It is tempting to speculate that the energetic cost for this rearrangement might be partially responsible for the attenuated Ca2+ affinity displayed by rat β. In other words, the energy required to break the noncovalent interactions stabilizing the Ca2+-free conformation is paid for out of the intrinsic free energy of Ca2+ binding. This hypothesis could be tested further by an examination of the side-chain order parameters for the Ca2+-free and Ca2+-bound states. If confirmed, it would be of interest to see a similar comparison of the free and bound forms of rat α.
Comparison of the β pentacarboxylate variants with wild-type β
The acid-pair hypothesis of Reid and Hodges (1980) posits that intrinsic Ca2+ affinity should be maximized in an EF-hand motif having four carboxylate ligands positioned at the +x,−x and +z,−z coordination sites. Introduction of a fifth carboxylate into the coordination sphere of an EF-hand site is predicted to reduce binding affinity—behavior that has been confirmed in EF-hand peptide models. Interestingly, however, addition of a fifth aspartyl ligand to either the CD or EF site of rat β increases the association constant by more than an order of magnitude. Preliminary data from our lab suggest that this finding, that is, the heightened divalent ion affinity of the pentacarboxylate array, is not merely a peculiarity of the mammalian β isoform (S. Agah, J.D. Larson, and M.T. Henzl, unpubl.).
Intriguingly, pentacarboxylate ligand arrays comparable to those in β S55D and β G98D do not occur naturally. Presumably, their absence reflects physiologically inappropriate binding affinity, kinetics, and/or specificity. The closest approach is found in the CD site of cod β-parvalbumin, where glutamate replaces the serine residue normally found at the +z ligation position. Although binding constants have not been measured directly for cod β, spectroscopic evidence suggests that one of the two sites, presumably the CD site, is a low-affinity, Ca2+-specific site. This agrees with our in vitro observation that substitution of glutamate for the aspartate at the +z position in the rat β CD site, to produce S55E, affords a protein having substantially lower Ca2+ affinity than wild-type β (M.T. Henzl, unpubl.). Clearly, the consequences of an additional carboxylate are strongly dependent on the side-chain length and arrangement, and the pentacarboxylate variants provide useful tools for probing the details of interligand repulsion in EF-hand sites.
Comparison of β G98D and wild-type β
Replacement of Gly 98 by aspartate raises the Ca2+-binding constant for the EF site, in 0.15 M NaCl, 0.025 M Hepes-NaOH at pH 7.4, from 2.2 × 10⁷ M−1 to 2.5 × 10⁸ M−1, a 1.4-kcal/mole reduction in the ΔG for binding. Consistent, perhaps, with its higher Ca2+ affinity, Ca2+-bound β G98D shows perceptibly greater rigidity than the wild-type protein. The relaxation properties of all but two of the analyzed residues can be accommodated solely with an order parameter. The two exceptions show indications of retarded internal motions, requiring inclusion of τe in the Lipari–Szabo model. None of the residues required a conformational exchange term.
The average order parameter for β G98D (0.87) is perceptibly higher than the value obtained for the wild-type protein (0.84). Order parameters for the individual residues in the two proteins are compared in Figure 8C ▶. The consistently larger values for S2 in β G98D suggests that the increased order extends to all regions of the molecule.
Comparison of β S55D and wild-type β
Replacement of Ser 55, the +z ligand in the CD site, with aspartate increases the binding constant for that site in 0.15 M NaCl, 0.025 M Hepes at pH 7.4, from 1.2 × 10⁶ M−1 to 1.5 × 10⁷ M−1. Although the reduction in ΔG for binding is virtually identical to that resulting from the G98D mutation, the consequences of the S55D mutation on the backbone dynamics are very different. Most significantly, introduction of the additional carboxylate at residue 55 appears to perturb rapid internal motions throughout the molecule. Whereas just three of the residues analyzed in wild-type β require inclusion of a τe value in the Lipari–Szabo function, 52 residues in β S55D, of a total of 93 analyzed, require the additional parameter. The implication is that nearly half of the main-chain NH vectors in the S55D variant undergo subnanosecond reorientation at a rate perceptibly slower than their counterparts in wild-type β.
It is reasonable that the increased electrostatic repulsion within the CD-binding loop, resulting from the S55D mutation, would impede motion in the immediate vicinity of Asp 55. It seems less likely, however, that the altered electrostatic field would have a palpable impact in the distal regions of the molecule. The absence of a comparable perturbation in G98D supports this opinion. More likely, the system-wide disturbance reflects the central location of residue 55, indeed, the entire CD loop, and the reality that protein backbone vibrations are not entirely independent. Presumably, hindered reorientation of main-chain amide groups within the CD loop in the peptide backbone provokes compensatory movements in neighboring residues and/or elements of secondary structure.
The reduction in the rapidity of internal motion in β S55D is accompanied by a nearly global reduction in the order parameter. The average order parameter is decreased from 0.84 in the wild-type protein to 0.82. As illustrated in Figure 8D ▶, which compares the individual S2 values in S55D and wild-type β, only the CD-binding loop shows a higher degree of order than the wild-type protein. The increased rigidity of the CD loop may reflect the significantly higher Ca2+ affinity of that site in the S55D variant.
Contrasting behavior of the S55D and G98D variants
We alluded to the contrasts between the pentacarboxylate variants in the introduction. Although the ligand arrays in the mutated binding loops are identical, and although both mutations decrease the ΔG for Ca2+ binding by roughly 1.5 kcal/mole, they achieve their more favorable binding free energies by distinct mechanisms. Whereas the heightened Ca2+ affinity of S55D has an enthalpic origin, that of G98D is entropic. Moreover, note that the binding affinity of the engineered S55D site is 15 times lower than that of the engineered G98D site.
Significantly, the disparate Ca2+-binding properties of S55D and G98D are mirrored in their backbone dynamics. Whereas the S2 values in G98D are uniformly higher than in wild-type β, those in S55D are uniformly lower, and whereas most of the amides in S55D show a lengthened correlation time for local motion, all of the amides in G98D can be modeled with the assumption of very rapid local motion (<20 psec). It is interesting that the additional carboxylate should have such different consequences in the CD and EF sites. The disparate impact of this sequence alteration may reflect the different environments of the two sites—the EF site positioned near the C terminus and the CD site sandwiched into the center of the molecule. As a result of its location near the C terminus, the F helix may be able to reorient so as to reduce the increased electrostatic repulsion without perturbing the remainder of the molecule. In contrast, any movements of the CD loop or flanking helical segments would require compensatory movements throughout the molecule.
Qualitatively, the lower S2 values and longer τe values might constitute evidence for generally increased conformational entropy in the S55D variant. This suggestion, like the earlier argument for a conformational change in the AB domain on Ca2+ binding, is based on the tacit assumption of an inverse correlation between main-chain order parameters and conformational entropy.
In fact, several investigators have derived quantitative relationships between NMR order parameters and thermodynamic quantities. Akke et al. (1993b) derived expressions relating free energy and the main-chain order parameter for several different models of N-H bond vector motion and applied them to the problem of Ca2+-binding by calbindin D9k. They concluded that the dominant free energy contribution accompanies binding of the first equivalent of Ca2+.
Yang and Kay (1996) subsequently developed entropy-order parameter relationships for 10 different models of bond vector motion, using both classic and quantum mechanical treatments. For values of S2 < 0.95, most models obeyed the following approximate relationship:
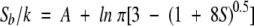 |
(1) |
in which k is the Boltzmann constant, Sb is the entropy associated with a particular bond vector, S is the order parameter for the bond, and A is a model-dependent constant. Moreover, they found that the entropy values and order parameters extracted for an assortment of backbone bond vectors, from an 800-psec molecular dynamics trajectory of RNase HI, were very well accommodated by an axially symmetric, diffusion-in-a-cone model, with A = 0.
The accuracy of the entropy-order parameter relationships hinges on two critical assumptions. First, it is assumed that the overall partition function for the system can be written as the product of the partition functions for the individual bond vectors. This simplification is correct, however, only if the motions of the individual vectors are not correlated, an approximation that may not be valid for all N-H vectors. The treatments further assume that observable and unobservable motions are not correlated, so that the partition function can be factored into observable and unobservable terms. However, if the two classes of motion are in fact independent, backbone dynamics measurements could conceivably overlook other significant entropic contributions. Side-chain picosecond–nanosecond motions, for example, may represent significant local conformational entropies (Li et al. 1996).
Relaxation measurements on calmodulin and a calmodulin-peptide complex formation (Lee et al. 2000) support the idea that side-chain and backbone motions can change independently. Whereas calmodulin side-chain order parameters show large and heterogeneous changes on complexation, main-chain order parameters are minimally perturbed. It may be that both backbone and side-chain relaxation measurements are required for a complete inventory of conformational entropy. In this context, it would be of interest to learn whether the differences in main-chain dynamics observed here between the β S55D and β G98D variants, as well as those observed between Ca2+-free and Ca2+-bound wild-type β, are reflected in the methyl-group dynamics as well.
Conclusions
Despite its higher net charge and reduced opportunities for stabilizing tertiary interactions, the rat β-parvalbumin shows an average S2 value virtually identical to that previously determined for the rat α isoform. However, in a residue-by-residue comparison, systematic differences are observed. Whereas rat α tends to display the higher order parameter in helical regions, β tends to display the higher value in loop regions. Regarding the latter, one region occurs in the AB domain, in the vicinity of Pro 21 and Pro 26. Another occurs in the CD-binding loop between residues 57–62. The presence of proline at positions 21 and 26 is apparently restricted to the mammalian β-parvalbumin and one of the two avian β isoforms (Hapak et al. 1993). And the sequence triad, Tyr 57, Leu 58, Asp 59, is unique to the mammalian β-parvalbumin.
Interestingly, the Ca2+-free form of rat β displays an average order parameter greater than that of the Ca2+-bound form. This result suggests that Ca2+-binding may provoke an energetically costly conformational rearrangement on Ca2+ binding—a potential explanation for the attenuated Ca2+ affinity of the β isoform.
Although the pentacarboxylate variants, S55D and G98D, both increase the Ca2+-binding affinity of rat β, the mutations have rather different effects on backbone dynamics. G98D increases the average order parameter; S55D decreases it. And whereas the behavior of all but three of the 86 residues analyzed in G98D can be described by the simplest model-free model (S2 only), 52 of the 93 amides analyzed in S55D require inclusion of τe, suggestive of impeded internal motion.
Materials and methods
Protein expression
Wild-type rat β-PV was expressed constitutively in Escherichia coli DH5α harboring the pLD2 expression vector, a derivative of pBluescript (Stratagene). The S55D and G98D variants were produced by oligonucleotide-directed mutagenesis as described elsewhere (Henzl et al. 1996a). 15N- or 13C,15N-labeled samples were purified from bacteria cultured on M9 minimal medium prepared with 15NH4Cl (1.25 g/L) or 15NH4Cl plus 13C6-glucose (2.5 g/L).
The purification scheme, using lysis, heat treatment at 80°C, anion exchange chromatography on DEAE-Sepharose, and gel filtration on Sephadex G-75, has been described previously (Hapak et al. 1989). Homogeneity was assessed by ultraviolet light absorbance (rat β-PV contains no tryptophan) and by polyacrylamide gel electrophoresis. Purity exceeded 98% in all samples. Before NMR analysis, the Ca2+-bound proteins were dialyzed against 100 μM Ca2+, to ensure that the Ca2+-binding sites were saturated.
NMR spectroscopy
The data presented here were acquired at 37°C on Varian Unity-500 (Ca2+-free and Ca2+-bound β-PV) and Bruker DRX-500 (β G98D and β S55D) spectrometers. The Varian instrument was equipped with waveform generators on all three channels, a pulsed-field gradient amplifier, and triple-resonance gradient probe. The Bruker instrument was equipped with a shielded triple resonance, triple-axis gradient probe. 1H and 15N carrier frequencies, respectively, were 499.88 and 50.66 mHz for Varian, 500.13 and 50.68 mHz for Bruker. 1H chemical shifts were referenced to the absolute 1H frequency of 0.1% TSP in D2O at 30°C at pH 7.3 (uncorrected), with an assigned chemical shift of 0 ppm. 15N shifts were referenced using the absolute frequency of acidic NH4Cl at 25°C, with an assigned chemical shift of 24.93 ppm.
Chemical shift assignments
Backbone amide chemical shift assignments for the Ca2+-bound wild-type β-PV at 37°C have been reported previously (Henzl et al. 1996b). Assignments for the Ca2+-free protein were obtained from CBCANH and CBCA(CO)NH experiments (Grzesiek and Bax 1992a,b). The similarity of 1H,15N-HSQC spectra of β G98D and β S55D to the wild-type spectrum permitted most backbone amide assignments to be made by inspection. In the case of G98D, the remaining assignments could be obtained by comparison of the crosspeak resonances in TOCSY-HSQC (Rance 1987) and NOESY-HSQC (Muhandiram et al. 1993) spectra. For the S55D variant, however, the TOCSY-HSQC and NOESY-HSQC data were of little utility. Instead, ambiguities were resolved by inspection of HNCACB (Wittekind and Mueller 1993) and CBCA(CO)NH data sets collected on a 13C,15N-labeled sample of the protein.
Relaxation parameters
Relaxation parameters were obtained for each of the assigned amide nitrogens by analysis of proton-detected 1H-15N heteronuclear correlation spectra. The protein samples (nominally 2 mM) contained 150 mM NaCl in 10% (v/v) D2O, adjusted to pH 6.0 (uncorrected for isotope effect). R1 and R2 values were measured for the wild-type β-parvalbumin, in both Ca2+-bound and Ca2+-free forms, using the pulse sequences described by Farrow et al. (1994). For β S55D and β G98D, measurements of R1, R2, and NOE, respectively, were performed using modified pulse sequences for inversion-recovery (Peng and Wagner 1992), CPMG (Kay et al. 1992) and 15N{1H} NOE (Kay et al. 1989). Our modifications included the addition of pulse-field gradients for artifact suppression (Bax and Pochapsky 1992) and 3–9–19 WATERGATE for water suppression (Sklenar et al. 1993). Relaxation delays of 1 to 2 sec were inserted between scans in the R1 and R2 experiments. A 5-sec relaxation delay was used in the NOE experiments. For the NOE determination, two spectra were acquired, with and without 3 sec of proton saturation during the 5-sec relaxation delay. The proton saturation was achieved by application of a train of high-power, 120 degree pulses, at 20-msec intervals. All spectra were recorded as 2048 × 160 complex matrices with spectral widths of 8000 and 1650 Hz for F2 and F1, respectively.
R1 delays
Ca2+-bound wild-type β-PV: 0.011, 0.067 (2), 0.155 (2), 0.244, 0.366 (2), 0.489, 0.533 (2), 0.622 (2), 0.755 (2), 1.154 (2), and 1.832 sec. The number in parentheses indicates acquisition of replicate data sets. Ca2+-free β-PV: 0.011, 0.067, 0.155, 0.244 (2), 0.366, 0.489, 0.533, 0.622, 0.755, and 1.154 sec. G98D: 0.002, 0.050 (2), 0.100, 0.150, 0.200, 0.300 (2), 0.500, 0.700, 1.000 (2), and 1.300 sec; S55D: 0.002, 0.101, 0.202 (2), 0.303, 0.404 (2), 0.505, 0.727, 0.909, and 1.212 sec.
R2 delays
Ca2+-bound wild-type β-PV: 0.015, 0.031, 0.046 (3), 0.061, 0.077 (2), 0.092, 0.108 (2), 0.123 (2), and 0.154 sec (2). Ca2+-free wild-type β: 0.015, 0.031, 0.046, 0.061 (2), 0.077, 0.092, 0.108, 0.123, and 0.154 sec. G98D: 0.008, 0.016, 0.032, 0.056 (2), 0.096, 0.144, 0.192, 0.240 (2), 0.304, and 0.400 sec. S55D: 0.008, 0.040 (2), 0.080, 0.160, 0.240 (2), 0.320, and 0.400 sec.
Data processing and analysis
All data were processed with NMR TRIAD software (TRIPOS Corporation) on an SGI Indigo computer. Apodization (sinebell-squared) and zero-filling were applied in both dimensions. A digital filter was used to remove the residual water signal in the directly acquired dimension, and a fourth-order polynomial baseline correction was likewise applied to the acquisition dimension.
Intensities, rather than integrated signal volumes, were used for the rate constant determinations. In general, signal intensities were measured on the processed two-dimensional spectra using the automated TRIAD peak-picking utility, with the aid of a macro called pikpk.spl (written by J.J.L.). When supplied with a table of peak locations (obtained by peak-picking an appropriate reference spectrum) and values for the baseline and threshold intensities, the macro returns a table of intensities for each peak in a two-dimensional spectrum of interest. Signals that had decayed to near zero were examined manually.
Extraction of 15N relaxation parameters
The relaxation behavior (R1, R2, and NOE) of an amide 15N nucleus is influenced (primarily) by the dipolar interaction with its attached proton and (secondarily) by the 15N chemical shift anisotropy (CSA). The strength of the dipolar interaction is determined by the motion of the N-H bond vector, which can be characterized by the magnitude of the spectral density function, J(ω), at five discrete frequencies. The spectral density at a specific frequency is proportional to the amplitude of the fluctuating magnetic field at that frequency. These relationships are described by the following equations (Abragam 1961):
 |
(2) |
 |
(3) |
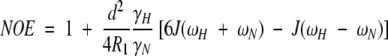 |
(4) |
in which
 |
is the permeability of free space; h is Planck's constant; γH and γN are the gyromagnetic ratios of 1H and 15N, respectively; rNH = 1.02 Å is the N-H bond length; ωH and ωN are the Larmor frequencies of 1H and 15N, respectively; and Δσ = −160 ppm is the CSA (Hiyama et al. 1988). The rNH and Δσ values are the default settings in Modelfree v.4.1.
Recently, it has been suggested that values of 1.04 and −170 ppm might be more appropriate for rNH and Δσ (Cornilescu and Bax 2000). An increase in N-H of 0.01 Å increase S2 by ∼6% (Kay et al. 1989). However, we are less concerned with the exact values of the order parameters than with the changes that occur on Ca2+ binding or mutation of a binding loop residue. Moreover, retention of the default values permits direct comparison between the order parameters for rat β isoform and those measured previously for rat α (Baldellon et al. 1998).
R1 values were obtained by fitting the data to either a two-parameter single-exponential decay function (for the Ca2+-bound and Ca2+-free wild-type β samples) or to a three-parameter inversion-recovery equation (S55D and G98D). R2 values were obtained for all four samples with a two-parameter nonlinear optimization. The steady state NOE values were determined from the ratios of the average intensities of the peaks with and without proton saturation (Palmer et al. 1991).
The R1 and R2 calculations were performed on either an SGI Indigo or SGI O2 computer, using curve-fitting software generously developed by Professor Arthur G. Palmer and coworkers. Select analyses were also performed on a Power Macintosh, using SigmaPlot (SPSS Science). In every case examined, the two methods yielded identical values for R1 and R2.
The uncertainties obtained from duplicate spectra generally underestimated the error, resulting in unacceptably large χ2 values for the R1 and R2 fits. When this occurred, curve-fitting was repeated, using an incrementally larger value for the uncertainty, until satisfactory χ2 and uncertainty values were obtained for every R1 and R2.
Model-free calculations
Model-free calculations were performed with the program Modelfree (v. 4.1), provided by Dr. Arthur G. Palmer III (Columbia University), utilizing the R1, R2, and NOE relaxation parameters and an axially symmetric diffusion model. This program describes the motional behavior of an N-H bond by one of five different models (model notation adapted from Seewald et al. 2000). For a molecule undergoing axially symmetric rotational diffusion, the general equation of the spectral density function takes the form:
 |
(5) |
In this treatment, the generalized order parameter S2 = Sa2Sb2 characterizes the overall degree of spatial restriction of the internal motion of the 1H-15N bond vector. Sa2 and Sb2 are individual order parameters for internal motions on two distinct timescales. τm = (2D∥ + 4D⊥)−1 is the effective rotational correlation time for the entire molecule. τ`j = τjτe/(τj + τe), where τe is the effective correlation time for rapid internal motions of the N-H vector; τ1−1 = 6D⊥; τ2−1 = 5D⊥ + D∥; and τ3−1 = 2D⊥ + 4D∥. D∥ and D⊥ are the diffusion coefficients for rotation about the unique and perpendicular axes, respectively; A1 = (3cos2θ−1)2/4; A2 = 3sin2θcos2θ; A3 = (3/4)sin4θ; and θ is the angle between the N-H bond vector and the unique axis of the principal frame of the diffusion tensor.
The models are typically numbered 1–5, in order of increasing complexity. Model 1 describes N-H bond vectors displaying internal motion on a single, very fast (≤20 psec) timescale. Only Sb2 is optimized. Sa2 = 1; τe = Rex = 0, where Rex is the rate of chemical or conformational exchange.
Model 2 likewise describes NH groups undergoing internal motion on a single, but somewhat slower (20–500 psec), timescale. Sb2 and τe are optimized. Sa2 = 1; Rex = 0.
Models 3 and 4 resemble models 1 and 2, respectively, except that Rex (in Equation 3) is also optimized. Thus, in model 3, Sb2 and Rex are optimized; in model 4, Sb2, τe, and Rex are optimized. Sa2 = 1.
Model 5 (Clore et al. 1990a,1990b) is used to treat NH vectors having internal motions that occur on two timescales faster than the overall rotational correlation time.
Sa2is relabeled Sf2, the order parameter for very fast motion (≤20 psec); Sb2 becomes Ss2, the order parameter for slower internal motions (20–500 psec).
Model selection for each residue utilized the parsimonious strategy outlined by Mandel et al. (1995). All but two of the N-H bond vectors in the four samples discussed herein were accommodated by either model 1, 2, or 3. The exceptions were A14 and Q19 in the data set for Ca2+-free β, for which none of the models yielded a satisfactory fit. Model 1 was arbitrarily applied to these residues because the improvement in χ2 was not sufficient to justify inclusion of additional parameters. Final optimization of the overall rotational diffusion model and the internal motional parameters for each spin was performed using the Powell algorithm. Five hundred simulated data sets were used to evaluate the model-free analyses used for both model selection and final optimization. Initial estimates of the overall correlation time τm, rotational diffusion tensor, and principal moments of inertia tensor were obtained with software provided by A.G. Palmer, using the trimmed R2/R1 mean.
Sedimentation equilibrium
Sedimentation equilibrium analyses of Ca2+-loaded β, β S55D, β G98D, and Ca2+-free β were conducted in a Beckman XL-I optima analytical ultracentrifuge. The samples were loaded into six-sector centerpieces and centrifuged to equilibrium at 20°C in an An50Ti rotor, at a rotor speed of 20,000 rpm. Each sample was examined at three loading concentrations—∼150 μM, 600 μM, and 2.4 mM. Data were acquired with both absorbance and interference optics and were analyzed using software supplied with the instrument. A partial specific volume of 0.724, calculated from the amino acid composition (Gillen et al. 1987), was used in the calculations. The contribution of the bound Ca2+ to the partial specific volume was ignored. The solvent density was 1.00.
Electronic supplemental material
Tables of the R1, R2, and NOE values are available for each of the four samples examined in this study.
Acknowledgments
This work was supported by NSF award MCB9603877 (to M.T.H.), and NSF award CHE-89–08304 assisted with purchase of the Bruker DRX500 spectrometer used in these studies. We thank Dr. Mikael Akke for his helpful discussions and for providing modifications on data processing programs. We also thank Dr. Steve Van Doren and his group members for providing access to their pulse sequences for certain of the NMR experiments.
The publication costs of this article were defrayed in part by payment of page charges. This article must therefore be hereby marked "advertisement" in accordance with 18 USC section 1734 solely to indicate this fact.
Abbreviations
CD site, parvalbumin Ca2+-binding site spanning residues 41–70 and including the C and D helices
EF site, parvalbumin Ca2+-binding site spanning residues 80–108 and including the E and F helices
Hepes, 4–(2-hydroxyethyl)-1-piperazinesulfonic acid
HSQC, heteronuclear single quantum coherence
NMR, nuclear magnetic resonance
NOESY, nuclear Overhauser effect spectroscopy
PV, parvalbumin
TOCSY, total correlated spectroscopy.
Article and publication are at http://www.proteinscience.org/cgi/doi/10.1101/ps.18102.
References
- Abragam, A. 1961. Principles of nuclear magnetism. Clarendon Press, Oxford.
- Ahmed, F.R., Rose, D.R., Evans, S.V., Pippy, M.E., and To, R. 1993. Refinement of recombinant oncomodulin at 1.30 A resolution. J. Mol. Biol. 230 1216–1224. [DOI] [PubMed] [Google Scholar]
- Akke, M., Skelton, N.J., Kördel, J., Palmer, A.G., and Chazin, W.J. 1993a. Effects of ion binding on the backbone dynamics of calbindin D9k determined by 15N NMR relaxation. Biochemistry 32 9832–9844. [DOI] [PubMed] [Google Scholar]
- Akke, M., Bruschweiler, R., and Palmer, A.G. 1993b. NMR order parameters and free energy: An analytical approach and its application to cooperative Ca2+ binding to calbindin D9k. J. Am. Chem. Soc. 115 9832–9833. [Google Scholar]
- Baldellon, C., Alattia, J.-R., Strub, M.-P., Pauls, T., Berchtold, M.W., Cavé, A., and Padilla, A. 1998. 15N NMR relaxation studies of calcium-loaded parvalbumin show tight dynamics compared to those of other EF-hand proteins. Biochemistry 37 9964–9975. [DOI] [PubMed] [Google Scholar]
- Barbato, G., Ikura, M., Kay, L.W., Pastor, R.W., and Bax, A. 1992. Backbone dynamics of calmodulin studied by 15N relaxation using inverse detected two-dimensional NMR spectroscopy: The central helix is flexible. Biochemistry 31 5269–5278. [DOI] [PubMed] [Google Scholar]
- Bax, A. and Pochapsky, S.S. 1992. Optimized recording of heteronuclear multidimensional NMR spectra using pulsed field gradients. J. Magn. Reson. 99 638–643. [Google Scholar]
- Berridge, M.J. 1997. Elementary and global aspects of calcium signalling. J. Physiol. 499 291–306. [DOI] [PMC free article] [PubMed] [Google Scholar]
- Bevington, P.R. and Robinson, D.K. 1992. Data reduction and error analysis for the physical sciences. McGraw-Hill, Boston.
- Celio, M.R., Pauls, T., and Schwaller, B. 1996. Guidebook to the calcium-binding proteins. Oxford University Press, New York.
- Clore, G.M., Szabo, A., Bax, A., Kay, L.E., Driscoll, P.C., and Gronenborn, A.M. 1990a. Deviations from the simple two-parameter model-free approach to the interpretation of nitrogen-15 nuclear magnetic relaxation of proteins. J. Am. Chem. Soc. 112 4989–4991. [Google Scholar]
- Clore, G.M., Driscoll, P.C., Wingfield, P.T., and Gronenborn, A.M. 1990b. Analysis of the backbone dynamics of interleukin-1β using two-dimensional inverse detected heteronuclear 15N-1H NMR spectroscopy. Biochemistry 29 7387–7401. [DOI] [PubMed] [Google Scholar]
- Cornilescu, G. and Bax, A. 2000. Measurement of proton, nitrogen, and carbonyl chemical shielding anisotropies in a protein dissolved in a dilute liquid crystalline phase. J. Am. Chem. Soc. 122 10143–10154. [Google Scholar]
- Cox, J.A., Milos, M., and MacManus, J.P. 1990. Calcium- and magnesium-binding properties of oncomodulin. J. Biol. Chem. 265 6633–6637. [PubMed] [Google Scholar]
- Dellwo, M.J. and Wand, A.J. 1989. Model-independent and model-dependent analysis of the global and internal dynamics of cyclosporin A. J. Am. Chem. Soc. 111 4571–4578. [Google Scholar]
- Eberhard, M. and Erne, P. 1994. Calcium and magnesium binding to rat parvalbumin. Eur. J. Biochem. 222 21–26. [DOI] [PubMed] [Google Scholar]
- Epstein, P., Means, A.R., and Berchtold, M.W. 1986. Isolation of a rat parvalbumin gene and full length cDNA. J. Biol. Chem. 261 5886–5891. [PubMed] [Google Scholar]
- Evenäs, J., Forsén, S., Malmendal, A., and Akke, M. 1999. Backbone dynamics and energetics of a calmodulin domain mutant exchanging between closed and open conformations. J. Mol. Biol. 289 603–617. [DOI] [PubMed] [Google Scholar]
- Falke, J.J., Drake, S.K., Hazard, A.L., and Peersen, O.B. 1994. Molecular tuning of ion binding to calcium signaling proteins. Q Rev Biophys 27 219–290. [DOI] [PubMed] [Google Scholar]
- Farrow, N.A., Muhandiram, R., Singer, A.U., Pascal, S.M., Kay, C.M., Gish, G., Shoelson, S.E., Pawson, T., Forman-Kay, J.D., and Kay, L.E. 1994. Backbone dynamics of a free and a phosphopeptide-complexed Src homology 2 domain studied by 15N NMR relaxation. Biochemistry 33 5984–6003. [DOI] [PubMed] [Google Scholar]
- Gillen, M.F., Banville, D., Rutledge, R.G., Narang, S., Seligy, V.L., Whitfield, J.F., and MacManus, J.P. 1987. A complete complementary DNA for the oncodevelopmental calcium-binding protein, oncomodulin.J. Biol. Chem. 262 5308–5312. [PubMed] [Google Scholar]
- Grzesiek, S. and Bax, A. 1992a. An efficient experiment for sequential backbone assignment of medium-sized isotopically enriched proteins. J. Magn. Reson. 99 201–207. [Google Scholar]
- ———. 1992b. Correlating backbone amide and side chain resonances in larger proteins by multiple relayed triple resonance NMR. J. Am. Chem. Soc. 114 6291–6293. [Google Scholar]
- Hapak, R.C., Lammers, P.J., Palmisano, W.A., Birnbaum, E.R., and Henzl, M.T. 1989. Site-specific substitution of glutamate for aspartate at position 59 of rat oncomodulin. J. Biol. Chem. 264 18751–18760. [PubMed] [Google Scholar]
- Hapak, R.C., Zhao, H., Boschi, J.M., and Henzl, M.T. 1993. Novel avian thymic parvalbumin exhibits high degree of sequence homology to oncomodulin. J. Biol. Chem. 269 5288–5296. [PubMed] [Google Scholar]
- Henzl, M.T. and Graham, J.S. 1999. Conformational stabilities of the rat α- and β parvalbumins. FEBS Lett. 442 241–245. [DOI] [PubMed] [Google Scholar]
- Henzl, M.T., Hapak, R.C., and Goodpasture, E.A. 1996a. Introduction of fifth carboxylate ligand heightens affinity of the oncomodulin CD and EF sites for Ca2+. Biochemistry 35 5856–5869. [DOI] [PubMed] [Google Scholar]
- Henzl, M.T., Likos, J.J., and Hutton, W.C. 1996b. 1H, 13C, and 15N assignments for the Ca2+-bound form of oncomodulin, a β-parvalbumin. Protein Pept. Lett. 3 59–66. [Google Scholar]
- Henzl, M.T., Shibasaki, O., Comegys, T.H., Thalmann, I., and Thalmann, R. 1997. Oncomodulin is abundant in the organ of corti. Hear. Res. 106 105–111. [DOI] [PubMed] [Google Scholar]
- Henzl, M.T., Larson, J.D., and Agah, S. 2000. Influence of monovalent cations on rat α- and β-parvalbumin stabilities. Biochemistry 39 5859–5867. [DOI] [PubMed] [Google Scholar]
- Hiyama, Y., Niu, C.H., Silverton, J.V., Bavoso, A., and Torchia, D.A. 1988. Determination of 15N chemical shift tensor via 15N-2H dipolar coupling in Boc-glycyl-glycyl [15N]glycine bensyl ester. J. Am. Chem. Soc. 110 2378–2383. [Google Scholar]
- Kay, L.E., Torchia, D.A., and Bax, A. 1989. Backbone dynamics of proteins as studied by 15N inverse detected heteronuclear NMR spectroscopy: Application to staphylococcal nuclease. Biochemistry 28 8972–8979. [DOI] [PubMed] [Google Scholar]
- Kay, L.E., Nicholson, L.K., Delaglio, F., Bax, A., and Torchia, D.A. 1992. Pulse sequences for removal of the effects of cross correlation between dipolar and chemical-shift anisotropy relaxation mechanisms on the measurement of heteronuclear T1 and T2 values in proteins. J. Magn. Reson. 97 359–375. [Google Scholar]
- Kördel, J., Skelton, N.J., Akke, M., Palmer, III, A.G., and Chazin, W.J. 1992. Backbone dynamics of calcium-loaded calbindin D9k studied by two-dimensional proteon-detected 15NNMR spectroscopy. Biochemistry 31 4856–4866. [DOI] [PubMed] [Google Scholar]
- Kraulis, P.J. 1991. MOLSCRIPT: A program to produce both detailed and schematic plots of protein structures. J. Appl. Crystallogr. 24 946–950. [Google Scholar]
- Kretsinger, R.H. 1980. Structure and evolution of calcium modulated proteins. CRC Crit. Rev. Biochem. 8 115–164. [DOI] [PubMed] [Google Scholar]
- Kretsinger, R.H. and Nockolds, C.E. 1973. Carp muscle calcium-binding protein. II. Structure determination and general description. J. Biol. Chem. 248 3313–3326. [PubMed] [Google Scholar]
- Lee, A.L. and Wand, A.J. 1999. Assessing potential bias in the determination of rotational correlation times of proteins by NMR relaxation. J. Biomol. NMR 13 101–112. [DOI] [PubMed] [Google Scholar]
- ———. 2001. Microscopic origins of entropy, heat capacity and the glass transition in proteins. Nature 411 501–504. [DOI] [PubMed] [Google Scholar]
- Lee, A.L., Kinnear, S., and Wand, A.J. 2000. Redistribution and loss of side chain entropy upon formation of a calmodulin-peptide complex. Nat. Struct. Biol. 7 72–77. [DOI] [PubMed] [Google Scholar]
- Lefevre, J.F., Dayie, K.T., Peng, J.W., and Wagner, G. 1996. Internal mobility in the partially folded DNA binding and dimerization domains of GAL4: NMR analysis of the N-H spectral density functions. Biochemistry 35 2674–2686. [DOI] [PubMed] [Google Scholar]
- Li, Z., Raychaudhuri, S., and Wand, A.J. 1996. Insights into the local residual entropy of proteins provided by NMR relaxation. Protein Sci. 5 2647–2650. [DOI] [PMC free article] [PubMed] [Google Scholar]
- Linse S. and Forsén, S. 1995. Determinants that govern high-affinity calcium binding. Adv. Second Messenger Phosphoprotein Res. 30 89–151. [DOI] [PubMed] [Google Scholar]
- Lipari, G. and Szabo, A. 1982a. Model-free approach to the interpretation of nuclear magnetic resonance relaxation in macromolecules. 1. Theory and range of validity. J. Am. Chem. Soc. 104 4546–4559. [Google Scholar]
- ———. 1982b. Model-free approach to the interpretation of nuclear magnetic resonance relaxation in macromolecules. 2. Analysis of experimental results. J. Am. Chem. Soc. 104 4559–4570. [Google Scholar]
- Mäler, L., Blankenship, J., Rance, M., and Chazin, W.J. 2000. Site-site communication in the EF-hand Ca2+-binding protein calbinin D9k. Nat. Struct. Biol. 7 245–250. [DOI] [PubMed] [Google Scholar]
- Malmendal, A., Carlström, G., Hambraeus, C., Drakenberg, T., Forsén, S., and Akke, M. 1998. Sequence and context dependence of EF-hand loop dynamics. An 15N relaxation study of a calcium-binding site mutant of calbindin D9k. Biochemistry 37 2596–2595. [DOI] [PubMed] [Google Scholar]
- Malmendal, A., Evenäs, J., Forsén, S., and Akke, M. 1999. Structural dynamics in the C-terminal domain of calmodulin at low calcium levels. J. Mol. Biol. 293 883–899. [DOI] [PubMed] [Google Scholar]
- Mandel, A.M., Akke, M., and Palmer, A.G. 1995. Backbone dynamics of Escherichia coli ribonuclease Hl: Correlations with structure and function in an active enzyme. J. Mol. Biol. 246 144–163. [DOI] [PubMed] [Google Scholar]
- Marsden, B.J., Hodges, R.S., and Sykes, B.D. 1988. 1H NMR studies of synthetic peptide analogues of calcium-binding site III of rabbit skeletal troponin C: Effect on the lanthanum affinity of the interchange of aspartic acid and asparagines residues at the metal ion coordinating positions. Biochemistry 27 4198–4206. [DOI] [PubMed] [Google Scholar]
- Moncrief, N.D., Kretsinger, R.H., Goodman, M. 1990. Evolution of EF-hand calcium-modulated proteins. I. Relationships based on amino acid sequences. J. Mol. Evol. 30 522–562. [DOI] [PubMed] [Google Scholar]
- Muhandiram, D.R., Farrow, N.A., Xu, G., Smallcombe, S.H., and Kay. L.E. 1993. A gradient 13C NOESY-HSQC experiment for recording NOESY spectra of 13C-labeled proteins dissolved in H2O. J. Magn. Reson. B102 317–321. [Google Scholar]
- Palmer, A.G., Rance, M., and Wright, P.E. 1991. Intramolecular motions of a zinc finger DNA-binding domain from X fin characterized by proton-detected natural abundance 13C heteronuclear NMR spectroscopy. J. Am. Chem. Soc. 113 4371–4380. [Google Scholar]
- Palmer, A.G., Williams, J., and McDermott, A. 1996. Nuclear magnetic resonance studies of biopolymer dynamics. J. Phys. Chem. 100 13293–13310. [Google Scholar]
- Palmisano, W.A., Trevino, C.L., and Henzl, M.T. 1990. Site-specific replacement of amino acid residues within the CD binding loop of rat oncomodulin. J. Biol. Chem. 265 14450–14456. [PubMed] [Google Scholar]
- Pauls, T.L., Durussel, I., Cox, J.A., Clark, I.D., Szabo, A.G., Gagne, S.M., Sykes, B.D., and Berchtold, M.W. 1993. Metal binding properties of recombinant rat parvalbumin wild-type and F102W mutant. J. Biol. Chem. 268 20897–20903. [PubMed] [Google Scholar]
- Pauls, T.L., Cox, J.A., and Berchtold, M.W. 1996. The Ca2+-binding proteins parvalbumin and oncomodulin and their genes: New structural and functional findings. Biochim. Biophys. Acta 1306 39–54. [DOI] [PubMed] [Google Scholar]
- Peng, J.W. and Wagner, G. 1992. Mapping of spectral density functions using heteronuclear NMR relaxation measurements. J. Magn. Reson. 98 308–332. [Google Scholar]
- ———. 1994. Investigation of protein motions via relaxation measurements. Methods Enzymol. 239 563–619. [DOI] [PubMed] [Google Scholar]
- Rance, M. 1987. Improved techniques for homonuclear rotating-frame and isotropic mixing experiments. J. Magn. Reson. 74 557–564. [Google Scholar]
- Reid, R.E. and Hodges, R.S. 1980. Cooperativity and calcium/magnesium binding to troponin C and muscle calcium binding parvalbumin: An hypothesis. J. Theoret. Biol. 84 401–444. [DOI] [PubMed] [Google Scholar]
- Schneider, D.M., Dellwo, M.J., and Wand, A.J. 1992. Fast internal main-chain dynamics of human ubiquitin. Biochemistry 31 3645–3652. [DOI] [PubMed] [Google Scholar]
- Seamon, K.B. and Kretsinger, R.H. 1983. Calcium-modulated proteins. In Calcium in biology, (ed. T.G. Spiro), pp. 3–51. John Wiley and Sons, New York.
- Seewald, M.J., Pichumani, K., Stowell, C., Tibbals, B.V., Regan, L., and Stone, M.J. 2000. The role of backbone conformational heat capacity in protein stability: Temperature dependent dynamics of the B1 domain of Streptococcal protein G. Protein Sci. 9 1177–1193. [DOI] [PMC free article] [PubMed] [Google Scholar]
- Skelton, N.J., Kördel, J., Akke, M., and Chazin, W.J. 1992. Nuclear magnetic resonance studies of the internal dynamics in apo (Cd2+)1, and (Ca2+)2 calbindin D9k. J. Mol. Biol. 227 1100–1117. [DOI] [PubMed] [Google Scholar]
- Sklenar, V., Piotto, M., Leppik, R., and Saudek, V. 1993. Gradient-tailored water suppression for 1H-15N HSQC experiments optimized to retain full sensitivity. J. Magn. Reson. 102A 241–245. [Google Scholar]
- Tjandra, N., Feller, S.E., Pastor, R.W., and Bax, A. 1995a. Rotational diffusion anisotropy of human ubiquitin from 15N relaxation. J. Am. Chem. Soc. 117 12562–12566. [Google Scholar]
- Tjandra, N., Kuboniwa, H., Ren, H., and Bax, A. 1995b. Rotational dynamics of calcium-free calmodulin studied by 15N relaxation measurements. Eur. J. Biochem. 230 1014–1024. [DOI] [PubMed] [Google Scholar]
- Wittekind, M. and Mueller, L. 1993. HNCACB, a high-sensitivity 3D NMR experiment to correlate amide-proton and nitrogen resonances with the alpha- and beta-carbon resonances in proteins. J. Magn. Reson. B 101 201–205. [Google Scholar]
- Wnuk, W., Cox, J.A., and Stein, E.A. 1982. Parvalbumins and other soluble high affinity calcium-binding proteins from muscle. In Calcium and cell function, vol 2., (ed. W. Cheung), pp. 243–278. Academic Press, New York.
- Yang, D. and Kay, L.E. 1996. Contributions to conformational entropy arising from bond vector fluctuations measured from NMR-derived order parameters: Application to protein folding. J. Mol. Biol. 263 369–382. [DOI] [PubMed] [Google Scholar]