

Abstract
Catalases, although synthesized from single genes and built up from only one type of subunit, exist in heterogeneous form with respect to their conformations and association states in biological systems. This heterogeneity is not of genetic origin, but rather reflects the instability of this oligomeric heme enzyme. To understand better the factors that stabilize the various association states of catalase, we performed studies on the multimeric intermediates that are stabilized during guanidine-hydrochloride- and urea-induced unfolding of bovine liver catalase (BLC). For the first time, we have observed an enzymatically active, folded dimer of native BLC. This dimer has slightly higher enzymatic activity and altered structural properties compared to the native tetramer. Comparative studies of the effect of NaCl, GdmCl, and urea on BLC show that cation binding to negatively charged groups present in amino acid side chains of the enzyme leads to stabilization of an enzymatically active, folded dimer of BLC. Besides the folded dimer, an enzymatically active expanded tetramer and a partially unfolded, enzymatically inactive dimer of BLC were also observed. A complete recovery of native enzyme was observed on refolding of expanded tetramers and folded dimers; however, a very low recovery (maximum of ∼5%) of native enzyme was observed on refolding of partially unfolded dimers and fully unfolded monomers.
Keywords: Bovine liver catalase, multimeric enzyme, association states, denaturants, expanded tetramer, active dimers
The important regulatory role of multi-subunit proteins and multi-protein complexes in biological systems is widely recognized. Multimeric enzymes provide an attractive system for investigating spontaneous self-assembly of protein structures and for examining regulatory interactions between subunits. Several studies show clearly that quaternary structure plays a fundamental role in the stabilization of the native protein form (Mei et al. 1997; Gokhale et al. 1999; Jaenicke and Lilie 2000). Understanding the folding/unfolding and self-assembly processes of such macromolecules remains a major problem in protein chemistry. Although inter- and intra-subunit interactions in oligomeric and monomeric proteins are of same physical nature, the denaturation/renaturation reactions in oligomeric proteins are more complex than those of smaller monomeric proteins and involve many local and global processes that occur by sequential and/or concerted mechanisms (Jaenicke 1987; Seckler and Jaenicke 1992). Hence, the elucidation of the hierarchy of events occurring during the denaturation of an oligomeric protein provides an important means for delineating such a process.
Catalase (H2O2: H2O2 oxidoreductase EC 1.11.1.6) is a highly active, ubiquitous enzyme which occurs in almost all aerobically respiring organisms and serves in part to protect the cells from the toxic effects of hydrogen peroxide. The properties of catalase have been investigated extensively, but a diversity of opinion remains as to the extent and nature of multiplicity of this enzyme (Masters et al. 1986). Differing numbers of catalase heteromorphs have been resolved from mammalian tissue and liver extracts (Jones and Masters 1975; Scherz et al. 1976; Miyahara et al. 1978; Masters et al. 1986). These heteromorphs can be interconverted in vitro. Five multiple forms of BLC, which are concomers of a single molecule, have been reported (Kuntz et al. 1978). They differ with respect to packing and mobility of the polypeptide chains as studied by small angle X-ray scattering (Kuntz et al. 1978). Dissociation and, hence, inactivation of tetrameric catalase occurs under physiological conditions (George 1949). Preparations of catalase from normal erythrocytes or liver usually contain small amounts of inactive dimers and monomers besides the major population of enzymatically active tetramers (Wiemer et al. 1992). This complex multiplicity of catalase stands in contrast to the simple chemical and genetic picture of the enzyme. Chemical studies on BLC have shown that the enzyme consists of four identical subunits (Tanford and Lovrien 1962; Sund et al. 1967; Schroeder et al. 1969). Genetic studies, utilizing the congenital defect acatalasemia in humans and mice, have indicated that a single structural gene is responsible for the total synthesis of the enzyme (Feinstein 1970; Holmes and Duley 1975). Hence, it seems that the heterogeneity of the catalase population in biological systems is probably not of genetic origin but rather reflects the instability of catalase oligomers. This idea is further supported by in vitro observations that lyophilization or storing of catalase solution enhances the dimer and monomer populations (Disseroth and Dounce 1967).
Bovine liver catalase (BLC; Mr 240,000) contains four identical subunits (each Mr 57,000) equipped with a high-spin Fe (III) protoporphyrin IX (Murthy et al. 1981). Dissociation of BLC into subunits is observed at pH extremes (Samejima et al. 1962Samejima et al. 1981; Prajapati et al. 1998), by action of denaturants such as sodium n-dodecyl sulfate (SDS; Jones et al. 1982), and on lyophilization (Disseroth and Dounce 1967). Succinylation and acetylation (Furuta et al. 1974) of BLC has also been reported to lead to dissociation resulting in stabilization of dimers. However, in all these cases only enzymatically inactive dimers or monomers were observed.
We have performed a systematic investigation on the effect of increasing concentrations of guanidine hydrochloride and urea on the functional and structural parameters of BLC. The denaturant-induced unfolding of catalase was found to be a multiphasic process with stabilization of several unique oligomeric intermediates. For understanding the mechanism of stabilization of enzymatically active dimers of catalase observed during GdmCl-induced denaturation of BLC, comparative studies on the effect of NaCl on the enzyme were performed.
Results
Time-dependent changes in BLC structure and enzymatic activity under various denaturant conditions were monitored to study the time required for reaching equilibrium state under these conditions. Figure 1 ▶ summarizes the time-dependent changes in Soret absorption (405 nm) and enzymatic activity at increasing GdmCl concentrations at 4°C. At 0.2 M GdmCl, both absorption at 405 nm and enzymatic activity were found to increase up to 3 h; additional increase in time up to 12 h showed no further change in observed values (Figs. 1A,B ▶). However, at higher GdmCl concentrations, 1.2 M and 2 M, at which a significant decrease in Soret absorption (at 405 nm) and almost complete loss of enzymatic activity was observed, a maximum time of 1 h and 0.15 h, respectively, was required for achieving equilibrium. These observations indicate a faster kinetics of conformational change at higher GdmCl compared to that at low GdmCl. Time-dependent studies were also performed for urea denaturation of BLC at 4°C (not shown) and a maximum time of 2 h was found to be sufficient for acquiring equilibrium under any urea concentration. Hence, an incubation time of 6 h was maintained for all the studies.
Fig. 1.

Time-dependent changes in the enzymatic activity (A) and absorbance at 405 nm (B) for native BLC at various GdmCl concentrations. A BLC concentration of 2 μM was used and the incubation and measurements were performed at 4°C. The various symbols used in the figure represent the following GdmCl concentrations: 0.2 M (open circles), 1.2 M (open triangles), and 2 M (filled triangles).
As an enhancement in enzymatic activity was observed for BLC at 0.2 M GdmCl, studies were performed to ensure whether this was as a consequence of GdmCl-induced conformational change in the enzyme under these conditions or of activation of the enzyme owing to the presence of GdmCl. The presence of 0.1–0.5 M GdmCl in the assay reaction mixture (i.e., interaction of GdmCl with the enzyme for a very short time period) did not result in any change in enzymatic activity of native BLC; however, at the same GdmCl concentration in preincubations of the enzyme, an enhancement in enzymatic activity was observed. These observations show that low concentrations of GdmCl induce conformational changes in BLC leading to stabilization of a conformation with enhanced enzymatic activity as compared to native enzyme. Furthermore, the time-dependent slow changes in the enzymatic activity and structural parameters (Fig.1A ▶) observed under these conditions also indicate a GdmCl-induced, slow conformational change in the enzyme.
Changes in molecular properties of BLC associated with GdmCl-induced unfolding
Enzyme activity can be regarded as the most sensitive probe for studying protein folding and unfolding as it reflects subtle readjustments at the active site, allowing very small conformational variations of an enzyme structure to be detected. Figure 2 ▶ shows the changes in enzymatic activity of BLC as a function of GdmCl concentration at 4°C. An initial slight enhancement in the enzymatic activity (maximum ∼17%) compared to native BLC was observed between 0 and 0.3 M GdmCl. A similar enhancement (∼20%) of enzymatic activity at 0.25 M GdmCl has been reported for porcine erythrocyte catalase (Takeda et al. 1983). However, from 0.3 to 1.25 M GdmCl, a sharp decrease in enzymatic activity from 100% to ∼5% occurred; a complete loss of enzymatic activity was observed >1.5 M GdmCl.
Fig. 2.

Changes in enzymatic activity (circles) and Soret absorption at 405 nm (diamonds) of BLC with increasing concentrations of GdmCL. The measurements correspond to a BLC concentration of 2 μM. The closed circles represent data for native BLC and the open circles data for 0.3 M NaCl-stabilized BLC. The enzyme was incubated at a desired GdmCl concentration for 6 h at 4°C and the activity was measured at the temperature of incubation by the method described in Materials and Methods.
The enzymatic activity of BLC incubated with 0.3 M NaCl or KCl was found to be ∼18% enhanced compared to the native enzyme (Fig. 2 ▶). GdmCl-induced denaturation of the 0.3M NaCl-stabilized BLC showed that low GdmCl concentrations (up to 0.5M) did not induce any change in enzymatic activity (Fig. 2 ▶). This contrasts a significant enhancement in enzymatic activity observed for native catalase under similar GdmCl concentrations. However, at higher concentration of GdmCl, a decrease in BLC activity similar to that for native enzyme was observed. An interesting observation was that the NaCl-stabilized BLC showed a higher stability against GdmCl denaturation as a shift in the denaturation curve to higher GdmCl concentration, compared to that for the native enzyme (Fig. 2 ▶).
Soret absorption is a good intrinsic probe of catalase for monitoring the interaction of the heme group with the protein moiety and shows characteristic alterations in relation to enzyme denaturation (Takeda et al. 1983). For native BLC, the Soret absorption maximum was observed at 405 nm. Figure 2 ▶ summarizes the effect of increasing GdmCl (0–3 M) on the Soret absorption of native BLC. A complex dependence of Soret absorption at 405 nm of BLC was observed with increasing concentrations of GdmCl. At low GdmCl (0–0.4 M), a slight enhancement in Soret absorption (from 0.381 to 0.408) without any shift in wavelength maxima (λmax) of absorption as compared to native enzyme was observed. An increase in GdmCl concentration from 0.5 to 1.2 M resulted in a sharp, large decrease in absorption intensity from 0.408 to 0.218 along with a shift in λmax of absorption from 405 to 412 nm. Further increase of GdmCl concentration up to 3M showed no further change in Soret absorption characteristics. The low intensity of Soret absorption with λmax of absorption of 412 nm suggests a breakage of some of the haemin-protein bonds present in the native enzyme (Furuta 1974; Takeda et al. 1983).
If a significant difference exists between the fluorescence emission wavelength maxima of native and denatured proteins, correlation between the GdmCl concentration and the fractional changes in wavelength at which fluorescence emission is maximal provides useful information on the stabilization of intermediates during protein unfolding (Parr and Hammes 1975). For BLC, the value of the emission wavelength maximum in the absence of GdmCl (fo) and at GdmCl concentration >4 M (fd) were 329–330 nm and 350–352 nm, respectively. The fractional change in wavelength at which the tryptophan fluorescence emission spectrum of BLC is maximal is plotted against the concentration of GdmCl in Figure 3A ▶. Two well-separated transitions were observed for 0.5 μM BLC. The first transition was very sharp and occurred between 0 and 0.2 M GdmCl. A plateau region existed from 0.2 to 0.5 M GdmCl and was followed by a second transition that was essentially complete at 3.5 M GdmCl. Studies using a higher BLC concentration, 5 μM, showed a significantly different profile. There was no distinct transition, but a slight hump was observed at low GdmCl concentrations (0.2–0.4 M), followed by a transition between 0.5 and 3.5 M GdmCl. These observations indicate that the population of intermediates of BLC stabilized at low GdmCl concentration is dependent on BLC concentration, indicating the possibility of dissociation of native BLC under these conditions because the equilibrium between the tetramer and the dissociated species was found to be dependent on BLC concentration.
Fig. 3.
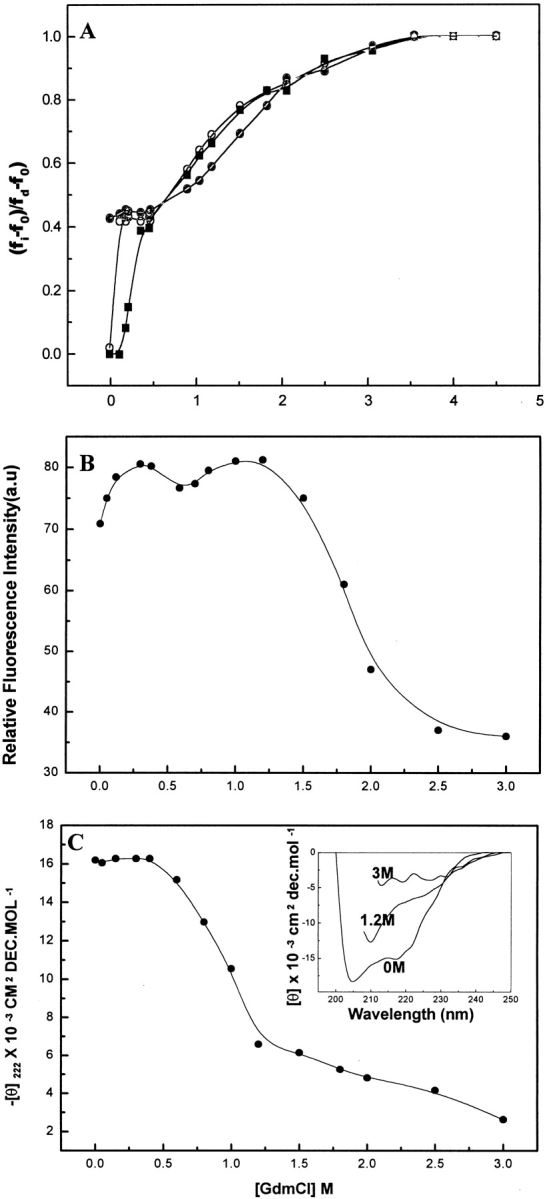
(A) Plot of the fractional change in the wavelength of maximum fluorescence emission of BLC, (fi−fo)/(fd−fo) versus GdmCl concentration. fi is the wavelength for a particular sample, fo is the wavelength in the absence of GdmCl, and fd is the wavelength at GdmCl concentration >4 M. The circles show data for native BLC (open circle) and 0.3 M NaCl-stabilized BLC (filled circles) at a BLC concentration of 0.5 μM; the squares show data for a native BLC concentration of 5 μM. (B) GdmCl unfolding of BLC monitored by following the changes in ANS fluorescence at 473 nm. (C) GdmCl-induced changes in secondary structure of BLC as monitored by following changes in the far-UV CD curve of BLC. The main panel shows the changes in ellipticity values at 222 nm for BLC in the presence of increasing GdmCl concentrations. The inset shows the far-UV CD spectrum for native BLC and that in the presence of 1.2 M and 3 M GdmCl. For the studies in B and C, a BLC concentration of 2 μM was used and the incubation and measurements were performed at 4°C.
For BLC treated with 0.3 M NaCl, an emission wavelength maximum of 334 nm was observed, which was similar to that observed for 0.2 M GdmCl-treated BLC. Addition of increasing concentrations of GdmCl to NaCl-stabilized BLC showed a significantly different profile compared to that observed for native BLC. For NaCl-stabilized BLC, no transition was observed at low concentrations of GdmCl (0–0.5 M); however, at high concentrations of GdmCl (0.5–3.5 M), a transition similar to that of native BLC was observed. Furthermore, as with enzymatic activity, the fluorescence studies also showed a higher stability against GdmCl denaturation for the NaCl-stabilized BLC; in addition, the denaturation curve was shifted to higher GdmCl concentrations.
The effect of GdmCl-induced changes in BLC on the exposure of buried hydrophobic clusters present in the native enzyme was studied using the hydrophobic fluorescent probe ANS. The fluorescent probe binds to solvent-accessible clusters of non-polar groups in proteins; the fluorescence emission of probe is known to increase on binding to hydrophobic clusters of a protein (Stryer 1965). For ANS in the presence of native BLC, a significant fluorescence intensity with emission λmax at 473 nm was observed, indicating the hydrophobic interaction between ANS and native BLC that may be due to the presence of some exposed hydrophobic patches in native BLC. Figure 3B ▶ summarizes the changes in fluorescence properties of ANS on interaction with BLC in the presence of increasing concentrations of GdmCl. Interestingly, as in the case of tryptophan fluorescence, two transitions in ranges of GdmCL concentrations of 0–0.5 M and 0.7–3.5 M, respectively, were observed for ANS fluorescence also. For the first transition observed at low GdmCl concentration, a small enhancement in ANS fluorescence intensity with no change in emission λmax of 473 nm was observed, indicating a slight exposure of buried hydrophobic clusters present in the native enzyme under these conditions. However, for the second transition, observed between 0.7 and 2.5 M GdmCl, a sharp quenching of ANS fluorescence along with a shift in emission λmax from 473 to 512 nm was observed. This transition coincides with the GdmCl-induced major unfolding transition as observed by the other structural and functional studies reported above.
Far-UV CD studies on GdmCl-induced unfolding of BLC were performed to study the effect of GdmCl on the secondary structure of the enzyme. In the far-UV region, native BLC showed a CD spectrum indicating the presence of substantial α-helical conformation (Fig. 3C ▶ inset). Figure 3C ▶ summarizes the effect of increasing GdmCl on the ellipticity at 222 nm observed for BLC. Up to 0.5 M GdmCl concentration, no significant change in ellipticity at 222 nm of native BLC was observed. For GdmCl concentration between 0.5 and 1.2 M, a large decrease in ellipticity at 222 nm was observed, indicating a significant disruption of secondary structure of the enzyme under these conditions. However, even at 1.2 M GdmCl, significant secondary structure (∼35% of the native enzyme) was found in the enzyme (Fig. 3C ▶ inset). A gradual disruption of secondary structure with increasing GdmCl concentration was observed between 1.2 and 3M where almost complete loss of secondary structure of BLC was observed (Fig. 3C ▶ inset), indicating a complete unfolding of the enzyme at ∼3 M GdmCl. These observations agree with the tryptophan fluorescence results reported above, in which the presence of some folded structure in the enzyme was observed at 1.4 M GdmCl. For complete unfolding, ∼3 M GdmCl was required.
The gradual, concomitant changes in Soret absorption and enzymatic activity of BLC observed with increasing concentrations of GdmCl are indicative of GdmCl-induced incremental changes in BLC structure. Further support for GdmCl-induced, multiphasic unfolding of BLC comes from the observation of the two transitions in tryptophan and ANS fluorescence studies, which are indicative of stabilization of an intermediate during the GdmCl-induced unfolding of BLC. Furthermore, it is observed that the denaturation profile as measured by enzymatic activity, Soret absorption, ellipticity measurements at 222 nm, and first transitions of tryptophan and ANS fluorescence corresponds to the first phase of unfolding of catalase, whereas that of the second (main transition) of the tryptophan fluorescence and ANS fluorescence corresponds to the final phase of unfolding of enzyme.
Changes in molecular properties of BLC associated with urea-induced unfolding
Although urea and GdmCl are believed to have similar modes of action (Pace 1986), GdmCl is a monovalent salt that has both ionic and chaotropic effects (Monera et al. 1994; Kohn et al. 1995a,b), whereas urea has only chaotropic effects. Thus, urea is an ideal control agent for distinguishing between the ionic and chaotropic effects of GdmCl.
Figure 4A ▶ summarizes the urea-induced changes in structural and functional properties of BLC as studied by changes in enzymatic activity, Soret absorption, ANS binding, and ellipticity at 222 nm with increasing urea concentration.
Fig. 4.

(A) Changes in enzymatic activity (filled circles), Soret absorption at 405nm (open squares), ANS fluorescence (open circles) and changes in ellipticity values at 222 nm (filled squares) of BLC with increasing concentrations of urea. The values corresponding to native BLC were taken as 100%. The measurements correspond to BLC concentration of 2 μM. Shown is the fractional folded population at increasing urea concentration as obtained from the data in main figure (inset). The symbols are same as in main figure. (B) Plot of the fractional change in the wavelength of maximum fluorescence emission of BLC, (fi−fo)/(fd−fo) versus urea concentration (details in Fig. 3A ▶). The open and filled circles represent data for native BLC at enzyme concentrations of 0.5 μM and 5 μM, respectively.
No significant change in enzymatic activity of the native enzyme was observed up to 1.5 M urea. Between 1.5 and 4 M urea, a sharp decrease in enzymatic activity from 100% to ∼5% was observed; at >4.5 M urea, a complete loss of enzymatic activity was observed.
As with enzymatic activity, no significant change in Soret absorption at 405 nm or absorption λmax was observed up to 1.5 M urea concentration. A sharp decrease in Soret absorption at 405 nm, ∼30%, along with a significant shift in λmax of absorption (from 405 to 416 nm) was observed between 1.5 and 4.5 M urea. Further increase in urea concentration up to 8 M did not show any additional change in Soret absorption properties.
For BLC in the presence of up to 1.5 M urea, no change in ANS fluorescence characteristics compared to that of native BLC was observed. However, for an increase in urea concentration between 1.5 and 6M, a significant quenching of ANS fluorescence (∼65%) with change in emission λmax from 478 to 512 nm was observed.
The effect of increasing urea concentration on BLC secondary structure was studied by monitoring the changes in ellipticities at 222 nm as determined by the far-UV CD measurements under these conditions. A single transition characterized by a large decrease in ellipticity at 222 nm was observed in the range of 1.5–6 M urea, indicating a significant disruption of secondary structure associated with this transition. At a urea concentration of 6 M, almost complete disruption of the secondary structure of BLC has been reported previously (Samejima and Kita 1969).
Although all the probes used for studying the urea-induced unfolding of catalase as reported above showed the presence of a single transition associated with this process, the different curves were not superimposable; that is, the slopes of these transitions were significantly different. This can be seen clearly from the plot of fraction folded versus urea concentration, presented in the inset of Figure 4A ▶. The enzymatic activity was found to be affected first (i.e., at lower urea concentration), followed by the Soret absorption and ellipticity measurement at 222 nm. These observations indicate the presence of an intermediate during urea-induced denaturation of intermediate species that escaped detection in the case of single probes.
The stabilization of intermediates during urea-induced unfolding of BLC was demonstrated conclusively by the tryptophan fluorescence studies at increasing urea concentrations. Figure 4B ▶ shows the fractional change in wavelength at which the tryptophan fluorescence emission spectrum of BLC is maximal plotted against urea concentration. A well-separated transition was observed at 0–1 M urea concentration. A plateau region between 1 and 2 M urea concentrations was observed, which was followed by another transition between 3 and 8 M urea. The profile observed for urea-induced unfolding of BLC was found to be unaffected by variation in concentration of BLC (0.5–4 μM). These observations indicate that the intermediate observed at low urea concentration is a tetramer having altered conformation compared to native tetramer, not a dimer as is the case with GdmCl treatment.
Changes in quaternary structure of BLC during guanidine-hydrochloride- and urea-induced unfolding
Size exclusion hromatography
For studying the effect of GdmCl- and urea-induced structural changes on the quaternary structure of BLC, the effects of increasing GdmCl or urea on the molecular dimension of BLC were monitored by size-exclusion chromatography experiments on Superdex 200 HR column (Amersham Pharmacia Biotech., Sweden).
Figure 5A ▶ summarizes the results of gel permeation experiments on BLC in the absence and presence of increasing concentrations of GdmCl at 27°C on Superdex 200HR 10/30 column (manufacturer's exclusion limit 600 kD for proteins). For native BLC, a single peak centered at 10.9 mL was observed, which was similar to the retention volume of 11.0 mL observed for the molecular weight marker of 232 kD (Amersham Pharmacia Biotech, Sweden) under similar conditions. As the molecular mass native tetrameric BLC is 240 kD, these observations indicate that native BLC under the conditions studied is tetrameric. However, for 0.3 M GdmCl-treated BLC, a single peak with a significantly higher retention volume of 12.3 mL was observed, indicating a large decrease in the molecular dimension of the enzyme under these conditions. This retention volume was slightly higher than the retention volume of 11.9 mL observed for the protein marker aldolase (Mr 158,000). As the dimer of BLC has a molecular weight of ∼120 kD, these observations indicate that the reduced hydrodynamic radii observed for 0.3 M GdmCl-denatured BLC is due to the stabilization of BLC dimers as a result of dissociation of the native tetramer under these conditions. At 0.8 M GdmCl, three peaks centered at 7.9, 12.2, and 12.8 mL (designated A, B, and C, respectively) were observed. The peak A appeared at a dramatically reduced retention volume of 7.9 mL, which is the void volume (7.8 mL) of column (exclusion limit 600 kD), indicative of vastly increased hydrodynamic radii for the protein under these conditions (i.e., an aggregated species). The peak B corresponds to the dimeric species of BLC as discussed above. The peak C observed at an enhanced retention volume of 12.8 mL was found to be close to the retention volume of 12.7 mL observed for the molecular mass marker of 66 kD (BSA) on this column. The monomer of BLC has a molecular mass of 60 kD, indicating that the peak C corresponds to the monomeric species of BLC. The presence of three peaks corresponding to aggregates, dimers, and monomers indicates that these three species exist in equilibrium under the conditions at which the column was run. For 1.25 M and 2 M GdmCl-treated BLC, a single broad peak centered at ∼8.35 mL was observed. This highly reduced retention volume indicates the presence of aggregated species under these conditions. These aggregates are possibly attributable to unstable GdmCl-stabilized monomers of BLC. The reason for such a possibility is that, with increasing concentration of GdmCl from 0.3 to 1.25 M, an increase in the monomer population with a concomitant decrease in population of dimers should occur. Thus, on going from 0.3 to 1.25 M GdmCl, there should be an enhancement of the monomer peak with a concomitant decrease, or complete vanishing, of the dimer peak. However, the experimental results show that on going from 0.3 to 1.25 M GdmCl, the peaks corresponding to both monomers and dimers vanished and only aggregated species were observed, thus supporting the contention that it is probably the GdmCl-induced monomers of BLC that are stabilized under these conditions that undergo aggregation.
Fig. 5.

Chromatographic profiles of native BLC on a Superdex 200HR 10/30 column (manufacturer's exclusion limit 600 kD for proteins) on AKTA FPLC (Amersham Pharmacia Biotech, Sweden) at various guanidine hydrochloride concentrations (A) and urea concentrations (C) at 4°C. All the curves have been displaced along the Y-axis for display purposes. The panel (B) and (D) represent The SDS-PAGE profiles of glutaraldehyde crosslinked GdmCl-treated (B) and urea-treated BLC samples (D) follow. In B, lanes 1–3 represent native BLC, native crosslinked BLC, and 0.3M GdmCl-treated crosslinked BLC samples, respectively. In D, lanes 1–3 represent native BLC, crosslinked 2M urea-treated BLC, and crosslinked 3M urea-treated BLC, respectively. All experimental details are recorded in Materials and Methods.
At 3.5 M GdmCl, a single sharp peak having retention volume of 10.45 mL that is slightly less than that of the native tetramer was observed, indicative of a slightly larger hydrodynamic radius of the enzyme under these conditions. The structural studies on BLC at 3.5 M GdmCl presented above suggested that the enzyme is present in a fully unfolded form under these conditions. Hence, the peak at retention volume 10.45 mL observed for 3.5 M GdmCl-denatured BLC corresponds to the fully unfolded enzyme.
Figure 5B ▶ shows the profiles of native BLC and those of samples incubated in the presence of increasing urea concentrations and run at 27°C. For native and 1 M urea-treated BLC, a single peak centered at 10.9 mL was observed, indicating that no change in the quaternary structure of the enzyme occurs at 1 M urea. For 2 to 4 M urea-denatured BLC, two peaks centered at 10.15 mL and 11.85 mL (designated peaks A and B, respectively) were observed. Furthermore, a decrease in the area under peak A and a concomitant increase in the area under peak B was observed with increasing urea concentration, indicating that the species corresponding to peak A is transformed to that corresponding to peak B with increasing urea concentration. The peak A had a slightly shorter retention time than the native enzyme (10.95 mL). The structural studies presented above showed only a slight change in the structural parameters of tetrameric native BLC on incubation with 2 M urea. The change in the structural features of BLC induced by 2 M urea seems to result in a slight expansion of enzyme structure and thus an enhancement in hydrodynamic radius as determined by size-exclusion chromatography. Similarly, the peak B shows a slight reduction in retention volume, compared to 12.3 mL observed for dimers (as in GdmCl-induced unfolding), indicating that the dimers of BLC that are stabilized under these conditions have a slightly unfolded conformation compared to the GdmCl-stabilized dimers. At 6 M urea, a single sharp peak at 10.45 mL was observed, which is similar to that observed for 3 M GdmCl-denatured BLC, indicating the presence of the fully unfolded form of enzyme under these conditions.
Glutaraldehyde crosslinking studies
The effect of GdmCl and urea on the subunit configuration of BLC was also studied by glutaraldehyde crosslinking. BLC treated with varying concentrations of GdmCl or urea were crosslinked using glutarladehyde and the products obtained were analyzed on SDS-PAGE followed by Coomassie staining of protein bands (summarized in the insets of Figs. 5B,D ▶). For native and 2 M urea-treated catalase, a crosslinked protein band corresponding to only the tetramer was observed. However, for 0.3 M GdmCl-treated BLC, crosslinked protein bands corresponding to only the dimer were observed. For 3 M urea-treated BLC, a protein band corresponding mainly to the dimer along with a faint band corresponding to the tetramer were observed, indicating the presence of these two association states under these conditions. These observations indicate that treatment of BLC with up to 2 M urea does not bring any change in the subunit configuration of the enzyme; however, treatment with 0.3 M GdmCl or 3 M urea results in dissociation of the native tetramer into the dimer of the enzyme. The results of glutaraldehyde crosslinking agree with those of the size exclusion chromatographic studies.
Reversibility of urea- and GdmCl-stabilized oligomers of BLC
For studying the reversibility of the GdmCl- and urea-denatured BLC refolding studies were performed. The BLC solution was incubated with increasing concentrations of GdmCl or urea for 6 h at 4°C. For performing refolding studies, these samples were then diluted 20-fold in 0.1 M phosphate buffer (pH 7.0) and stirred continuously for almost 4 h at 4°C. The extent of renaturation of catalase was judged only by the recovery of enzymatic activity. It has been shown that on renaturation of denatured catalase, structural parameters such as Soret absorption and far- and near-UV CD spectra are regained even when the enzyme is not properly refolded; however, no enzymatic activity is observed for these samples (Takeda et al. 1983). Hence, restored enzymatic activity, not structural properties, is the real marker for assessing the refolding of catalase. Figures 6A,B ▶ summarize the refolding efficiency of GdmCl- and urea-treated BLC samples, respectively. For BLC samples treated with up to 0.5 M GdmCl or 1 M urea, a complete refolding was observed. However, for BLC samples denatured at 1.5 M GdmCl or 5 M urea, a maximum recovery of ∼5% of enzymatic activity compared to the native enzyme was observed on refolding. These observations demonstrate that complete refolding to native BLC can be achieved after denaturation of BLC with low denaturant concentrations, whereas denaturation at high denaturant concentration is irreversible, resulting in the inability to recover native protein on refolding.
Fig. 6.
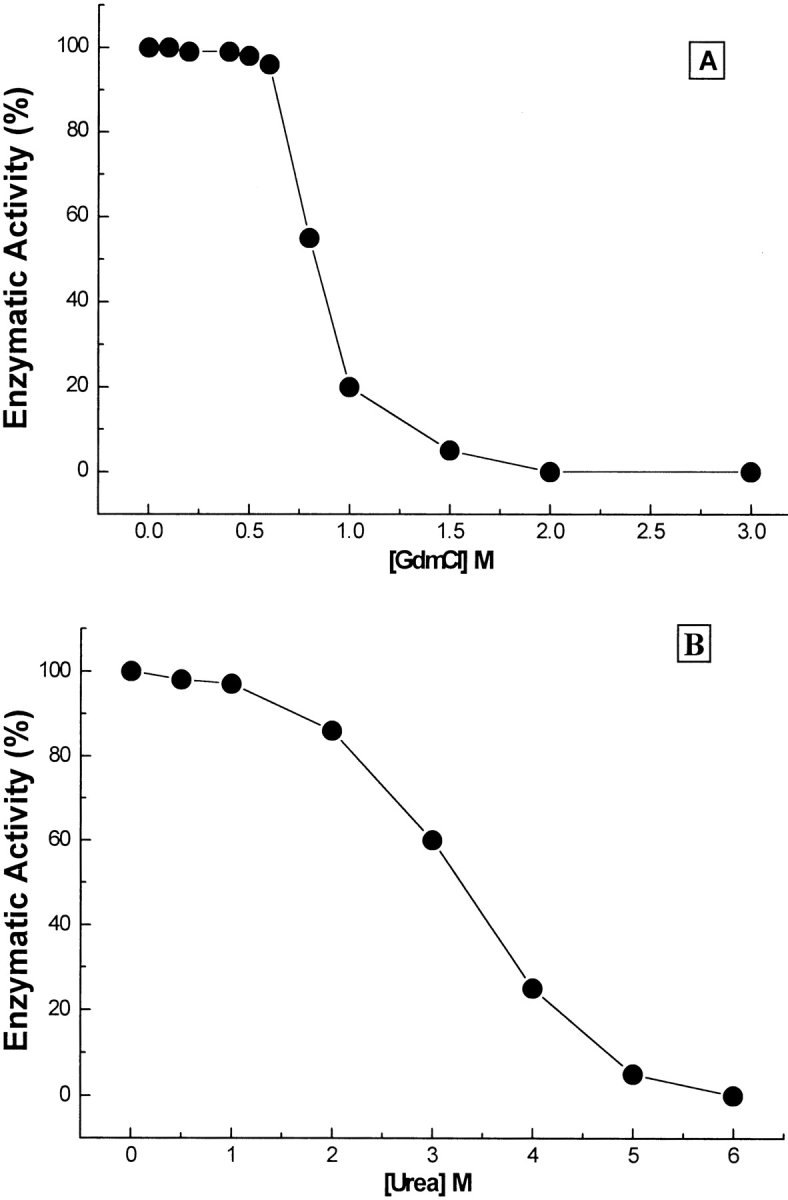
Effect of GdmCl (A) and urea (B) denaturation on the refolding efficiency of BLC. The refolding was performed by the rapid dilution method described in Materials and Methods. The refolding/reconstitution was monitored by recovery of enzymatic activity as a percentage of native enzyme activity.
Discussion
Typical catalases are tetramers with molecular 222 symmetry (Zamocky and Koller 1999). Folding and assembly of typical catalases has been proposed to follow the path: holomonomers → holodimers → holotetramers. This model is based on the observation that only holotetramers are formed, even when the biosynthesis of the monomers exceeds haem synthesis (Murthy et al. 1981), and on the formation of a single ellipsoid dimer species upon dissociation of mammalian catalase (Tanford and Lovrien 1962).
An unexpected and novel finding of our work is the first-time report of an enzymatically active dimer of BLC. All of the dimers of mammalian catalase reported in the literature to date, stabilized under various conditions, are enzymatically inactive (Samejima et al. 1962Samejima et al. 1981; Deisseroth and Dounce 1967; Prajapati et al. 1998). However, two enzymatically active dimeric forms of catalase from plant sources have been reported. Hirasawa et al. (1989) reported an apparently dimeric form of spinach catalase, containing protohaem as well as novel haem. A dimeric catalase (∼63 kD) associated with the PSII-membrane has also been reported (Sheptovitsky and Brudvig 1996). These observations indicate that perhaps the dimer is the smallest unit of catalase that can exist in an enzymatically active form.
The GdmCl-stabilized, enzymatically active dimers of BLC showed enzymatic activity and Soret absorption slightly higher than the native enzyme and were found to exist in equilibrium with the native tetrameric BLC (Fig. 3A ▶) and reassociate to form native tetramers on decrease or removal of GdmCl (Fig. 6 ▶). In the earlier reported studies on GdmCl and urea denaturation of porcine erythrocyte catalase, an enhancement in enzymatic activity and Soret absorption as compared to native enzyme was observed at low GdmCl concentrations (Takeda et al. 1983); unfortunately, no detailed study on the subunit structure of the enzyme under these conditions was reported. Hence, it is not clear whether the enzyme under these conditions was a dimer or tetramer.
GdmCl is an electrolyte with a pKa of ∼11. Thus, at physiological pH, at which the experiments have been performed, the GdmCl molecule will be present in fully dissociated form as Gdm+ and Cl−. The presence of these ions would influence the stabilizing properties of proteins. Studies on several proteins with GdmCl have provided compelling evidence that GdmCl can play a cation role (Fan et al. 1999) and modulate electrostatic interaction in proteins (Havel et al. 1986). BLC is an acidic protein, having a higher ratio of acidic to basic amino acid residues (Schroeder et al. 1962). Most of the charged residues in BLC are found on the outside of the molecule (Murthy et al. 1981). The electrostatic surface potential of BLC as determined by GRASP (Nicholls 1992) from the X-ray crystal structure of the enzyme (Murthy et al. 1981) showed a predominantly negative charge on the BLC tetramer with high concentration of negative charges localized at several places on the surface. Hence, neutralization of these charges should influence the structure and conformation of the enzyme. Acid denaturation of BLC at pH 3.0 results in dissociation of the native tetrameric enzyme into dimers (Samejima and Yang 1963). At pH 3.0, the negatively charged carboxylate groups of BLC will undergo protonation, neutralizing the negative charges present in the enzyme; this seems to result in dissociation of the native tetrameric enzyme, leading to stabilization of the dimer. The acid-stabilized dimer was reported to be enzymatically inactive (Samejima and Yang 1963). Study of the pH-dependence of the reaction mechanism of catalase has shown that the H2O2-decomposition rate decreases significantly at acidic (<pH 5.0) and alkaline pH (>10.0), resulting in a loss of enzymatic activity (Abe et al. 1979).
At neutral pH, the Gdm+ cation can bind preferentially to the negative charge clusters present in native BLC, neutralizing these charges and leading to stabilization of a dimeric species. The possibility of preferential cations binding to native BLC can be confirmed by the studies using monovalent cation salts such as NaCl, KCl, etc. Figure 7 ▶ summarizes the result of size-exclusion chromatographic experiment on 0.3 M NaCl-treated BLC. Under these conditions, BLC showed a single peak having a retention volume of 12.2 mL, which was similar to that observed for the 0.3 M GdmCl-stabilized dimer of BLC, indicating stabilization of the folded dimer on interaction of BLC with NaCl. Similar results were observed for 0.3 M KCl-treated BLC (not shown). The NaCl-stabilized BLC dimer showed functional and structural properties similar to the GdmCl-stabilized dimer such as enhanced enzymatic activity (Fig. 2 ▶) and tryptophan fluorescence characteristics (Fig. 3A ▶). Similar results were observed with the KCl-stabilized dimer of BLC (not shown). Further support for preferential binding of Gdm+ to BLC can be obtained from competitive binding studies with of Na+ ions, which should abolish or decrease the unusual effects of GdmCl on the structural parameters of BLC. The results (Figs. 2 and 3A ▶ ▶) of these studies showed that this was indeed the case when 0.2–0.5 M GdmCl was added to a BLC solution already containing 0.3 M NaCl, no enhancement of enzymatic activity or Soret absorption was observed, showing that the effect of low GdmCl concentrations on BLC can be abolished by NaCl. These observations indicate strongly a common mechanism of cation binding for NaCl and low concentration of GdmCl leading to stabilization of enzymatically active dimers of BLC. The contention that cation binding is probably the key factor for stabilization of the folded dimer of BLC is further supported by the results of the studies using urea, a non-ionic denaturant. Urea denaturation was found to stabilize a partially unfolded, enzymatically inactive dimer of BLC, both in this paper and previously (Sund et al. 1967).
Fig. 7.

Chromatographic profiles of BLC, native and on treatment with 0.3M NaCl, on a Superdex 200HR 10/30 column (manufacturer's exclusion limit 600 kD for proteins) on AKTA FPLC (Amersham Pharmacia Biotech, Sweden). The experimental details are the same as in Figure 6 ▶. The curves have been displaced along the Y-axis for display purpose.
Besides the dimers, an enzymatically active, expanded tetramer of BLC was also observed during urea-induced denaturation of BLC. An expansion of the protein before dissociation, with or without a change in structural parameters, has been reported for several multimeric enzymes like aminoacylase (Bai et al. 1999), pyruvate decarboxylase (Pohl et al. 1994), glutathione transferase B1–1 (Sacchetta et. al. 1993), cytochrome P450 2B1 (Yu et al. 1995), and so forth. The urea-stabilized, expanded tetramer had enzymatic activity similar to the native enzyme, but a modified tertiary structure as shown by tryptophan fluorescence studies. Urea is also a chaotropic molecule and has the property of disrupting the solvating water structure and binding preferentially to the protein surface. It seems that alteration in the solvating water structure of BLC by low concentrations of urea leads to stabilization of an expanded tetramer of BLC. Support for this idea comes from our previously reported studies on stabilization of a partially folded tetramer of the enzyme on alkaline treatment of BLC in the presence of high concentrations of salts (Prajapati et al. 1998). Salts affect the protein stability in two different ways. At low concentrations, ions interact via specific interactions resulting in electrostatic neutralization of protein charges leading to stabilization of protein. However, at higher concentrations (>1 M), salts have an ion-specific influence, such as effects on solvating water structure and destabilization of hydrophobic interactions in proteins. Our studies (Prajapati et al. 1998) had demonstrated that the relative abilities of various anions in stabilization of partially unfolded tetramers of BLC followed the Hofmeister series or the chaotropic series. This indicated that the cations' influence on the water structure of the BLC was responsible for the stabilization of the tetrameric intermediate. Hence, it seems that alteration in the solvating water structure of BLC leads to expansion of the native tetrameric enzyme molecule, resulting in stabilization of an expanded tetramer of BLC.
The studies presented in this paper demonstrate that cation binding to native catalase leads to dissociation of the native tetramer resulting in stabilization of an enzymatically active dimer, whereas partial unfolding leads to stabilization of an enzymatically inactive, partially unfolded dimer. The studies also demonstrate that GdmCl- and urea-induced unfolding of BLC follow different pathways.
Materials and methods
Crystalline BLC was purified and characterized according to the procedure reported by Prajapati et al. (1998). The BLC preparation was found to be ∼99% pure by silver staining of SDS-PAGE gels. All the chemicals used were purchased from Aldrich Chemical Company, USA, and were of the highest purity available.
Spectrophotometry
The absorption spectra of BLC solutions were measured with a Shimadzu UV-240 double beam spectrophotometer. The concentrations of BLC solutions were determined spectrophotometrically based on A1% 1 cm = 13.5 at 405 nm, as described previously (Prajapati et al. 1998) and also by the method of Lowry et al. (1951), using bovine serum albumin as the standard. The concentration of denatured proteins was determined only by the method of Lowry et al. (1951).
Guanidine hydrochloride and urea denaturation of BLC
BLC was dissolved in 0.025 M sodium phosphate buffer (pH 7.0) in the presence and absence of increasing concentration of GdmCl or urea and incubated for 6 h at 4°C before the measurements were made.
Catalase activity
The BLC activity was measured by the rate of decomposition of 0.03 M hydrogen peroxide (H2O2). The decomposition of H2O2 was followed directly by the decrease in absorbance at 240 nm. The difference in absorbance (A240) per unit time is a measure of the BLC activity (Hugo 1987). The enzyme concentration used for these studies was 2 μM unless otherwise noted.
Tryptophan fluorescence
Fluorescence spectra were recorded with Perkin-Elmer LS 5B spectroluminescencemeter in a quartz cell with a 5-mm path length. All the samples were equilibrated for 6 h at 4°C before recording. All measurements were made at 4°C. The excitation wavelength was 290 nm and the spectra were recorded from 300 to 500 nm.
Circular dichroism measurements
CD measurements were made with a Jasco J500 spectropolarimeter calibrated with ammonium (+)-10-camphorsulfonate. The results are expressed as the mean residual ellipticity [θ], which is defined as [θ] = 100 × θobs / (lc), where θobs is the observed ellipticity in degrees, c is the concentration in mol residue. l-1, and l is the length of the light path in centimeters. The CD spectra were measured at an enzyme concentration of 2 μM with a 1 mm cell at 4°C. The values were normalized by subtracting the baseline recorded for the buffer having the same concentration of denaturant under similar conditions.
8-anilino-1-naphthalenesulphonic acid (ANS) fluorescence measurements
Fluorescence spectra were recorded with Perkin-Elmer LS 5B spectroluminescencemeter in a quartz cell with a 5-mm path length at 4°C. Protein aliquots with a final protein concentration of 2 μM were equilibrated at the desired GdmCl or urea concentration for 6 h at 4°C. They were then mixed with a concentrated stock solution of ANS dissolved in the same buffer and incubated for 1 h. The excitation wavelength was 365 nm and the emission was recorded from 400 to 560 nm. The final ANS concentration was 60 μM. The values were normalized by subtracting the baseline recording for the ANS alone under similar conditions.
Size-exclusion chromatography
Gel filtration experiments were performed on a Superdex 200HR 10/30 column (manufacturer's exclusion limit 600 kD for proteins) with an AKTA FPLC (Amersham Pharmacia Biotech, Sweden). The column was equilibrated and run with 0.025 M sodium phosphate buffer (pH 7.0) containing the desired GdmCl or urea concentration at 27°C. The BLC solution (2 μM) was incubated at the desired GdmCl or urea concentration for 6 h at 4°C. 200 μL of this sample was loaded on the column and run at 27°C; with a flow rate of 0.3 ml/min and detection at 280 nm.
Crosslinking using glutaraldehyde
To native and GdmCl- or urea-treated BLC (0.3 μM), an aliquot of 25% (m/v) glutaraldehyde was added so as to make a final concentration of 1% glutaraldehyde. This sample was incubated at 25°C for 5 min followed by quenching the cross-linking reaction by adding 200 mM sodium borohydride. After 20 min incubation, 3 μL of 10% aqueous sodium deoxycholate was added. The pH of the reaction mixture was lowered to 2–2.5 by the addition of orthophosphoric acid that resulted in precipitation of the cross-linked protein. After centrifugation (13237g, 4°C), the precipitate was re-dissolved in 0.1 M Tris/HCl (pH 8.0), 1% SDS, and 50 mM dithioerythritol and heated at 90°–100°C. SDS-PAGE was run with 6% gels.
Reconstitution studies
The GdmCl- or urea-denatured protein samples (prepared as described earlier) were diluted into 20 × volume of 0.025M sodium phosphate buffer (pH 7.0) and stirred for 4 h at 4 ± 1°C. The study on the time-dependence of refolding of GdmCl-denatured BLC showed that maximum percent recovery of enzymatic activity can be obtained within 2 h (not shown). Hence, for all the studies the reconstitution time of 4 h was used. The refolding/reconstitution was monitored by recovery of enzymatic activity. The enzymatic activity corresponding to the native enzyme was taken as 100%.
Acknowledgments
We thank Dr. C.M. Gupta for constant support and critical suggestions during the course of the study. KP and SP thank CSIR and the Department of Science and Technology, India, for financial assistance. The work is supported by CSIR Young Scientist Award grant to VB.
The publication costs of this article were defrayed in part by payment of page charges. This article must therefore be hereby marked "advertisement" in accordance with 18 USC section 1734 solely to indicate this fact.
Abbreviations
BLC, bovine liver catalase
GdmCl, guanidine hydrochloride
PAGE, polyacrylamide gel electrophoresis
SDS, sodium dodecyl sulphate
OD, optical density.
Article and publication are at http://www.proteinscience.org/cgi/doi/10.1101/ps.20102.
References
- Abe, K., Makino, N., and Anan, F.K. 1979. pH dependency of kinetic parameters and reaction mechanism of beef liver catalase. J. Biochem. 85 473–479. [DOI] [PubMed] [Google Scholar]
- Bai, J.-H., Xu, D., Wang, H.-R., Jheng, S.-Y., and Zhou, H.-M. 1999. Evidence for the existence of an unfolding intermediate state for aminoacylase during denaturation in guanidine solution. Biochim. Biophys. Acta 1430 39–45. [DOI] [PubMed] [Google Scholar]
- Deisseroth, A. and Dounce, A.L. 1967. Nature of change produced in catalase by lyophilization. Arch. Biochem. Biophys. 120 671–692. [Google Scholar]
- Fan, Y-X., McPhie, P., and Miles, E.W. 1999. Guanidine hydrochloride exerts dual effects on the tryptophan synthase α2β2 complex as a cation activator and as a modulator of the active site conformation. Biochemistry 38 7881–7890. [DOI] [PubMed] [Google Scholar]
- Feinstein, R.N. 1970. Acatalasemia in the mouse and other species. Biochem. Genet. 4 135–155. [DOI] [PubMed] [Google Scholar]
- Furuta, H., Hachimori, A., Ohta, Y., and Samejima, T 1974. Dissociation of bovine liver catalase on its acetylation J. Biochem. 76 481–491. [DOI] [PubMed] [Google Scholar]
- George, P. 1949. The effect of the peroxide concentration and other factors on the decomposition of hydrogen peroxide by catalase. Biochem. J. 44 197–205. [DOI] [PMC free article] [PubMed] [Google Scholar]
- Gokhale, R.S., Ray, S. S., Balaram, H., and Balaram, P. 1999.. Unfolding of Plasmodium falciparum triose phosphate isomerase in urea and GdmCl: evidence for a novel disulphide exchange reaction in a covalently cross-linked mutant. Biochemistry 38 423–431. [DOI] [PubMed] [Google Scholar]
- Havel, H.A., Kauffman, E.W., Plaisted, S.M., and Berms, D.N. 1986. Reversible self-association of bovine growth hormone during equilibrium unfolding. Biochemistry 25 6533–6538. [DOI] [PubMed] [Google Scholar]
- Hirasawa, M., Gray, K.A., Ondrias, M.R., Larsen, R.W., Shaw, R.W., Morrow, K.J., Jr., and Knaff, D.B. 1989. Prosthetic group content and ligand binding properties of spinach catalase. Biochim. Biophys. Acta 994 229–234. [DOI] [PubMed] [Google Scholar]
- Holmes, R.S. and Duley, J.A. 1975. Biochemical and genetic studies of peroxisomal multiple enzyme systems: α-Hydroxyacid oxidase and catalase. In Isoenzymes: Vol. 1. Molecular Structure (ed. C.L. Market), pp. 191–211. Academic Press, NY.
- Hugo, A. 1987. Catalase in vitro. Methods Enzymol. 105 121–126. [DOI] [PubMed] [Google Scholar]
- Jaenicke, R. 1987. Stability and folding of domain proteins. Prog. Biophys. Mol. Biol. 49 117–237. [DOI] [PubMed] [Google Scholar]
- Jaenicke, R. and Lilie, H. 2000.: Folding and association of oligomeric and multimeric proteins. Adv. Protein Chem. 53 329–401. [DOI] [PubMed] [Google Scholar]
- Jones, M.N., Manley, P., Midgley, P.J.W., and Wilkinson, A.E. 1982. Dissociation of bovine and bacterial catalases by sodium-dodecyl sulphate. Biopolymers 21 1435–1450. [DOI] [PubMed] [Google Scholar]
- Jones, G.L. and Masters, C. 1975. On the nature and characteristics of the multiple forms of catalase in mouse liver. Arch. Biochem. Biophys. 169 7–21. [DOI] [PubMed] [Google Scholar]
- Kohn, W.D., Kay, C.M., and Hodges, R.S. 1995a. Protein destabilization by electrostatic repulsions in the two-stranded alpha-helical coiled-coil/leucine zipper. Protein Sci. 4 237–250. [DOI] [PMC free article] [PubMed] [Google Scholar]
- Kohn, W.D., Monera, O.P., Kay, C.M., and Hodges, R.S. 1995b. The effects of interhelical electrostatic repulsions between glutamic acid residues in controlling the dimerization and stability of two standard α-helical coiled-coils. J. Biol. Chem. 270 25495–25506. [DOI] [PubMed] [Google Scholar]
- Kuntz, G., Stockel, P., and Heidrich, H.G. 1978. The conformer nature of the multiple forms of beef liver catalase as obtained by biochemical and small-angle X-ray scattering experiments. A model for the quaternary structure of the beef liver catalase molecule. Hoppe-Seylers Z. Physiol. Chem. 359 959–973. [DOI] [PubMed] [Google Scholar]
- Lowry, D.H., Rosenberg, N.J., Farr, A.L., and Randal, R.J. 1951. Protein measurement with the Folin phenol reagent. J. Biol. Chem. 193 265–275. [PubMed] [Google Scholar]
- Masters, C., Pegg, M., and Crane, D. 1986. On the multiplicity of the enzyme catalase in mammalian liver. Mol. Cell. Biochem. 70 113–120. [DOI] [PubMed] [Google Scholar]
- Mei, G., Di Venere, A., Burgonza, M., Vecchini, P., Rosato, N., and Finazzi-Argo, A. 1997. Role of quaternary structure in the stability of dimeric proteins: the case of ascorbate oxidase. Biochemistry 36 10917–10922. [DOI] [PubMed] [Google Scholar]
- Miyahara, T., Takeda, A., Hacimori, A., and Samejima, T. 1978. On the heterogeneity of catalase from goat liver. J. Biochem. 84 1267–1276. [DOI] [PubMed] [Google Scholar]
- Monera, O.D., Kay, C.M., and Hodges, R.S. 1994. Protein denaturation with guanidine hydrochloride or urea provides a different estimate of stability depending on the contributions of electrostatic interactions. Protein Sci. 3 1984–1991. [DOI] [PMC free article] [PubMed] [Google Scholar]
- Murthy, M.R.N., Reid, T.J., Sicigano, A., Tanaka, N., and Rossmann, M.G. 1981. Structure of beef liver catalase. J. Mol. Biol. 152 465–499. [DOI] [PubMed] [Google Scholar]
- Nicholls, A. 1992. GRASP: Graphical representation and analysis of surface potential properties. Columbia University Press, New York.
- Pace, C.N. 1986. Determination and analysis of urea and guanidine hydrochloride denaturation curves. Methods Enzymol. 131 267–280. [DOI] [PubMed] [Google Scholar]
- Parr, G.R. and Hammes, G.G. 1975. Subunit dissociation and unfolding of rabbit muscle phosphafructokinase. Biochemistry 14 1600–1605. [DOI] [PubMed] [Google Scholar]
- Pohl, M., Grotzinger, J., Wollmer, A., and Kula, M.-R. 1994. Reversible dissociation and unfolding of pyruvate decarboxylase from Zymomons mobilis. Eur. J. Biochem. 224 651–661. [DOI] [PubMed] [Google Scholar]
- Prajapati, S., Bhakuni, V., Babu, K.R., and Jain, S. 1998. Alkaline unfolding and salt-induced folding of bovine liver catalase at high pH. Eur. J. Biochem. 255 178–184. [DOI] [PubMed] [Google Scholar]
- Sacchetta, P., Aceto, A., Bucciarelli, T., Dragani, B., Santarone, S., Allocati, N., and Di Ilio, C. 1993. Multiphasic denaturation of glutathione transferase B1–1 by guanidine hydrochloride. Eur. J. Biochem. 215 741–745. [DOI] [PubMed] [Google Scholar]
- Samejima, T. and Kita, M. 1969. The conformational changes of catalase molecule caused by ligand molecules. Biochim. Biophys. Acta 175 24–30. [DOI] [PubMed] [Google Scholar]
- Samejima, T., Kamata, M., and Shibata, K. 1962. Dissociation of beef liver catalase. J. Biochem. 51 181–187. [DOI] [PubMed] [Google Scholar]
- Samejima, T. and Yang, J.T. 1963. Reconstitution of acid-denatured catalase. J. Biol. Chem. 238 3256–3261. [PubMed] [Google Scholar]
- Scherz, B., Kuchiniskas, E.J., Wyss, S.R., and Aebi, H. 1976. Heterogeneity of erythrocyte catalase. Dissociation, recombination, and hybridization of human erythrocyte catalase. Eur. J. Biochem. 69 603–613. [Google Scholar]
- Schroeder, W.A., Saha, A., Fenninger, W.D., and Cua, J. 1962. Preliminary chemical investigation of the structures of beef liver and horse liver catalase. Biochim. Biophys. Acta 58 611–613. [DOI] [PubMed] [Google Scholar]
- Schroeder, W.A., Shelton, J.R., Shelton, J.B., Robberson, B., and Apell, G. 1969. The amino acid sequence of bovine liver catalase: A preliminary report. Arch. Biochem. Biophys. 131 653–655. [DOI] [PubMed] [Google Scholar]
- Seckler, R. and Jaenicke, R. 1992. Protein folding and protein refolding. FASEB J. 6 2545–2552. [DOI] [PubMed] [Google Scholar]
- Sheptovitsky, Y.G. and Brudvig, G.W. 1996. Isolation and characterization of spinach photosystem II membrane-associated catalase and polyphenol oxidase. Biochemistry 35 16255–16263. [DOI] [PubMed] [Google Scholar]
- Stryer, L. 1965. The interaction of naphtahlene dye with apomyoglobin and apohaemoglobin. J. Mol. Biol. 13 482–495. [DOI] [PubMed] [Google Scholar]
- Sund, H., Weber, K., and Molbert, E. 1967. Dissociation der Rinderleber-Katalase in inhre Untereinheitein. Eur. J. Biochem. 1 400–410. [DOI] [PubMed] [Google Scholar]
- Takeda, A., Hirano, K., Shiroya, Y., and Samejima, T. 1983. On the denaturation of porcine erythrocyte catalase with alkali, urea, and guanidine hydrochloride in relation to its subunit structure. J. Biochem. 93 967–975. [DOI] [PubMed] [Google Scholar]
- Tanford, C. and Lovrien, R. 1962. Dissociation of catalase into subunits. J. Am. Chem. Soc. 84 1892–1896. [Google Scholar]
- Wiemer, E.A., Ofman, R., Middelkoop, E., de Boer, M., Wanders, R.J., and Tager, J.M. 1992. Production and characterization of monoclonal antibodies against native and disassembled human catalase. J. Immunol. Methods 151 165–175. [DOI] [PubMed] [Google Scholar]
- Yu, X.-C., Shen, S., and Strobel, H.W. 1995. Denaturation of cytochrome P4502B1 by guanidine hydrochloride and urea: Evidence for a metastable intermediate state of the active site. Biochemistry 34 5511–5517. [DOI] [PubMed] [Google Scholar]
- Zamocky, M. and Koller, F. 1999. Understanding the structure and function of catalase: Clues from molecular evolution and in vitro mutagenesis. Prog. Biophys. Mol. Biol. 72 19–66. [DOI] [PubMed] [Google Scholar]