Abstract
Marine diatoms require dissolved silicate to form an external shell, and their growth becomes Si-limited when the atomic ratio of silicate to dissolved inorganic nitrogen (Si:DIN) approaches 1:1, also known as the “Redfield ratio.” Fundamental changes in the diatom-to-zooplankton-to-higher trophic level food web should occur when this ratio falls below 1:1 and the proportion of diatoms in the phytoplankton community is reduced. We quantitatively substantiate these predictions by using a variety of data from the Mississippi River continental shelf, a system in which the Si:DIN loading ratio has declined from around 3:1 to 1:1 during this century because of land-use practices in the watershed. We suggest that, on this shelf, when the Si:DIN ratio in the river decreases to less than 1:1, then (i) copepod abundance changes from >75% to <30% of the total mesozooplankton, (ii) zooplankton fecal pellets become a minor component of the in situ primary production consumed, and (iii) bottom-water oxygen consumption rates become less dependent on relatively fast-sinking (diatom-rich) organic matter packaged mostly as zooplankton fecal pellets. This coastal ecosystem appears to be a pelagic food web dynamically poised to be either a food web composed of diatoms and copepods or one with potentially disruptive harmful algal blooms. The system is directed between these two ecosystem states by Mississippi River water quality, which is determined by land-use practices far inland.
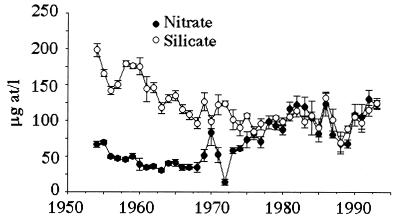
Estuarine and marine primary productivity is generally related directly to nutrient (especially nitrogen) loading (1–6), which is increasing widely (4, 7), sometimes causing noxious algal blooms, low bottom-water oxygen concentrations, and fisheries losses (7–11). When nutrient loads increase, the ratios of essential nutrients may change, as they have in several large rivers (12). The constraints of ecological stoichiometry can be used to trace causal interactions within ecosystems, most commonly as DIN (dissolved inorganic nitrogen—the sum of ammonia, nitrite, and nitrate):phosphorus ratios (13, 14). Nitrate is >95% of the DIN in the Mississippi River (15), and the dissolved elemental silicate:nitrate ratios in the lower Mississippi River have changed from around 3:1 to 1:1 during the past 40 years (Fig. 1). These ratio changes have been hypothesized to have affected diatoms in the offshore phytoplankton community (15, 16) through physiological limitations imposed on diatoms when forming their silica shells. Marine diatoms have a 1:1∷Si:N atomic ratio in their biomass (17), implying that reductions in silicate supply below a Si:DIN ratio of 1:1 may inhibit their growth. The supply of silicate to surface waters of the equatorial Pacific, for example, appears to regulate new phytoplankton production, which is mostly diatoms (18). Large zooplankton predators that consume diatoms or diatom predators produce fecal pellets that sink at a rate around 50–100 m per day (19). These fecal pellets are important substrates for aerobic decomposition in the water column and in sediments and are a major downward transport mechanism for other elements when they sink (19–21). Officer and Rhyther (22) suggested that a shift in the Si:N atomic ratio from above 1:1 to below 1:1 would have two effects: altering the marine food web by reducing the diatom-to-zooplankton-to-higher trophic level food web, and increasing the proportion of flagellated algae, including those that produce harmful algal blooms. These fluctuations in the Si:DIN ratios of the riverine-end member, therefore, are potentially fundamental controlling influences on the coastal phytoplankton community composition, their zooplankton grazers, and the distribution of low-oxygen bottom waters. We tested these hypotheses by examining the relationships between the Si:DIN ratio in the river waters entering this area and other factors, including (i) the relative abundance of copepods from spring to fall in 6 years; (ii) the production of zooplankton fecal pellets as a percentage of the total primary production in 2 years; (iii) the vertical distribution of community plankton respiration rate and its variation for three summer and two spring cruises; and (iv) the respiration rate per phytoplankton pigment determined on nine cruises by three different study teams.
Figure 1.
The average annual concentration (±1 SE) of nitrate and silicate in the Mississippi River at New Orleans. Note the uncoupled relationship between the two variables before 1975 and the coherent changes after 1980.
METHODS
Water Quality Records.
Water quality records are from the annual reports of the United States Geological Survey and the Louisiana Department of Environmental Quality for St. Francisville, Luling, Venice, Belle Chase, and New Orleans, LA. Additional data for 1998 are from water samples collected biweekly by the authors at Baton Rouge, LA. We used the average daily values of the dissolved silicate and nitrate concentrations for the 90 days before each data collection in this analysis.
Copepod Abundance.
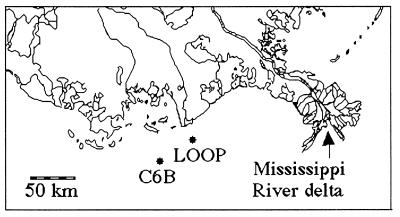
Data from two locations were used to estimate the relative abundance of copepods (Fig. 2). Five-minute surface tows were made near the sediment-trap station (C6B in Fig. 2) using a standard plankton net (equipped with a flowmeter; mouth opening = 0.5 m in 1992 and 0.3 m in 1991; 234-μm mesh) to collect mesozooplankton (>200 μm) that were subsequently stored in 4% buffered formalin pending laboratory processing (23). Samples were taken monthly from July through September 1991, and from May through September 1992. Other zooplankton samples analyzed are from the Louisiana Offshore Oil Port (LOOP in Fig. 2) stations sampled by the Louisiana Department of Wildlife and Fisheries as part of a monitoring program (24). These data are for March through November, from June 1979 through April 1983, and were collected by using a 1-m diameter 363-μm mesh plankton net towed at the surface for 3–5 min.
Figure 2.
Location map with the sampling stations C6B (21-m depth) and LOOP (15- to 34-m depth).
Sediment Trap Collections.
We measured zooplankton fecal-pellet carbon captured in sediment traps during the spring, summer, and fall of 1991 and 1992. The baffled sediment traps were at a depth of 5 m and 15 m on a permanent mooring deployed in 20-m water depth at 28°50.41′ N and 90°26.03′ W off Terrebonne Bay on the southeastern Louisiana shelf, the center of the area where hypoxic bottom-water conditions prevail during summer (Fig. 2; ref. 23). The traps consisted of a simple cylinder with a surface area of 0.45 m2 and an aspect ratio of 3:1. Collections were funneled into a tube with brine solution (45 practical salinity units) and 1% glutaraldehyde. They were serviced at 1- to 3-week intervals, depending on weather conditions. Samples were split in a Folsom plankton splitter, stained with proflavine, and filtered through nested 63- and 20-μm Nitex screens. The particulate material was backwashed onto 8-μm cellulose filters, mounted on a glass slide, and counted and measured (width and length) under epifluorescence. A volume:carbon ratio was calculated from laboratory experiments of fecal-pellet carbon content that compared well with values reported in the literature. A rough estimate of the percentage of phytoplankton production captured was derived from comparisons of fecal-pellet carbon in bottom traps with estimates of seasonal primary production rates taken in earlier years (25).
Respiration Rates.
Water samples were collected in the area between the Mississippi and Atchafalaya River deltas in late July/early August 1992, July 1993, July 1994, April 1994, and March 1998. Water-column respiration rates were made with replicate subsamples of water collected within 3 m of the seabed using a Rosette sampler. We used an automatic titrating system to determine oxygen concentrations in enclosed samples incubated for 24 h. This approach is similar to that used by others (26, 27). Replicate water samples were carefully put into acid-washed 300-ml biological oxygen demand bottles to flush the contents at least three times and in a manner to avoid introducing air bubbles. These bottles were subsequently stored in the dark within 2°C of the in situ water temperature. Three or four samples were withdrawn from one bottle on four separate occasions over 24 h to determine the oxygen concentration with a Mettler Metrohm titrator that had a potentiometric titration end point with a precision of 0.0005 ml (delivery volume). The oxygen concentration was averaged for each bottle, and a linear regression of oxygen concentration versus time was made to determine oxygen respiration (mg oxygen per liter per h), after correcting for bottle size and titrant strength. About 15% of the experiments were considered unacceptable because of a poor statistical fit (r2 < 0.80). These rejected results were mostly for samples with low respiration rates. The in situ oxygen concentration was divided by the estimated oxygen consumption rate to develop a turnover rate (days to depletion) for the water mass. The data were analyzed by using a PC-based statistical analysis software package. All analyses reported are significant at the 95% confidence level.
Pigments.
Chlorophyll a (Chl a) pigment determinations were conducted on the same water samples analyzed for respiration rates. We used Whatman GF/F filters which were subsequently fixed in 5 ml of dimethyl sulfoxide/90% acetone, 2:3 (vol/vol) solution and allowed to extract for at least 1 h in the dark. A Turner Model 10 fluorometer was used to measure fluorescence after pre- and postacidification. The fluorometer was calibrated with a chemical supply house Chl a standard measured on a spectrophotometer.
RESULTS AND DISCUSSION
Copepods that selectively graze diatoms may have a competitive advantage over the non-copepod zooplankton that do not graze diatoms as efficiently when diatom production is high. When diatom availability is reduced, copepods that favor diatoms as prey, and copepod predators may be outcompeted by other zooplankton that prefer to feed on non-diatom organisms. The abundance and impact of the copepod community may reflect the relative availability of diatoms if these are strong preferences, as suspected. This result was seen in all parts of the food web that we investigated.
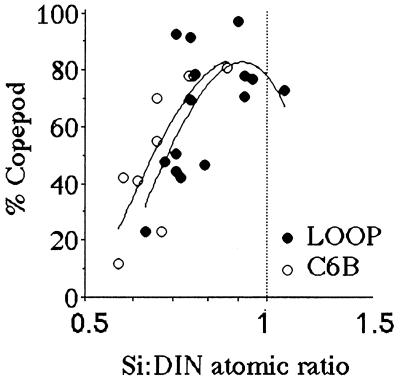
The percentage of copepods in the total mesozooplankton assemblage changes dramatically as the average Si:DIN ratio in the Mississippi River during the 90 days before each sampling interval approaches 1:1 (Fig. 3). Copepods made up about 30% of the mesozooplankton at a Si:DIN ratio of 0.5, and 75% at 1.0.
Figure 3.
The percent of the mesozooplankton community that are copepods for samples collected at the LOOP and C6B stations (see Fig. 2) from March through November from 1979 through 1983. The horizontal axis is the ratio of dissolved Si:DIN in the Mississippi River for the preceding 90 days. A polynomial fit of the data is shown. The data table for this figure appears as supplementary material on the PNAS web site (www.pnas.org).
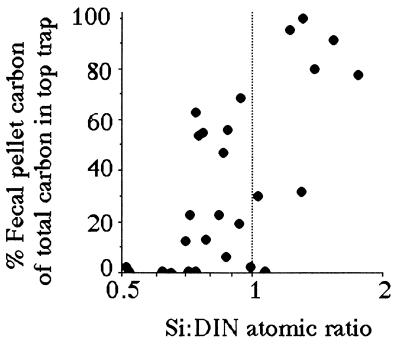
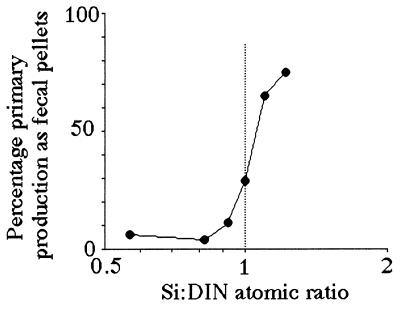
Both the percentage of fecal-pellet carbon in the top trap and the estimated primary production (g C per m2 per year) captured as fecal pellets is high when the average Si:DIN atomic ratio in the river is greater than 1:1 (Figs. 4 and 5). These two patterns are consistent with the expectation that copepod density and grazing rates will be higher when production of the principal prey, diatoms, is higher. The Si:DIN ratio of 1:1 (the Redfield ratio; see ref. 28) is a maximum for the data shown in Fig. 3 and a pivot point for the data in Figs. 4 and 5. These results thus support Officer and Ryther’s hypothesis (22).
Figure 4.
The percent of the carbon collected in the surface sediment trap that was fecal pellets vs. the average Si:DIN ratio for the preceding 90 days. The data table for this figure appears as supplementary material on the PNAS web site (www.pnas.org).
Figure 5.
The percentage of the estimated water-column phytoplankton production captured in a sediment trap as fecal pellets at 15 m (total depth = 20 m) vs. the average Si:DIN atomic ratio in riverine water for the 90 days before the middle of the sediment-trap deployment period. The data table for this figure appears as supplementary material on the PNAS web site (www.pnas.org).
Community plankton respiration rates varied between 0.0008 and 0.29 mg oxygen per liter per h, sufficient to reduce the in situ oxygen concentration to 0 in less than 4 weeks. Respiration rates per unit phytoplankton pigment were highest in the spring, in shallower waters, and declined away from the delta. These are significant rates because hypoxic bottom water (oxygen <2 mg per liter) in the northern Gulf of Mexico may cover up to 18,000 km2 during midsummer on the inner continental shelf, extending from the Mississippi River delta to the northeastern Texas coast (16, 29). Oxygen-depleted bottom waters occur as early as February and last until October, but are most widespread, severe, and persistent from June through August. The intensity of oxygen depletion is related to oxygen uptake rates as well as stability of the water column during spring and summer (16).
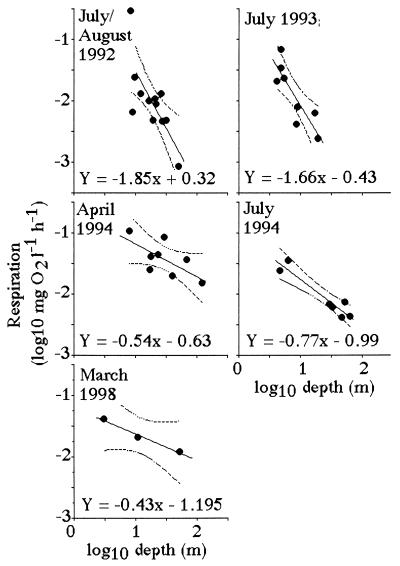
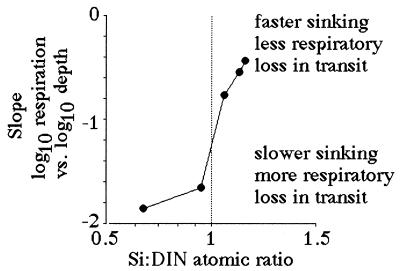
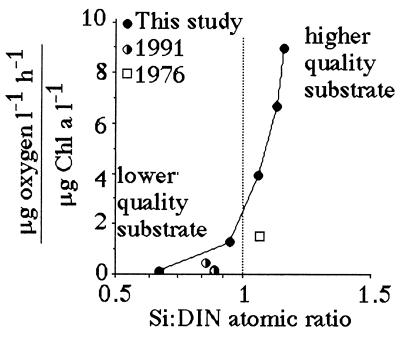
Suess (19) demonstrated that respiration rates in the open ocean are directly proportional to organic production in surface layers and inversely related to depth. The same log:log relationship between respiration and depth holds for the Mississippi River continental shelf (Fig. 6). A significant relationship exists between the slope of the respiration-vs.-depth relationship from each cruise and the dissolved Si:DIN atomic-loading ratios in the Mississippi River (Fig. 7). When the Si:DIN ratio is high, respiration rates decline with depth more slowly than when this ratio is low. This result is consistent with the idea that faster sinking rates will result in less organic matter consumption in transit to the bottom, and a more uniform distribution of respiration rates in near-bottom waters of different depths. Because the diatom-rich fecal pellets travel more quickly to the bottom than diatom-poor fecal pellets, the respiration rate per Chl a in the bottom water increases with the increasing Si:DIN ratio of the freshwater entering the study area (Fig. 8).
Figure 6.
Relationships between the estimated water-column respiration [log10(mg oxygen per liter per h); near-bottom] and log10 sample depth (m). A 95% confidence interval for the dependent variable Y is shown with dotted lines. The data table for this figure appears as supplementary material on the PNAS web site (www.pnas.org).
Figure 7.
The slope of log10 respiration vs. log10 depth relationship (from Fig. 6) and the average Si:DIN atomic ratio in riverine water for the 90 days before each sampling cruise.
Figure 8.
The respiration rate per total Chl a concentration (μg oxygen per liter per h)/(μg Chl a per liter) in bottom water for three different studies vs. Si:DIN atomic ratio (±1 SE). The 1991 and 1976 data are from refs. 30 and 31, respectively; our study used different methods and surveyed a greater depth range. The data table for this figure appears as supplementary material on the PNAS web site (www.pnas.org).
These results support the hypotheses that (i) there is a strong vertical, rather than horizontal, coupling between oxygen consumption in bottom waters and organic loading from surface waters and (ii) higher water-column respiration rates are driven by river-derived nutrients stimulating in situ organic production that sinks to the bottom layers.
These results also support the hypothesis that respiration rates in bottom waters are responsive to zooplankton fecal-pellet production and to diatom production. The heavily silicified diatoms, produced mainly in high-discharge spring conditions, sink faster than diatoms with lightly silicified frustules produced in low-flow summer conditions, especially when packaged as fecal pellets. The proportion of primary production formed into fecal pellets, the water column respiration rate, and near-bottom respiration rates are sensitive to the Si:DIN ratio in the riverine waters, and change dramatically near the Redfield ratio.
Thus, the patterns in diatom production, copepod abundance, copepod fecal matter quantity and quality, and resultant bottom-water respiration rates are consistent with the implications of Officer and Ryther’s hypothesis (22), even at the scale of a continental shelf (Table 1). The results demonstrate the importance of Redfield’s suggestion (28) that these ratios have a functional physiological basis and that they provide a framework for understanding the nutritional limits on planktonic food webs. The Si:DIN elemental ratio in the Mississippi River has varied on both seasonal and annual scales this century because of anthropogenic influences (2), and the organic production on this shelf has increased in the last 30 years (32); both of these factors have affected bottom-water oxygen dynamics (33). Both the magnitude of primary production and the food web of this shelf are intimately influenced by land-use practices far removed from the coastal zone. The implications of these results are that this system is poised to exhibit either of two very different food webs. If flagellated algae become dominant, it does not mean that the size of the hypoxic water mass will end. The potentially harmful blooms of flagellated algae, for example, may contribute to hypoxic water formation if sufficient biomass sinks from the surface layer to the bottom layer (34).
Table 1.
Summary of observations and probable consequences with Si:DIN atomic ratios near 1:1 and less than 1:1
| Si:DIN
|
||
|---|---|---|
| < 1:1 | 1:1 or > 1:1 | |
| Observed | ||
| Copepod of meso-zooplankton, % | Low | Dominant |
| Carbon in sediment trap that are fecal pellets, % | Low | High |
| Fecal pellets of primary production, % | Low | Dominant |
| Sinking rate of surface carbon produced | Slower | Faster |
| Respiration per Chl a in bottom waters | Lower | Higher |
| Respiration losses in bottom waters | Lower | Higher |
| Implications | ||
| Potential for flagellated algal blooms, including harmful algal blooms | Higher | Lower |
| Bottom water hypoxia zone | Smaller | Continuing |
Supplementary Material
Acknowledgments
We thank L. Brunet, D. DeLaune, S. Kaswadji, and T. A. Oswald for various laboratory analyses, and J. Kastler for constructive review of the manuscript. This research was supported by grants from the National Oceanic and Atmospheric Administration (NOAA), the NOAA National Undersea Research Center, the NOAA Nutrient Enhanced Coastal Ocean Productivity (NECOP) Program, and the U.S. Minerals Management Service.
ABBREVIATIONS
- DIN
dissolved inorganic nitrogen
- Chl a
chlorophyll a
Footnotes
This paper was submitted directly (Track II) to the Proceedings Office.
References
- 1. Smith S V. Limnol Oceanogr. 1984;29:1149–1160. [Google Scholar]
- 2.Hecky R E, Kilham P. Limnol Oceanogr. 1988;33:796–822. [Google Scholar]
- 3.Howarth R W. Annu Rev Ecol Syst. 1988;19:89–110. [Google Scholar]
- 4.Cloern J E. Rev Geophys. 1996;34:127–168. [Google Scholar]
- 5.Malone T C, Conley D J, Fisher T R, Gilbert P M, Hardin L W. Estuaries. 1996;19:371–385. [Google Scholar]
- 6.Nixon S W, Ammerman J W, Atkinson L P, Berounsky V M, Billen G, Boicourt W C, Boynton W R, Church T M, DiToro D M, Elmgren R, et al. Biogeochemistry. 1996;35:141–180. [Google Scholar]
- 7.Rosenberg R. Mar Poll Bull. 1985;16:227–231. [Google Scholar]
- 8.Shumway S E. J World Aquacult Soc. 1990;21:65–104. [Google Scholar]
- 9.Smayda T J. In: Toxic Marine Phytoplankton. Granneli E, Sundstrom B, Edler R, Anderson D M, editors. New York: Elsevier; 1990. pp. 29–40. [Google Scholar]
- 10.Caddy J F. Rev Fish Sci. 1993;1:57–95. [Google Scholar]
- 11.Diaz R J, Rosenberg R. Oceanogr Mar Biol Annu Rev. 1995;33:245–303. [Google Scholar]
- 12.Justic’ D, Rabalais N N, Turner R E. Mar Poll Bull. 1995;30:41–46. [Google Scholar]
- 13.Elser J J, Dobberfuhl D R, Mackay N A, Schampel J H. Bioscience. 1996;46:674–684. [Google Scholar]
- 14.Sterner R W, Hessen D O. Annu Rev Ecol Syst. 1994;25:1–29. [Google Scholar]
- 15.Turner R E, Rabalais N N. Bioscience. 1991;41:140–147. [Google Scholar]
- 16.Rabalais N N, Turner R E, Justic’ D, Dortch Q, Wiseman W J, Jr, Sen Gupta B K. Estuaries. 1996;19:386–407. [Google Scholar]
- 17.Brzezinski M A. J Phycol. 1985;21:347–357. [Google Scholar]
- 18.Dugdale R C, Wilkerson F P. Nature (London) 1998;391:270–273. [Google Scholar]
- 19.Suess E. Nature (London) 1980;288:260–263. [Google Scholar]
- 20.Rowe G T, Clifford C H, Smith K L, Hamilton P L. Nature (London) 1975;255:215–217. [Google Scholar]
- 21.Ittekkot V, Schäfer P, Honjo S, Depetris P J, editors. Particle Flux in the Ocean. New York: Wiley; 1996. [Google Scholar]
- 22.Officer C B, Ryther J H. Mar Ecol Prog Ser. 1980;3:83–91. [Google Scholar]
- 23.Qureshi N A. Ph.D. Dissertation. Baton Rouge: Louisiana State University; 1995. [Google Scholar]
- 24.Shaw R F, Cope J, Edds K A. In: Data Analysis of the LOOP Estuarine and Marine Monitoring Program 1978–95. Sasser C E, Visser J M, editors. Vol. 4. Louisiana State University, Baton Rouge: Louisiana Transportation Research Center; 1997. [Google Scholar]
- 25.Sklar F H, Turner R E. Contrib Mar Sci. 1981;24:93–106. [Google Scholar]
- 26.Williams P J LeB. Oceanologica Acta. 1981;4:359–364. [Google Scholar]
- 27.Pomeroy L R, Deibel D. Science. 1986;233:359–361. doi: 10.1126/science.233.4761.359. [DOI] [PubMed] [Google Scholar]
- 28.Redfield A C. Am Sci. 1958;46:205–222. [Google Scholar]
- 29.Rabalais N N, Turner R E, Wiseman W J, Jr, Dortch Q. Regulated Rivers. 1998;14:161–177. [Google Scholar]
- 30.Dortch Q, Rabalais N N, Turner R E, Rowe G T. Estuaries. 1994;17:862–872. [Google Scholar]
- 31.Turner R E, Allen R L. Contrib Mar Sci. 1982;25:173–179. [Google Scholar]
- 32.Turner R E, Rabalais N N. Nature (London) 1994;368:619–621. [Google Scholar]
- 33.Sen Gupta B K, Turner R E, Rabalais N N. Geology. 1996;24:227–230. [Google Scholar]
- 34.Armstrong R S. Natl Oceanic Atmos Adm Prof Pap. 1979;11:137–148. [Google Scholar]
Associated Data
This section collects any data citations, data availability statements, or supplementary materials included in this article.


