

Abstract
We investigated the control of movement in 12 patients with Parkinson’s disease (PD) after they received surgically implanted high-frequency stimulating electrodes in the subthalamic nucleus (STN). The experiment studied ankle strength, movement velocity, and the associated electromyographic patterns in PD patients, six of whom had tremor at the ankle. The patients were studied off treatment, ON STN deep brain stimulation (DBS), on medication, and on medication plus STN DBS. Twelve matched control subjects were also examined. Medication alone and STN DBS alone increased patients’ ankle strength, ankle velocity, agonist muscle burst amplitude, and agonist burst duration, while reducing the number of agonist bursts during movement. These findings were similar for PD patients with and without tremor. The combination of medication plus STN DBS normalized maximal strength at the ankle joint, but ankle movement velocity and electromyographic patterns were not normalized. The findings are the first to demonstrate that STN DBS and medication increase strength and movement velocity at the ankle joint.
Keywords: deep brain stimulation, subthalamic nucleus, bradykinesia, electromyography, Parkinson’s disease, tremor
Deep brain stimulation (DBS) of the subthalamic nucleus (STN) minimizes tremor, rigidity, and bradykinesia in Parkinson’s disease (PD).1 STN DBS restores basic upper limb motor functions, such as arm movement speed,2,3 grip force control,4 and wrist strength,5 reduces tremor,6 and improves oral force control.7 Similar studies of the lower extremities are lacking. This is surprising since the volitional control of the ankle joint is critical in motor behaviors such as postural stance and walking.
This study examined the effects of unilateral STN DBS and medication (Meds) on the control of the ankle joint. First, in the upper limb, PD patients are weaker than healthy individuals and levodopa increases upper limb strength.8,9 We examined the degree to which DBS and Meds increased strength at the ankle joint. Second, we previously demonstrated that DBS and Meds act through similar mechanisms of action by scaling the amplitude and temporal properties of the electromyographic (EMG) signal during elbow movement.3 We aimed to determine if the same neuromuscular properties are modulated by DBS and Meds at the ankle joint. Third, the extent of the benefit of Meds plus STN DBS on neural recruitment strategies of the lower extremities in patients with PD is unclear.2,10 We therefore compared PD patients on Meds plus DBS with matched healthy individuals. Fourth, we examined if the combined treatments improved ankle function independent of tremor. Finally, we assessed the correlation between the change off treatment to on Meds plus STN DBS between our motor control measures and questions from the Unified Parkinson’s Disease Rating Scale (UPDRS) associated with postural control and gait.
PATIENTS AND METHODS
Twelve PD patients participated 4 –9 months after quadripolar stimulating electrodes were implanted unilaterally in the STN (Table 1). Six patients had tremor in the off state, and six did not. The stimulator pulse width was 60 μsec and the frequency was 185 Hz. Also, 12 age- and gender-matched control subjects were examined (mean age: 52 years).
TABLE 1.
Patient profiles
| Postsurgery motor UPDRS score
|
|||||||
|---|---|---|---|---|---|---|---|
| Age (yr) | Gender | Stimulation level (V) | Off treatment | DBS | Meds | Meds and DBS | Antiparkinsonian medications |
| 43, T | F | 2.8 | 54 | 15 | 22 | 7 | Carbidopa/levodopa 25/100 0.5 tab |
| 53, T | F | 2.0 | 34 | 28 | 2 | 6 | Carbidopa/levodopa 25/100 1 tab |
| 63, T | F | 2.9 | 28 | 23 | 8 | 7 | Carbidopa/levodopa CR 50/200 1 tab; carbidopa/levodopa 25/100 0.5 tabs; pramipexole 1 mg 1 tab; entacapone 200 mg 1 tab |
| 65, NT | F | 1.8 | 25 | 21 | 6 | 6 | Carbidopa/levodopa CR 25/100 1 tab; pramipexole 1.5 mg 1 tab |
| 46, T | M | 2.1 | 37 | 9 | 8 | 2 | Carbidopa/levodopa 25/100 3 tabs; pramipexole 1 mg 3 tabs |
| 47, T | M | 2.0 | 36 | 21 | 10 | 7 | Carbidopa/levodopa 25/100 1.5 tabs |
| 47, NT | M | 2.0 | 44 | 33 | 17 | 14 | Carbidopa/levodopa CR 50/200 1 tab; carbidopa/levodopa 25/100 1 tab; pergolide 1 mg 1 tab; amantadine 100 mg 1 tab |
| 53, NT | M | 2.0 | 19 | 14 | 3 | 2 | Carbidopa/levodopa 25/100 2 tabs; ropinerole 5 mg 2 tabs; amantadine 100 m g 1 tab; entacapone 200 mg 2 tabs |
| 62, T | M | 3.1 | 33 | 27 | 3 | 2 | Carbidopa/levodopa CR 50/200 1.5 tabs; carbidopa/levodopa 25/100 1 tab; entacapone 200 mg 1 tab; pergolide 1 mg 1 tab |
| 59, NT | M | 2.5 | 45 | 35 | 33 | 25 | Carbidopa/levodopa CR 50/200 1 tab; carbidopa/levodopa 25/100 1 tab; pramipexole 0.5 mg 2 tabs |
| 60, NT | M | 1.5 | 31 | 21 | 19 | 14 | Carbidopa/levodopa 25/250 2 tabs; ropinerole 2 mg 2 tab |
| 34, NT | M | 5.3 | 7 | 4 | 4 | 3 | Carbidopa/levodopa 25/100 2 tabs; pramipexole 1 mg 1 tab |
T, patient with tremor; NT, patient without tremor.
Patients were included if they had idiopathic PD by accepted criteria11 and postoperative reduction of greater than 15% in the UPDRS motor section off treatment compared to STN DBS. Six of the 12 patients were previously studied at the elbow joint,3 and 8 were previously studied for hand tremor.6 All subjects gave informed consent in accordance with the local institutional review board and Declaration of Helsinki.
Treatment Design
The experiments were performed on consecutive days in each treatment condition: (1) off treatment; (2) STN DBS; (3) Meds; and (4) Meds plus STN DBS. On day 1, condition 1 occurred between 9 and 11 am and condition 2 between 1 and 3 pm. On day 2, the same testing schedule as day 1 was set for conditions 3 and 4, respectively. The control subjects were tested on 1 day.
Patients were tested after a 12-hour withdrawal from the specific treatment.12,13 The UPDRS motor section was administered 90 minutes after activation of the stimulator.14 Resumption of optimal levodopa therapy began after testing on day 1 and continued through day 2 of testing. On day 2, all patients took Meds between 6 and 7am and then again at 9 am. Forty-five minutes after the 9 am dosage, the UPDRS motor section was administered to ensure that Meds efficacy was optimized. Motor control testing then proceeded. For the afternoon session on day 2, patients took Meds at 12:30 pm, and the same protocol for the morning session was followed. For all patients in this study, the afternoon testing session commenced 50 minutes later. At each dose, patients took the Meds listed in Table 1. These Meds are the presurgery doses because this represents the optimal Meds treatment determined by the neurologist.15
Motor Control Testing
Experimental Apparatus
The subject viewed a computer monitor displaying cursor and a target. The cursor represented ankle torque for the strength task (N.m) or ankle angle for the movement task (degrees). The subject was seated with the knees and hip flexed to 90°. The chair height remained constant. The foot rested in a ski boot manipulandum that rotated in the sagittal plane. The axis of rotation was aligned with the ankle joint. When the ankle joint was at 90°, the angle transducer reading was defined as 0°. Joint angular position was measured by a transducer mounted on the shaft at the axis of rotation. Velocity was obtained by differentiating the analog angle signal. Joint acceleration was measured by digitally differentiating the velocity signal. Surface electromyographic (EMG) electrodes were placed on the tibialis anterior and soleus muscles. The EMG signals were amplified (gain = 1,000) and bandpass filtered between 20 and 450 Hz. All kinematic and EMG signals were digitized at 1,000 Hz.
Strength and Movement Task
During the strength task, the ankle was fixed to a position of 90°. The strength task required subjects to either dorsiflex or plantarflex as hard as possible on the manipulandum for three 6-second trials.
During the movement task, the subject was instructed to move the ankle as fast and accurately as possible to a 6° target on the visual display. During plantarflexion movements, the starting ankle angle was near the end of the range for dorsiflexion, and during dorsiflexion movements the starting ankle angle was near full plantarflexion. An auditory tone signaled the beginning of the movement. Movements were performed at a 24° distance in blocks of 10 in both plantarflexion and dorsiflexion. The subject was always given 10 practice trials per condition.
Data Analysis
Kinematic signals were preprocessed using a low-pass filter at 20 Hz (Butterworth second-order filter dual pass). The EMG records were first rectified and then low-pass–filtered at 50 Hz (Butterworth second-order filter dual pass)16 after digitizing.
Strength Task
For maximal torque, the highest torque sample was determined during the 6-second trial. Torque ± 100 msec around the maximal torque value was averaged. This calculation was performed on each trial and then averaged across the three trials for maximal torque.
Movement Task
Kinematic and EMG signals were marked consistent with previous work at the elbow.3 The following variables were calculated: peak velocity (degrees per second); agonist burst amplitude (mV; the mean EMG activity during the first agonist burst); agonist burst duration (in seconds; time period between the marked onset of the first agonist burst until its offset); number of agonist bursts (a count of the agonist bursts that began prior to peak velocity); and antagonist burst amplitude (mV; the average of the antagonist EMG signal for each trial from the marked onset of the agonist burst to the end of the movement).
Statistics
Between subjects, t tests compared PD patients off treatment to control subjects, as well as patients on both treatments to controls. In addition, we examined the influence of Meds and DBS using analyses of variance (ANOVA). Each analysis examined plantarflexion and dorsiflexion separately. Since the statistics were similar between plantarflexion and dorsiflexion, we only report dorsiflexion. Finally, correlation coefficients were calculated between the degree of improvement off treatment to on Meds plus DBS for the UPDRS question 26 (leg agility), question 30 (postural stability), the sum of questions 26 through 30 (27: arising from chair; 28: posture; 29: gait), movement velocity, and strength.
RESULTS
Ankle Strength
Effects of STN DBS and Meds
Table 2 indicates that ankle dorsiflexion torque was not significantly different between PD patients off treatment (mean = 26.02 N.m) and control subjects (32.1 N.m). DBS increased torque (33.4 N.m) and Meds increased torque (32.7 N.m), and there was no interaction between Meds and DBS (Table 2). There was no additive benefit of combining Meds and STN DBS versus Meds alone for ankle strength (Table 2).
TABLE 2.
Statistical analysis
| Maximum torque | Peak velocity | Ag amplitude | Ag duration | Number of Ag | Ant amplitude | |
|---|---|---|---|---|---|---|
| PD patients off treatment vs. control | 0.17 | <0.01 | <0.01 | <0.01 | <0.01 | <0.01 |
| Meds × DBS | ||||||
| Meds | <0.05 | <0.01 | <0.05 | <0.05 | <0.05 | 0.81 |
| DBS | <0.01 | <0.01 | <0.01 | <0.01 | <0.05 | 0.46 |
| Meds × DBS Interaction | 0.15 | 0.74 | 0.46 | 0.74 | 0.21 | 0.17 |
| Meds vs. Meds plus DBS | 0.15 | <0.01 | <0.01 | <0.05 | <0.01 | 0.85 |
| PD patients on both treatments vs. control | 0.40 | <0.01 | <0.01 | 0.21 | <0.01 | <0.01 |
Values are expressed as P.
Ag, agonist burst measured from electromyogram; Ant, antagonist burst from electromyogram.
Comparison of Both Treatments With Healthy Controls
The extent to which both treatments together normalized muscle strength was examined between patients on Meds plus DBS compared to the matched control subjects (Table 2). There was no difference between Meds plus DBS (35.5 N.m) and control subjects (32.1 N.m).
Ankle Movement and EMG Patterns
Individual Subject Patterns
Figure 1 depicts a patient without tremor performing dorsiflexion movements. Off treatment, peak velocity was very slow and the first agonist burst amplitude was 0.01 mV with a duration of 80 msec. ON DBS, peak velocity increased considerably, the agonist burst amplitude increased, and burst duration was longer. The Meds condition increased the peak velocity, increased the agonist burst amplitude, and extended agonist burst duration. Finally, Meds plus DBS increased peak velocity and further increased the agonist burst amplitude beyond Meds along and DBS alone.
FIG. 1.
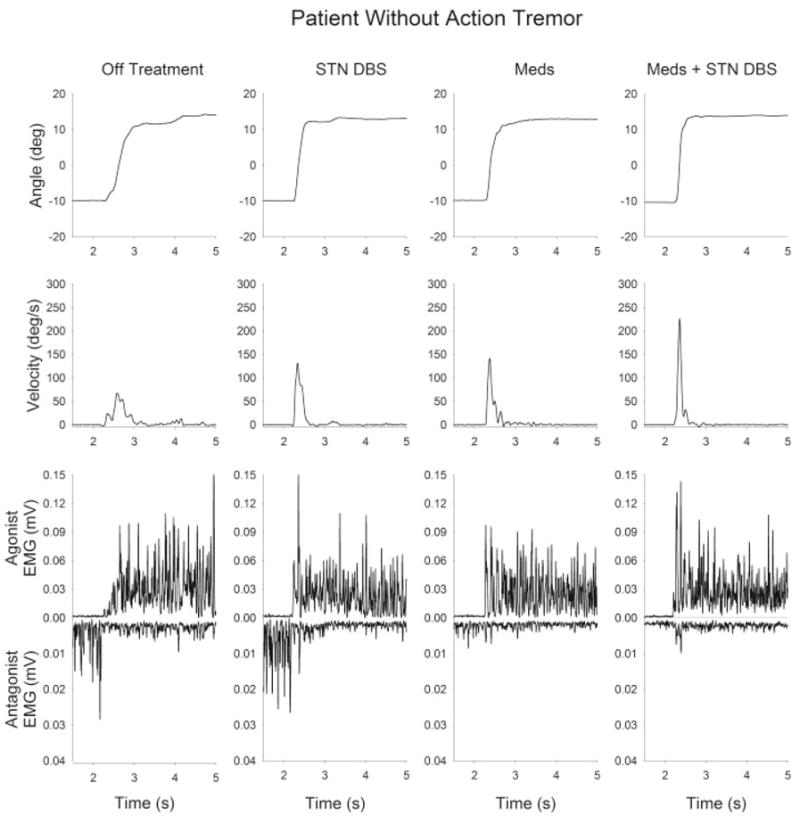
Kinematic and EMG time series from a bradykinetic patient with PD (patient 7, without tremor). Each trace shows data from a single trial of a 24° dorsiflexion ankle movement. From left to right, the panels represent the four postsurgery medication–stimulation conditions: off treatment, STN DBS, Meds, and Meds plus STN DBS. From top to bottom, the traces represent position, velocity, agonist EMG, and antagonist EMG.
The patient in Figure 2 has tremor and DBS and Meds were effective in reducing bradykinesia. Off treatment, the patient had a considerable tremor at 5 to 6 Hz, the duration of the tremor bursts were between 70 and 80 msec, and the ankle movement was very slow off treatment. DBS reduced the number of pathological EMG bursts prior to and during movement, along with reducing movement time and increasing burst duration. Meds were not as effective as DBS in reducing tremor prior to movement, but Meds did reduce movement time. The combination of Meds plus DBS had the greatest benefit in reducing bradykinesia.
FIG. 2.
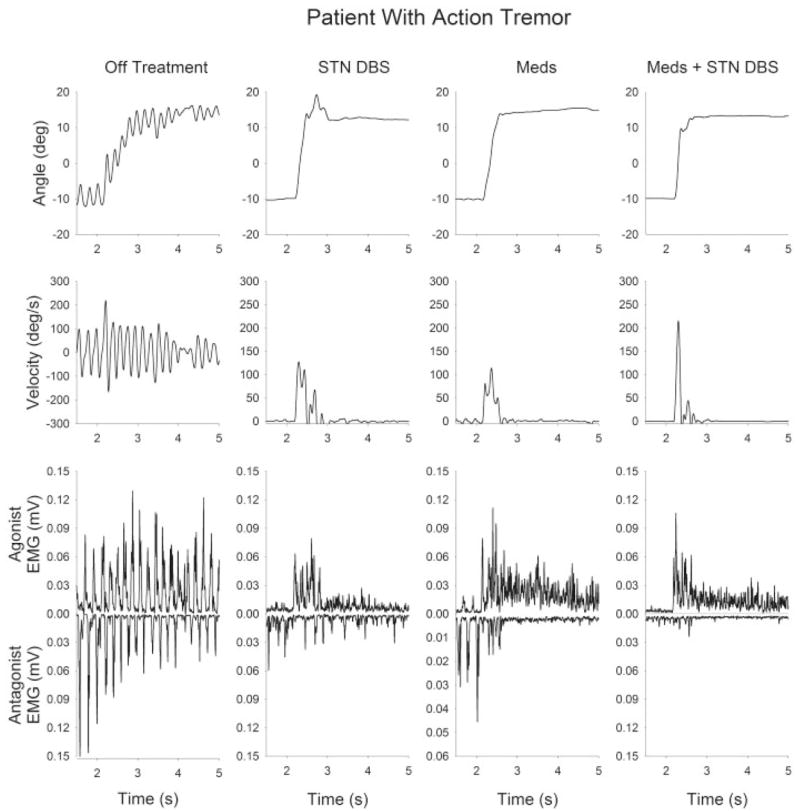
Kinematic and EMG time series from a bradykinetic patient with PD (patient 9, with tremor). Each trace shows data from a single trial of a 24° dorsiflexion ankle movement. From left to right, the panels represent the four postsurgery medication–stimulation conditions: off treatment, STN DBS, Meds, and Meds plus STN DBS. From top to bottom, the traces represent position, velocity, agonist EMG, and antagonist EMG.
Ankle Velocity and EMG Patterns
The relation between agonist burst amplitude and peak velocity had a linear relation across the speeds examined in this study (Fig. 3A). Meds and DBS effectively increased velocity and agonist burst amplitude, and the combination of the two treatments resulted in a greater velocity and agonist amplitude than either treatment alone (Table 2).
FIG. 3.
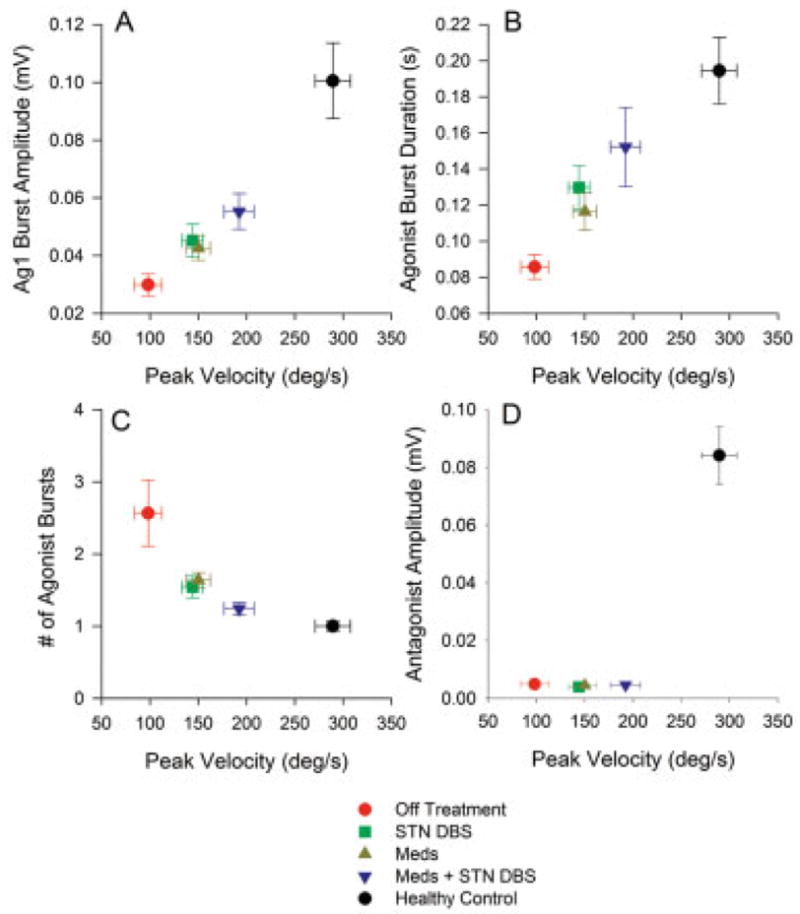
Across subject average (± SEM) of EMG measures for 24° dorsiflexion movements by parkinsonian patients across the four post-surgery medication–stimulation conditions and by healthy control subjects. Data are plotted against the corresponding across-subject average peak velocity. A: Amplitude of the agonist EMG burst. B: First agonist burst durations. C: The number of agonist bursts. D: The amplitude of the antagonist EMG burst.
For agonist burst duration (Fig. 3B, Table 2), there were no interactions between Meds and DBS. DBS increased first agonist burst duration, and Meds increased agonist burst duration. The combination of Meds plus DBS increased burst duration beyond the Meds-alone condition (Table 2).
DBS reduced the number of agonist bursts and Meds also reduced the number of bursts (Fig. 3C, Table 2). The combination of Meds plus DBS further reduced the number of agonist bursts beyond the effects of Meds alone (Table 2). Figure 3D demonstrates that the average antagonist burst amplitude did not change across the Meds and DBS conditions during dorsiflexion (Table 2). There was also no evidence for any change in average antagonist EMG burst amplitude when the Meds plus DBS condition was compared to Meds alone (Table 2).
Comparison of Both Treatments With Healthy Controls
The between-group ANOVAs determined that the combination of DBS and Meds did not normalize velocity and EMG patterns (Table 2). First, Meds plus DBS did not increase ankle movement velocity to the level of healthy individuals (Fig. 3A). Second, agonist burst amplitude was significantly greater in controls than in the Meds plus DBS condition. Third, the control group’s burst duration (Fig. 3B) was not statistically different from Meds plus DBS. Fourth, despite similar burst durations, healthy control subjects had a lower number of agonist bursts when compared to the Meds plus DBS condition. Fifth, Figure 3D shows that antagonist burst amplitude for patients on Meds plus DBS remained significantly lower than controls.
Did the Presence of Tremor Alter How Treatments Affected Velocity?
We examined a two-factor (group: tremor, no tremor; treatment: off, Meds plus DBS) repeated-measures ANOVA for patients with tremor and those without. Peak velocity increased from off treatment to on Meds plus DBS (P < 0.01). However, there was no difference in peak velocity between the tremor and no tremor groups (P = 0.63). Also, there was no significant interaction between the tremor group and treatment effect (P = 0.83).
Correlation Between off–on UPDRS (26 –30), Strength, and Velocity
We examined the correlation between strength and velocity with selected questions from the UPDRS. First, we calculated the difference between off treatment compared with on Meds plus DBS for each measure. Next, correlation coefficients were calculated between each dependent variable (Table 3). All correlations were non-significant with the exception of ankle dorsiflexion velocity and the UPDRS questions (26 –30). This correlation was positive, indicating that increased improvement in the lower extremity portion of the UPDRS was related to increased improvement in ankle velocity.
TABLE 3.
Correlation coefficient between the changes from off treatment to on Meds plus DBS for each dependent variable
| UPDRS 26 | UPDRS 30 | UPDRS,sum of 26–30 | Ankle MVC* | Ankle velocity | |
|---|---|---|---|---|---|
| UPDRS 26 | 1 | ||||
| UPDRS 30 | 0.25 | 1 | |||
| UPDRS, sum of 26–30 | 0.55 | 0.18 | 1 | ||
| Ankle MVC | 0.16 | 0.12 | 0.37 | 1 | |
| Ankle velocity | 0.45 | 0.08 | 0.72a | 0.1 | 1 |
MVC, maximal voluntary contraction.
P <.05.
DISCUSSION
Effects of STN DBS and Meds on Ankle Strength and Velocity
We found that STN DBS increased ankle strength and Meds increased ankle strength. This new finding for the lower extremity extends previous work, which has shown that antiparkinsonian Meds increased strength in the upper extremities.8,9 Our finding that STN DBS increased ankle strength also extends previous studies of wrist extension strength5 and oral force production.17 During wrist extension, bilateral DBS led to a 52% increase in peak torque5 and a 51% and 88% increase in maximal force from the upper and lower lips, respectively.17 In the current study, ankle strength was improved 28% by STN DBS and 24% by Meds.
During ankle movements, STN DBS and Meds had a robust effect on velocity and muscle activation patterns. STN DBS and Meds alter bradykinesia at the ankle by modifying the amplitude and temporal input to the motor neuron pool, and these findings are consistent with previous work at the elbow joint.3 We can only speculate that because the EMG patterns were similar at the ankle and elbow joints, the mechanism of action from STN DBS is similar across each joint. Indeed, the motor subdivision of the STN has been linked to the leg, arm, and orofacial structures in either one specific region14 or in multiple homunculi within STN.18,19 Electrophysiological studies also demonstrate a somatotopy within the STN for upper and lower limb joints.20 –22 The human STN is approximately 240 mm3,23 and the upper and lower limb subdivisions are spatially close and covered by DBS current spread within the STN.24 Thus, it follows that in a similar task performed at the ankle and elbow joints, the mechanism of action may be similar and result in consistent EMG patterns for the ankle and elbow joints.
Our finding of increased ankle velocity is also consistent with studies that have used the UPDRS and gait kinematics to assess the lower extremities. For instance, STN DBS increased walking velocity on a treadmill10 and overground walking.2 STN DBS reduced the postural scores at 6 months postsurgery25 and the postural score was maintained 5 years after surgery.1 Our finding of a significant correlation between the degree of improvement in ankle velocity and questions 26 –30 from the UPDRS demonstrate the behavioral significance of the velocity effects.
The literature on the effects of DBS on postural sway and postural reactions provides less uniform findings. Maurer and colleagues26 showed that although STN stimulation improved postural stability when measured by the UPDRS, the abnormal postural reactions following a visual tilt were resistant to treatment with Meds and STN DBS. In the same study, STN DBS increased patients’ postural sway amplitude further away from healthy individuals, while work from a different laboratory has shown reduced sway amplitude following DBS surgery.27,28 Because gait and postural stance rely on intersegmental coupling from the trunk and upper limbs as well as sensory information from visual, somatosensory, and vestibular sources, it is very difficult to determine which of these mechanisms STN DBS may be affecting positively or negatively. For this reason, the current findings are important because we have unequivocally shown that STN DBS improves the neural recruitment strategies of the muscles controlling the ankle joint, thus leading to increased strength and movement velocity.
Comparing Healthy Individuals With Patients On Meds and STN DBS
The study also examined the extent to which Meds plus STN DBS improves control of the ankle joint for PD patients in comparison with healthy individuals. This issue is important because of the widespread use of the ankle joint during gait, sit to stand, and other postural tasks. Although the UPDRS has previously shown that STN DBS and Meds are efficacious for lower extremity function,1,25 the UPDRS does not provide objective quantifiable measures that can be used for direct comparison with neurologically healthy individuals. We found that PD patients on Meds and STN DBS produced maximal torque consistent with the ankle torque generated by healthy individuals. In contrast, during the movement task, the PD patients on both treatments remained different from control subjects. On average, the velocity of control subjects was 290 degrees per second, whereas ankle velocity from PD patients on Meds plus STN DBS was less than 200 degrees per second, thus representing a 45% difference from PD patients to control subjects. The difference in ankle velocity was supported by differences in muscle activation between PD patients and control subjects. The healthy individuals produced fewer agonist bursts than PD patients on Meds plus STN DBS, and the PD patients agonist burst amplitude was also reduced. We cannot exclude the possibility that a higher levodopa dose may have brought the PD patients’ velocity closer to the control subjects’ velocity. We chose to study the optimal levodopa treatment because we wanted to understand how the treatments affect patients during their daily lives, and a suprathreshold dose is not something that patients typically encounter on a daily basis.
One possible explanation for the different findings for the movement and strength task between groups is that the strength task is static and the movement task is dynamic. Previous work in the basal ganglia using fMRI has shown that in healthy individuals, the STN and GPi are critical in internally regulating the rate of change of force production during dynamic force contractions.29 If the mechanism of action of DBS blocks the transmission of altered patterns of neuronal activity in the basal ganglia to its target structures in the thalamus and brainstem,30 then DBS may be blocking the ability of the basal ganglia to assist in regulating movement speed. By removing the aberrant basal ganglia signal, maximal ankle strength could have been achieved by using other cortical and cerebellar structures. To examine this issue, we correlated the percent improvement off treatment to on Meds plus STN DBS for both strength and velocity and found that the correlation was not significant (Table 3). This suggests independence between the efficacy of the two treatments on strength and velocity.
Bradykinesia and Tremor at Ankle
The issue of tremor is important because it is critical to determine if STN DBS is efficacious for patients who present with different symptoms. In this study, we found that STN DBS alone and Meds alone each had a similar effect on movement velocity in patients with and without tremor. One important issue to note is that the statistical comparison for the tremor and no-tremor groups included six subjects. Since the P values did not approach significance, we do not feel that the sample size was a limiting factor. Thus, the clinically important finding from this study was that STN DBS and Meds were effective for both patients with and without tremor.
Acknowledgments
This study was supported by the National Institutes of Health (R01-AR-33189, R01-NS-28127, R01-NS-40902, R01-NS-52318, and F32-NS-44727). We thank Medtronic (Minneapolis, MN) for donating the Medtronic Console Programmer (model 7432) for use in this study.
References
- 1.Krack P, Batir A, Van Blercom N, et al. Five-year follow-up of bilateral stimulation of the subthalamic nucleus in advanced Parkinson’s disease. N Engl J Med. 2003;349:1925–1934. doi: 10.1056/NEJMoa035275. [DOI] [PubMed] [Google Scholar]
- 2.Bastian AJ, Kelly VE, Revilla FJ, et al. Different effects of unilateral versus bilateral subthalamic nucleus stimulation on walking and reaching in Parkinson’s disease. Mov Disord. 2003;18:1000–1007. doi: 10.1002/mds.10493. [DOI] [PubMed] [Google Scholar]
- 3.Vaillancourt DE, Prodoehl J, Metman LV, et al. Effects of deep brain stimulation and medication on bradykinesia and muscle activation in Parkinson’s disease. Brain. 2004;127:491–504. doi: 10.1093/brain/awh057. [DOI] [PubMed] [Google Scholar]
- 4.Wenzelburger R, Zhang BR, Poepping M, et al. Dyskinesias and grip control in Parkinson’s disease are normalized by chronic stimulation of the subthalamic nucleus. Ann Neurol. 2002;52:240–243. doi: 10.1002/ana.10254. [DOI] [PubMed] [Google Scholar]
- 5.Brown RG, Dowsey PL, Brown P, et al. Impact of deep brain stimulation on upper limb akinesia in Parkinson’s disease. Ann Neurol. 1999;45:473–488. doi: 10.1002/1531-8249(199904)45:4<473::aid-ana9>3.0.co;2-v. [DOI] [PubMed] [Google Scholar]
- 6.Sturman MM, Vaillancourt DE, Metman LV, et al. Effects of subthalamic nucleus stimulation and medication on resting and postural tremor in Parkinson’s disease. Brain. 2004;127:2131–2143. doi: 10.1093/brain/awh237. [DOI] [PubMed] [Google Scholar]
- 7.Pinto S, Gentil M, Fraix V, et al. Bilateral subthalamic stimulation effects on oral force control in Parkinson’s disease. J Neurol. 2003;250:179–187. doi: 10.1007/s00415-003-0966-7. [DOI] [PubMed] [Google Scholar]
- 8.Corcos DM, Chen CM, Quinn NP, et al. Strength in Parkinson’s disease: relationship to rate of force generation and clinical status. Ann Neurol. 1996;39:79–88. doi: 10.1002/ana.410390112. [DOI] [PubMed] [Google Scholar]
- 9.Robichaud JA, Pfann KD, Comella CL, Corcos DM. Effect of medication on EMG patterns in individuals with Parkinson’s disease. Mov Disord. 2002;17:950–960. doi: 10.1002/mds.10218. [DOI] [PubMed] [Google Scholar]
- 10.Faist M, Xie J, Kurz D, et al. Effect of bilateral subthalamic nucleus stimulation on gait in Parkinson’s disease. Brain. 2001;124:1590–1600. doi: 10.1093/brain/124.8.1590. [DOI] [PubMed] [Google Scholar]
- 11.Hughes AJ, Ben-Shlomo Y, Daniel SE, Lees AJ. What features improve the accuracy of clinical diagnosis in Parkinson’s disease: a clinicopathologic study. Neurology. 1992;42:1142–1146. doi: 10.1212/wnl.42.6.1142. [DOI] [PubMed] [Google Scholar]
- 12.Langston JW, Widner H, Goetz CG, et al. Core assessment program for intracerebral transplantation (CAPIT) Mov Disord. 1992;7:2–13. doi: 10.1002/mds.870070103. [DOI] [PubMed] [Google Scholar]
- 13.Temperli P, Ghika J, Villemure JG, et al. How do parkinsonian signs return after discontinuation of subthalamic DBS? Neurology. 2003;60:78–81. doi: 10.1212/wnl.60.1.78. [DOI] [PubMed] [Google Scholar]
- 14.Monakow KH, Akert K, Kunzle H. Projections of the precentral motor cortex and other cortical areas of the frontal lobe to the subthalamic nucleus in the monkey. Exp Brain Res. 1978;33:395–403. doi: 10.1007/BF00235561. [DOI] [PubMed] [Google Scholar]
- 15.Kumar R, Lozano AM, Kim YJ, et al. Double-blind evaluation of subthalamic nucleus deep brain stimulation in advanced Parkinson’s disease. Neurology. 1998;51:850–855. doi: 10.1212/wnl.51.3.850. [DOI] [PubMed] [Google Scholar]
- 16.Vaillancourt DE, Larsson L, Newell KM. Effects of aging on force variability, single motor unit discharge patterns, and the structure of 10, 20, and 40 Hz EMG activity. Neurobiol Aging. 2003;24:25–35. doi: 10.1016/s0197-4580(02)00014-3. [DOI] [PubMed] [Google Scholar]
- 17.Gentil M, Garcia-Ruiz P, Pollak P, Benabid AL. Effect of stimulation of the subthalamic nucleus on oral control of patients with parkinsonism. J Neurol Neurosurg Psychiatry. 1999;67:329–333. doi: 10.1136/jnnp.67.3.329. [DOI] [PMC free article] [PubMed] [Google Scholar]
- 18.Nambu A, Takada M, Inase M, Tokuno H. Dual somatotopical representations in the primate subthalamic nucleus: evidence for ordered but reversed body-map transformations from the primary motor cortex and the supplementary motor area. J Neurosci. 1996;16:2671–2683. doi: 10.1523/JNEUROSCI.16-08-02671.1996. [DOI] [PMC free article] [PubMed] [Google Scholar]
- 19.Nambu A, Tokuno H, Inase M, Takada M. Corticosubthalamic input zones from forelimb representations of the dorsal and ventral divisions of the premotor cortex in the macaque monkey: comparison with the input zones from the primary motor cortex and the supplementary motor area. Neurosci Lett. 1997;239:13–16. doi: 10.1016/s0304-3940(97)00877-x. [DOI] [PubMed] [Google Scholar]
- 20.DeLong M, Crutcher M, Georgopoulos A. Primate globus pallidus and subthalmic nucleus: functional organization. J Neurophysiol. 1985;53:530–543. doi: 10.1152/jn.1985.53.2.530. [DOI] [PubMed] [Google Scholar]
- 21.Bergman H, Wichmann T, Karmon B, DeLong MR. The primate subthalamic nucleus: II, neuronal activity in the MPTP model of parkinsonism. J Neurophysiol. 1994;72:507–520. doi: 10.1152/jn.1994.72.2.507. [DOI] [PubMed] [Google Scholar]
- 22.Wichmann T, Bergman H, DeLong MR. The primate subthalamic nucleus: I, functional properties in intact animals. J Neurophysiol. 1994;72:494–506. doi: 10.1152/jn.1994.72.2.494. [DOI] [PubMed] [Google Scholar]
- 23.Hardman CD, Henderson JM, Finkelstein DI, et al. Comparison of the basal ganglia in rats, marmosets, macaques, baboons, and humans: volume and neuronal number for the output, internal relay, and striatal modulating nuclei. J Comp Neurol. 2002;445:238–255. doi: 10.1002/cne.10165. [DOI] [PubMed] [Google Scholar]
- 24.McIntyre CC, Thakor NV. Uncovering the mechanisms of deep brain stimulation for Parkinson’s disease through functional imaging, neural recording, and neural modeling. Crit Rev Biomed Eng. 2002;30:249–281. doi: 10.1615/critrevbiomedeng.v30.i456.20. [DOI] [PubMed] [Google Scholar]
- 25.Obeso JA. Deep-brain stimulation of the subthalamic nucleus or the pars interna of the globus pallidus in Parkinson’s disease. N Engl J Med. 2001;345:956–963. doi: 10.1056/NEJMoa000827. [DOI] [PubMed] [Google Scholar]
- 26.Maurer C, Mergner T, Xie J, et al. Effect of chronic bilateral subthalamic nucleus (STN) stimulation on postural control in Parkinson’s disease. Brain. 2003;126:1146–1163. doi: 10.1093/brain/awg100. [DOI] [PubMed] [Google Scholar]
- 27.Rocchi L, Chiari L, Horak FB. Effects of deep brain stimulation and levodopa on postural sway in Parkinson’s disease. J Neurol Neurosurg Psychiatry. 2002;73:267–274. doi: 10.1136/jnnp.73.3.267. [DOI] [PMC free article] [PubMed] [Google Scholar]
- 28.Rocchi L, Chiari L, Cappello A, et al. Comparison between subthalamic nucleus and globus pallidus internus stimulation for postural performance in Parkinson’s disease. Gait Posture. 2004;19:172–183. doi: 10.1016/S0966-6362(03)00059-6. [DOI] [PubMed] [Google Scholar]
- 29.Vaillancourt DE, Mayka MA, Thulborn KR, Corcos DM. Subthalamic nucleus and internal globus pallidus scale with the rate of change of force production in humans. Neuroimage. 2004;23:175–186. doi: 10.1016/j.neuroimage.2004.04.040. [DOI] [PubMed] [Google Scholar]
- 30.Hashimoto T, Elder CM, Okun MS, et al. Stimulation of the subthalamic nucleus changes the firing pattern of pallidal neurons. J Neurosci. 2003;23:1916–1923. doi: 10.1523/JNEUROSCI.23-05-01916.2003. [DOI] [PMC free article] [PubMed] [Google Scholar]