Abstract
The fragmentation characteristics of monohydroxyeicosatetraenoic acids and dihydroxy- and trihydroxyeicosatrienoic acids were investigated by electrospray ionization - Fourier transform ion cyclotron resonance (FTICR) mass spectrometry using sustained off-resonance irradiation collision-induced dissociation (SORI-CID) and infrared multiphoton dissociation (IRMPD). The fragmentation patterns of these compounds were associated with the number and positions of the hydroxyl substituents. The fragmentation is more complicated with increasing number of the hydroxyl groups of the compounds. In general, the major carbon-carbon cleavage of [M-H]− ions occurred at the α-position to the hydroxyl group, and the carbon-carbon cleavage occurred when there was a double bond at the β-position to the hydroxyl group. SORI-CID and IRMPD produced some common fragmentation patterns; however, each technique provided some unique patterns that are useful for structural identification of these compounds. This study demonstrated the application of FTICR via the identification of regioisomers of trihydroxyeicosatrienoic acids in rabbit aorta samples.
Introduction
Mass spectrometry has emerged as an important tool for analysis of biomolecules. Fourier transform ion cyclotron resonance (FTICR) mass spectrometry is one of the techniques that can provide high mass accuracy and high mass resolution [1–6]. Accurate molecular weight, elemental composition, and structural information can be achieved from FTICR. Sustained off-resonance irradiation collision-induced dissociation (SORI-CID) and infrared multiphoton dissociation (IRMPD) are two different dissociation techniques often used with FTICR for MS/MS analysis. SORI-CID involves collision of the target ion slightly off its resonance frequency with a collision gas, causing the acceleration and deceleration of ions during the RF pulse. At a frequency of several kilohertz, multiple low-energy collisions occur as ions are vibrationally excited for a sustained period. Unlike SORI-CID, no collision gas is required for IRMPD. Instead, the 75 W CO2 laser is used to irradiate the ions to form fragments. The fragments may continue to acquire some energy from the infrared laser pulse and further fragment to ions of lower masses. This study demonstrates the utility of SORI-CID and IRMPD for the structural characterization of monohydroxyeicosatetraenoic acids (HETEs) and dihydroxy- and trihydroxyeicosatrienoic acids (DHETs and THETAs).
HETEs, DHETs and THETAs are metabolites of arachidonic acid (AA). Different isoforms of lipoxygenases (LOX) metabolize AA to regioisomeric HETEs. 12-Hydroxy-5,8,10,14-eicosatetraenoic acid (12-HETE) and 15-HETE are important lipid mediators in inflammation, kidney, immune system, prostate diseases, and diabetes [7–14]. Cytochrome P450 epoxygenases metabolize AA to 4 regioisomeric epoxyeicosatrienoic acids (EETs), and soluble epoxide hydrolase (sEH) enzymes subsequently convert EETs to the corresponding DHETs [15–17]. EETs have various biological functions, including inhibiting the hydroosmotic action of arginine vasopressin in the kidney, calcium mobilization and prostaglandin formation [18,19]. EETs stimulate relaxation in coronary rings and coronary arterioles [20–25]. A recent study showed that 14,15-DHET is a potent peroxisome proliferator-activated receptor-α(PPARα) activator in COS-7 cells [26].
THETAs are new members of the family of endothelium-derived relaxing factors [27–31]. 11,12,15-THETA and 11,14,15-THETA were identified as endothelium-derived lipoxygenase metabolites of AA in the rabbit aorta. Recent studies have shown that THETAs relax rabbit small mesenteric arteries [31]. 11,12,15-THETA mediates acetylcholine-induced relaxations by activating apamin-sensitive potassium (K+) channels in vascular smooth muscle to induce K+ efflux, membrane hyperpolarization, and vascular relaxation [27,28], while 11,14,15-THETA is not vasoactive [28,29]. These studies cogently indicate that biological function is dependent upon the position of the hydroxyl groups.
Previous studies showed that HETEs and DHETs form characteristic fragments during MS2 analysis by ion trap and triple quadrupole mass spectrometers [32–40]. The mechanisms for electrospray ionization and tandem mass spectrometry of various classes of eicosanoids have been elegantly reviewed [41]. In this study, we investigated the mass spectrometric characteristics of HETEs, DHETs and THETAs by ESI-FTICR using SORI-CID and IRMPD. The effects of the number and the positions of the hydroxyl substituents on fragmentation patterns were characterized, and the identities of THETAs in biological samples were determined.
Methods
Materials
11-, 12-, and 15-HETE; 11,12- and 14,15-DHET; 14,15-EET and arachidonoyl dopamine were purchased from Cayman Chemical Co. (Ann Arbor, MI). 11,12,15-, 11,14,15- and 13,14,15-THETA were synthesized in the laboratory of Dr. J.R. Falck [42]. Indomethacin, A23187 and L-ascorbic acid were purchased from Sigma (St. Louis, Mo). C18 Bond Elut solid-phase extraction (SPE) columns were purchased from Varian (Harbor City, CA). Acetonitrile was HPLC grade. Distilled, deionized water was used in all experiments.
Biological sample preparation
(1) Tissue preparation and incubation
Aortas were isolated from 1–2 week-old New Zealand White rabbits (Kuiper Rabbit Ranch, IN), placed in ice-cold HEPES buffer (in mM; 10 HEPES, 150 NaCl, 5 KCl, 2 CaCl2, 1 MgCl2, and 6 glucose; pH 7.4), cleaned of adhering connective tissue and fat and cut into rings (5-mm long). Aortic rings were incubated for 10 min at 37°C in HEPES buffer containing indomethacin (10−5 M). AA (10−4 M) was added, and the vessels were incubated for an additional 5 min. Calcium ionophore A23187 (2 × 10⁻⁵ M) was added, and the vessels were incubated for another 15 min. The reaction was stopped by the addition of ethanol to a final concentration of 15%. The incubation buffer was removed, acidified (pH < 3.5) with glacial acetic acid, and extracted on Bond Elut C-18 extraction columns as previously described [27–29]. The extracts were evaporated to dryness under a stream of N2 and stored at −40°C until further HPLC separation.
(2) Separation of AA metabolites by HPLC
The extracted samples were first separated into fractions of metabolite groups by reverse-phase HPLC (Nucleosil-C18 column, 5 μm, 4.6 × 250 mm) using water:acetonitrile mobile phase containing 0.1 % glacial acetic acid. The program was a 40-min linear gradient from 50% acetonitrile in water to 100% acetonitrile [28]. The fractions (0.2 mL per fraction) corresponding to the THETAs (fractions 27–35; 5–7.5 min) were collected and extracted with 50:50 cyclohexane:ethyl acetate. The extract was dried under a stream of N2 and redissolved in the HPLC mobile phase. The THETA fraction was rechromatographed on reverse-phase HPLC using water: acetonitrile (containing 0.1 % glacial acetic acid) mobile phase. The program consisted of a 5-min isocratic phase with 35% acetonitrile in water, followed by a 35-min linear gradient to 85% acetonitrile [28]. The fractions that contained the THETAs (fractions 87–93; 17.5–18.5 min) were collected, acidified with acetic acid, and extracted with a 50:50 cyclohexane:ethyl acetate. The samples were dried under a stream of N2 and analyzed by LC-FTICR.
Fourier transform ion cyclotron resonance mass spectrometry
For the standards, the experiments were performed on a 7.0 Tesla FTICR (IonSpec, Lake Forest, CA) with a Z-spray ESI source (Waters Corporation, Milford, MA) and a Model ‘22’ syringe pump (Harvard, Holliston, MA) or a high performance liquid chromatograph (HPLC, Agilent 1100 series, Palo Alto, CA). Standards were diluted in 50% acetonitrile:water solution. The standards were either directly infused by the syringe pump at a rate of 3 μL/min or introduced by flow injection (1 μL) through HPLC (Agilent 1100 series, Palo Alto, CA) into the electrospray source. FTICR were externally calibrated using 14,15-EET, L-ascorbic acid and arachidonoyl dopamine. Although FTICR can detect HETEs and DHETs at 5 pg and THETAs at 15 pg, the MS/MS spectra were measured with HETEs and DHETs at 100 pg and THETAs at 500 pg. These concentrations were used to assure that the low abundant ions have adequate signals and they were accurately measured. Mass spectra were acquired in negative mode with ESI probe and source temperature of 80 °C. The sample cone voltage was −45 V, the extractor cone was 10 V, Q1/Q2 RF was 70 V, and arbitrary waveform amplitude was 125 V. The probe high voltage was 3500 V. Transient signals were collected with 1024 K data points, an analog-to-digital converter (ADC) rate of 4 MHz, and the transient length of 65.5 ms. The detection range was set at m/z 54–500. Nitrogen was used as the collision gas and cooling gas. The precursor ions were isolated in the ICR cell and dissociated by SORI-CID or IRMPD. SORI-CID was initiated by opening a pulsed valve to admit a burst of collision gas with a length of 300 ms, offset frequency of 4563 Hz, amplitude of 15.5 V, and gas pulse of 15 ms. IRMPD was conducted with a 75 W continuous wave CO2 laser at 95% power pulse, length of 300 ms, and gas pulse of 5 ms. Omega (version 8.0.201) software was used to control the instrument and analyze the data.
LC-FTICR analysis of THETAs
LC-FTICR was performed with a 7.0 Tesla FTICR coupled to an Agilent 1100 series liquid chromatograph. Both THETA standards and THETA fractions were analyzed by LC-FTICR. The THETA standards were diluted in acetonitrile (1000 pg/μL), and the THETA sample fraction was dissolved in 50 μL of acetonitrile. All HPLC separations were performed at ambient temperature. The samples were analyzed on a reverse-phase C18 column (Kromasil 1.0 × 150 mm 5 μm, Varian) using water:acetonitrile containing 0.005% acetic acid as a mobile phase at a flow rate of 100 μL/min. The injection volume was 1 μL. The mobile phase gradient started at 20% acetonitrile in water, and linearly increased to 44% acetonitrile over 40 min, and then linear increased to 100% in 5 min. After 25 min of run time on the LC, the FTICR was turned on to acquire data. The FTICR conditions were the same as described above for the standards.
Results and Discussion
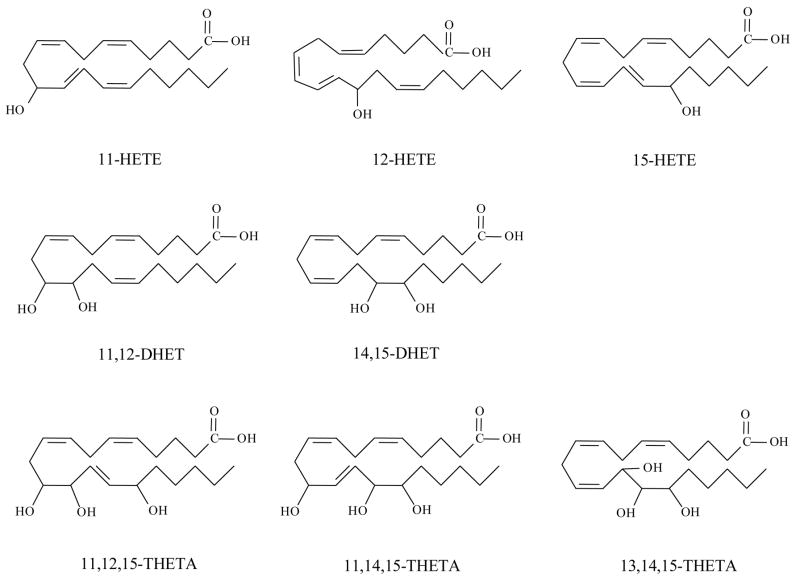
The structures of three HETEs, two DHETs and three THETAs are shown in Figure 1. Mass spectra of these eicosanoids exhibited carboxylate molecular ions [M-H]− with m/z 319 for HETEs, m/z 337 for DHETs, and m/z 353 for THETAs as the most abundant ions. For MS/MS experiments, the molecular ions were isolated, accelerated toward the ICR cell and dissociated. Some similar fragmentation patterns of HETEs, DHETs and THETAs were observed, indicating the common backbone structures among these compounds. However, there were unique fragmentations reflecting the structural characteristics that can be used to identify these compounds.
Figure 1.
Structures of HETEs (11-HETE, 12-HETE and 15-HETE), DHETs (11,12-DHET and 14,15-DHET) and THETAs (11,12,15-THETA, 11,14,15- THETA and 13,14,15- THETA).
Common fragmentation pathways for HETEs, DHETs and THETAs
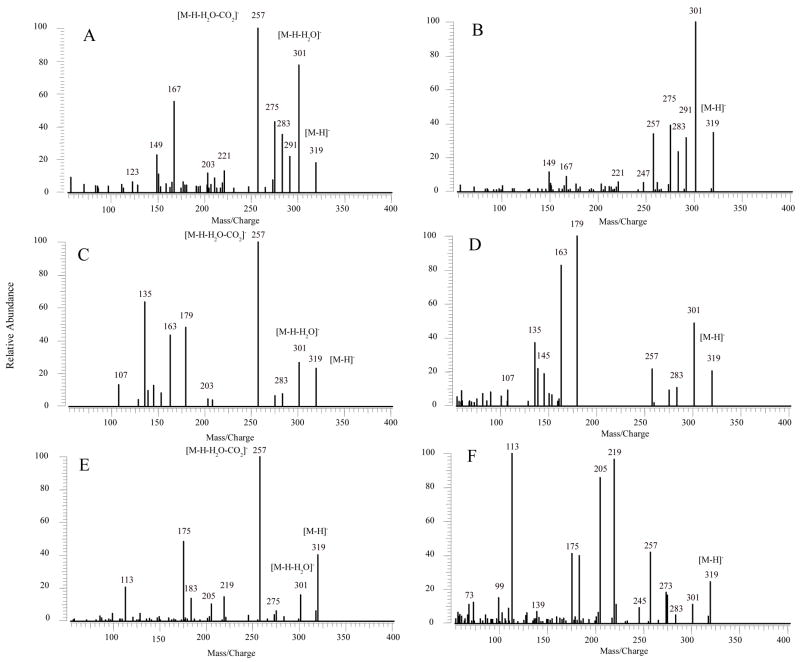
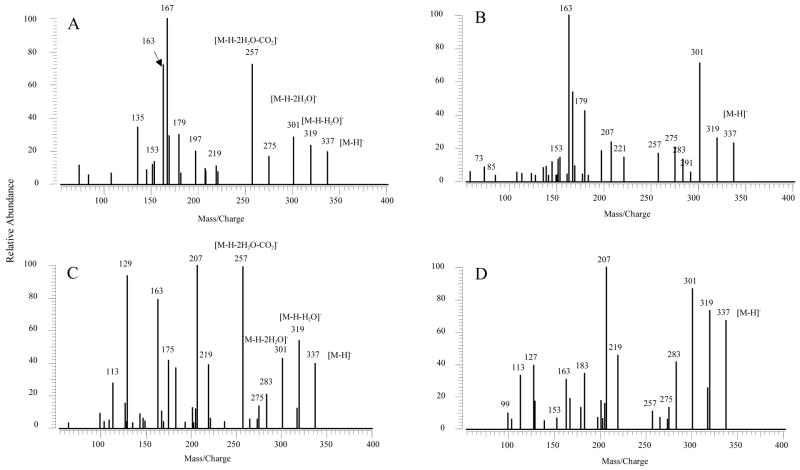
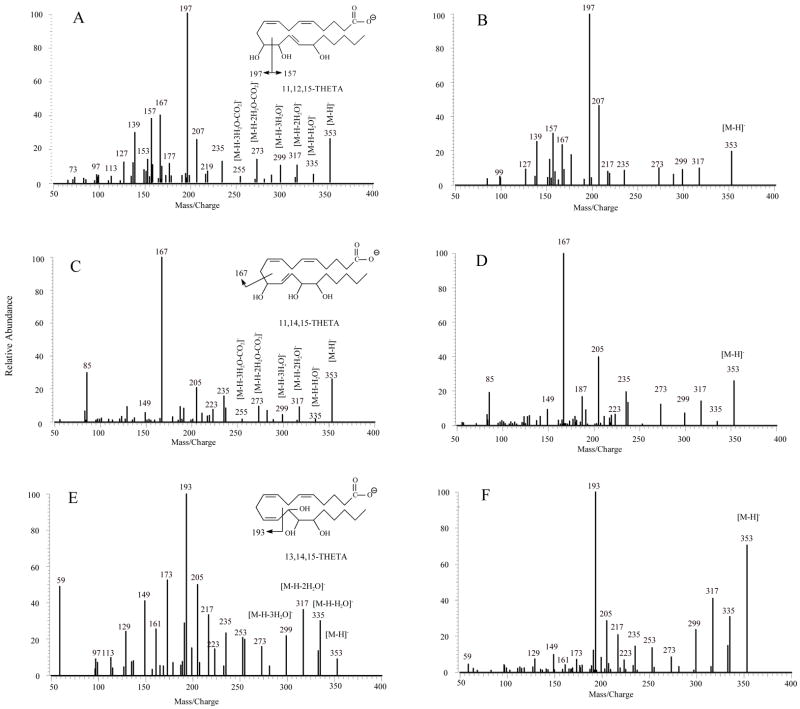
MS/MS spectra of all compounds indicated losses of H2O and CO2 to form a series of ions. For HETEs (Figure 2 and Table 1), which consist of one hydroxyl group, m/z 301 corresponding to [M-H-H2O]−, was observed in all SORI-CID and IRMPD spectra. The m/z 257 was formed by a loss of CO2 from [M-H-H2O]−. DHETs with two hydroxyl groups, as shown in Figure 3 and Table 2, the molecular ions (m/z 337) lost two H2O molecules one after another, to form m/z 319 and 301, assigned as [M-H-H2O]− and [M-H-2H2O]−, respectively. These ions could further lose CO2 to form [M-H-H2O-CO2]− (m/z 275) and [M-H-2H2O-CO2]− (m/z 257), respectively. The loss of H2O and CO2 are the major fragmentation pathways for HETEs and DHETs. In the SORI-CID and IRMPD spectra of m/z 353 of THETAs (Figure 4 and Tables 3–5), which have three hydroxyl groups, the [M-H]− ions easily lost one to three H2O molecules to give [M-H-H2O]− (m/z 335), [M-H-2H2O]− (m/z 317) and [M-H-3H2O]− (m/z 299). After the losses of 2 or 3 H2O, [M-H-2H2O]− and [M-H-3H2O]− could further dissociate to form [M-H-2H2O-CO2]− (m/z 273) and [M-H-3H2O-CO2]− (m/z 255), respectively.
Figure 2.
MS/MS spectra of [M-H]−, m/z 319 for HETEs (100 pg) obtained from negative ion ESI SORI-CID and IRMPD FTICR. (A) MS/MS spectrum of 11-HETE by SORI-CID; (B) MS/MS spectrum of 11-HETE by IRMPD; (C) MS/MS spectrum of 12-HETE by SORI-CID; (D) MS/MS spectrum of 12-HETE by IRMPD; (E) MS/MS spectrum of 15-HETE by SORI-CID; (F) MS/MS spectrum of 15-HETE by IRMPD.
Table 1.
High-resolution accurate mass measurements by SORI-CID FTICR for HETEs.
| Measured Ions (m/z) | Calculated Ions (m/z) | Error (ppm) | Relative Abundance (%) | Elemental Composition |
|---|---|---|---|---|
| 11-HETE | ||||
| 319.22872 | 319.22787 | 2.7 | 17.83 | C20H31O3−1 |
| 301.21788 | 301.21730 | 1.9 | 77.16 | C20H29O2−1 |
| 275.23886 | 275.23804 | 3.0 | 42.94 | C19H31O−1 |
| 257.22796 | 257.22747 | 1.9 | 100.00 | C19H29−1 |
| 207.17625 | 207.17544 | 3.9 | 4.95 | C14H23O−1 |
| 167.10801 | 167.10775 | 1.6 | 52.71 | C10H15O2−1 |
| 149.09752 | 149.09719 | 2.2 | 22.75 | C10H13O−1 |
| 123.11851 | 123.11792 | 4.8 | 6.43 | C9H15−1 |
| 12-HETE | ||||
| 319.22722 | 319.22787 | −2.0 | 23.16 | C20H31O3−1 |
| 301.21653 | 301.21730 | −2.6 | 26.61 | C20H29O2−1 |
| 257.22674 | 257.22747 | −2.8 | 100.00 | C19H29−1 |
| 179.10724 | 179.10775 | −2.8 | 48.37 | C11H15O2−1 |
| 163.11239 | 163.11284 | −2.8 | 43.48 | C11H15O−1 |
| 135.11756 | 135.11792 | −2.7 | 63.85 | C10H15−1 |
| 15-HETE | ||||
| 319.22738 | 319.22787 | −1.5 | 42.76 | C20H31O3−1 |
| 301.21563 | 301.21730 | −5.5 | 17.34 | C20H29O2−1 |
| 257.22673 | 257.22747 | −2.9 | 100.00 | C19H29−1 |
| 219.13863 | 219.13905 | −1.9 | 15.96 | C14H19O2−1 |
| 175.14887 | 175.14922 | −2.0 | 48.96 | C13H19−1 |
| 113.09705 | 113.09719 | −1.2 | 20.82 | C7H13O−1 |
Figure 3.
MS/MS spectra of [M-H]−, m/z 337 for DHETs obtained from negative ion ESI SORI-CID and IRMPD FTICR. (A) MS/MS spectrum of 11,12-DHET by SORI-CID; (B) MS/MS spectrum of 11,12-DHET by IRMPD; (C) MS/MS spectrum of 14,15-DHET by SORI-CID; (D) MS/MS spectrum of 14,15-DHET by IRMPD.
Table 2.
High-resolution accurate mass measurements by SORI-CID FTICR for DHETs.
| Measured Ions (m/z) | Calculated Ions (m/z) | Error (ppm) | Relative Abundance (%) | Elemental Composition |
|---|---|---|---|---|
| 11,12-DHET | ||||
| 337.23729 | 337.23843 | −3.4 | 20.04 | C20H33O4−1 |
| 319.22748 | 319.22787 | −1.2 | 22.90 | C20H31O3−1 |
| 301.21718 | 301.21730 | −0.4 | 27.63 | C20H29O2−1 |
| 275.23789 | 275.23804 | −0.5 | 15.95 | C19H31O−1 |
| 257.22634 | 257.22747 | −4.4 | 70.41 | C19H29−1 |
| 207.17419 | 207.17544 | −6.0 | 9.09 | C14H23O−1 |
| 197.11742 | 197.11832 | −4.6 | 19.08 | C11H17O3−1 |
| 179.10725 | 179.10775 | −2.8 | 30.77 | C11H15O2−1 |
| 169.12278 | 169.12340 | −3.7 | 28.75 | C10H17O2−1 |
| 167.10714 | 167.10775 | −3.7 | 100.00 | C10H15O2−1 |
| 163.11235 | 163.11284 | −3.0 | 75.87 | C11H15O−1 |
| 135.11769 | 135.11792 | −1.7 | 36.80 | C10H15−1 |
| 14,15-DHET | ||||
| 337.23868 | 337.23843 | 0.7 | 38.89 | C20H33O4−1 |
| 319.22762 | 319.22787 | −0.8 | 54.05 | C20H31O3−1 |
| 301.21849 | 301.21730 | 4.0 | 42.51 | C20H29O2−1 |
| 275.23750 | 275.23804 | −2.0 | 19.18 | C19H31O−1 |
| 257.22729 | 257.22747 | −0.7 | 98.43 | C19H29−1 |
| 219.13885 | 219.13905 | −0.9 | 38.19 | C14H19O2−1 |
| 207.13931 | 207.13905 | 1.3 | 100.00 | C13H19O2−1 |
| 175.14975 | 175.14922 | 3.0 | 40.49 | C13H19−1 |
| 167.10810 | 167.10775 | 2.1 | 8.12 | C10H15O2−1 |
| 163.14947 | 163.14922 | 1.5 | 76.78 | C12H19−1 |
| 129.09250 | 129.09210 | 3.1 | 92.71 | C7H13O2−1 |
Figure 4.
MS/MS spectra of [M-H]−, m/z 353 for THETAs obtained from negative ion ESI SORI-CID and IRMPD FTICR. (A) MS/MS spectrum of 11,12,15-THETA by SORI-CID; (B) MS/MS spectrum of 11,12,15-THETA by IRMPD; (C) MS/MS spectrum of 11,14,15-THETA by SORI-CID; (D) MS/MS spectrum of 11,14,15-THETA by IRMPD; (E) MS/MS spectrum of 13,14,15-THETA by SORI-CID; (F) MS/MS spectrum of 13,14,15-THETA by IRMPD.
Table 3.
High-resolution accurate mass measurements by SORI-CID FTICR for 11,12,15-THETA.
| Measured Ions (m/z) | Calculated Ions (m/z) | Error (ppm) | Relative Abundance (%) | Elemental Composition |
|---|---|---|---|---|
| 353.23453 | 353.23335 | 3.3 | 25.57 | C20H33O5−1 |
| 335.22580 | 335.22278 | 8.9 | 4.53 | C20H31O4−1 |
| 317.21342 | 317.21222 | 3.8 | 10.20 | C20H29O3−1 |
| 299.20257 | 299.20165 | 3.1 | 9.90 | C20H27O2−1 |
| 273.22319 | 273.22239 | 2.9 | 13.59 | C19H29O −1 |
| 255.21169 | 255.21182 | −0.5 | 3.26 | C19H27−1 |
| 235.13449 | 235.13397 | 2.2 | 12.17 | C14H19O3−1 |
| 207.13941 | 207.13905 | 1.7 | 25.31 | C13H19O2−1 |
| 197.11865 | 197.11832 | 1.7 | 100.00 | C11H17O3−1 |
| 167.10802 | 167.10775 | 1.6 | 39.96 | C10H15O2−1 |
| 157.12358 | 157.12340 | 1.1 | 38.32 | C9H17O2−1 |
| 153.12883 | 153.12849 | 2.2 | 14.43 | C10H17O −1 |
| 139.11300 | 139.11284 | 1.2 | 30.20 | C9H15O −1 |
Table 5.
High-resolution accurate mass measurements by SORI-CID FTICR for 13,14,15-THETA.
| Measured Ions (m/z) | Calculated Ions (m/z) | Error (ppm) | Relative Abundance (%) | Elemental Composition |
|---|---|---|---|---|
| 353.23454 | 353.23335 | 3.4 | 9.16 | C20H33O5−1 |
| 335.22447 | 335.22278 | 5.0 | 29.95 | C20H31O4−1 |
| 317.21399 | 317.21222 | 5.6 | 36.52 | C20H29O3−1 |
| 299.20348 | 299.20165 | 6.1 | 21.78 | C20H27O2−1 |
| 273.22435 | 273.22239 | 7.2 | 15.69 | C19H29O −1 |
| 255.21344 | 255.21182 | 6.3 | 20.02 | C19H27−1 |
| 253.14608 | 253.14453 | 6.1 | 20.85 | C14H21O4−1 |
| 235.13524 | 235.13397 | 5.4 | 23.23 | C14H19O3−1 |
| 223.13486 | 223.13397 | 4.0 | 14.73 | C13H19O3−1 |
| 217.12449 | 217.12340 | 5.0 | 33.61 | C14H17O2−1 |
| 205.12447 | 205.12340 | 5.2 | 50.50 | C13H17O2−1 |
| 193.12430 | 193.12340 | 4.7 | 100.00 | C12H17O2−1 |
| 173.13440 | 173.13357 | 4.8 | 52.43 | C13H17−1 |
| 161.13442 | 161.13357 | 5.3 | 25.51 | C12H17−1 |
| 149.13423 | 149.13357 | 4.4 | 41.29 | C11H17−1 |
| 129.09271 | 129.09210 | 4.7 | 24.04 | C7H13O2−1 |
| 59.01395 | 59.01385 | 1.7 | 49.36 | C2H3O2−1 |
Compared with HETEs and DHETs, the relative intensities of these ions (loss of H2O and CO2) in THETAs were lower than in HETEs and DHETs. The results suggest that the carbon-carbon bond ruptures became the major fragments of THETAs. In comparison of three THETAs, the relative intensities of ions corresponding to the losses of H2O and CO2 for 13,14,15-THETA were slightly higher than for 11,14,15- and 11,12,15-THETA, suggesting that the positions of hydroxyl groups affected the losses of H2O and CO2 from the molecular ions. When three hydroxyl groups were adjacent, as with 13,14,15-THETA, it was easier to lose H2O or CO2.
Unique fragmentation pathways for HETEs, DHETs and THETAs
Besides the similarities of fragmentation, there were significant differences in fragmentations among HETEs, DHETs and THETAs obtained from SORI-CID and IRMPD that indicated the characteristics of the molecular structures.
(a) MS/MS characteristics of HETEs by SORI-CID and IRMPD
(1) SORI-CID of HETEs
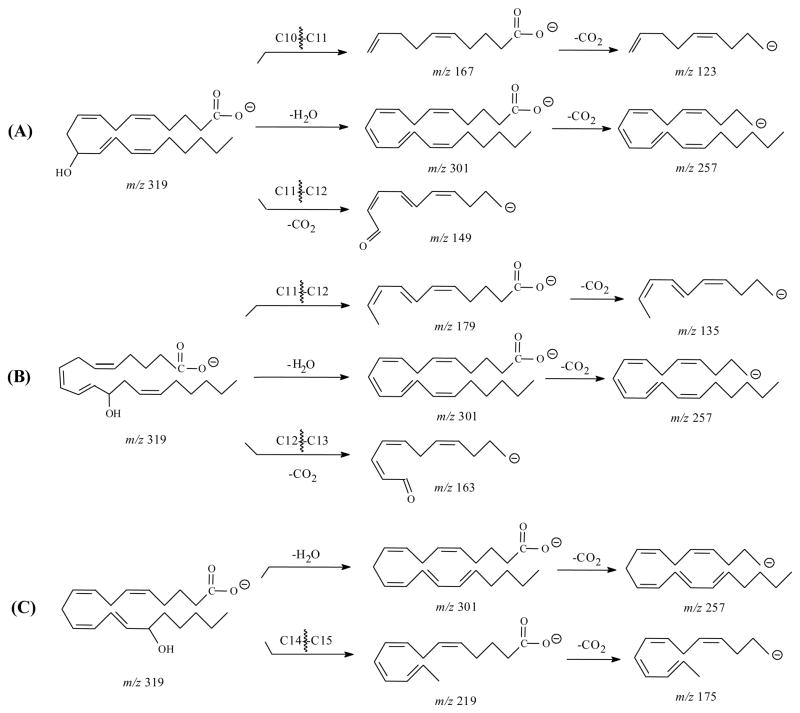
Figure 2A, C, and E show the MS/MS spectra obtained from SORI-CID FTICR for 11-, 12-, and 15-HETE, respectively. In the SORI-CID spectrum of [M-H]− for 11-HETE, the major characteristic product ions were m/z 167 and 149. The characteristic m/z 167 is similar to that reported fragmentation by triple quadrupole and ion trap mass spectrometers [33,39,41]. The MS/MS spectra for 11-HETE by a triple quadrupole mass spectrometer had the dominant ion of m/z 167 [33] while spectra from FTICR and ion trap [39] contained other characteristic ions. The mechanism for formation of m/z 167 was previously described [41] as the charge-remote formation of the aldehyde by proton transfer and the cleavage of the C10–C11 bond. Another characteristic ion of the m/z 149 was observed and proposed as a cleavage of the C11–C12 bond and a loss of CO2. Another particular ion with high intensity was observed at m/z 275. It was formed by a direct loss of CO2 from the [M-H]− ion. The losses of CO2 and H2O by [M-H]− ion formed the highest abundant m/z 257, although these two ions were not detected in the previous studies [33,41] (Scheme 1A).
Scheme 1.
Proposed major fragmentation pathways of 11-, 12- and 15-HETE by negative ion ESI-FTICR. (A) 11-HETE; (B) 12-HETE; (C) 15-HETE.
For 12-HETE, the major characteristic ions were m/z 179, 163 and 135 and were similar to the results from the ion trap mass spectrometer [39]. Again, the m/z 257 is the highest abundant ion. The mechanism for the m/z 179 formation was previously described [41]. We proposed that the negative charge was located at the carboxylate because the presence of the m/z 135 ion, corresponding to a loss of CO2 from the m/z 179. The m/z 163 was presumably the result of carbon-carbon bond cleavage from C12–C13 and loss of CO2 (Scheme 1B).
The characteristic product ions of 15-HETE were m/z 219, 175 and 113 and were similar to previous studies [33,39]. The m/z 219 was the product ion formed by the identical mechanism as previously described for the m/z 179 of 12-HETE [41]. The m/z 175 was the subsequent loss of CO2 from the m/z 219 (Scheme 1C). The elemental composition of the m/z 113 indicated the fragment of C7H13O-1, suggesting the double bond conjugation and cleavage of C13–C14 bond. The abundance of this ion increased in IRMPD (see below).
(2) IRMPD of HETEs
The major product ions generated from IRMPD were similar to those generated from SORI-CID, but the relative intensities of these ions were different. In IRMPD spectra of [M-H]− for all three HETEs (Figure 2B, D and F), the relative intensity of m/z 257 decreased, while this ion was the highest abundant ion in SORI-CID spectra of HETEs. It indicated that the loss of CO2 from the [M-H-H2O]− ion for HETEs became less effective with IRMPD. For 12-HETE (Figure 2D), m/z 179 was the most abundant ion, indicating that the break of C11–C12 bond was the major pathway [41]. For 15-HETE (Figure 2F), m/z 219 and 113 became the major ions. The m/z 219 was formed by the break of C14–C15 bond and the charge was located on the carboxyl group. The formation of m/z 113 was the result of double bond conjugation and the rupture of C13–C14 bond as in SORI-CID.
(b) MS/MS characteristics of DHETs by SORI-CID and IRMPD
(1) SORI-CID of DHETs
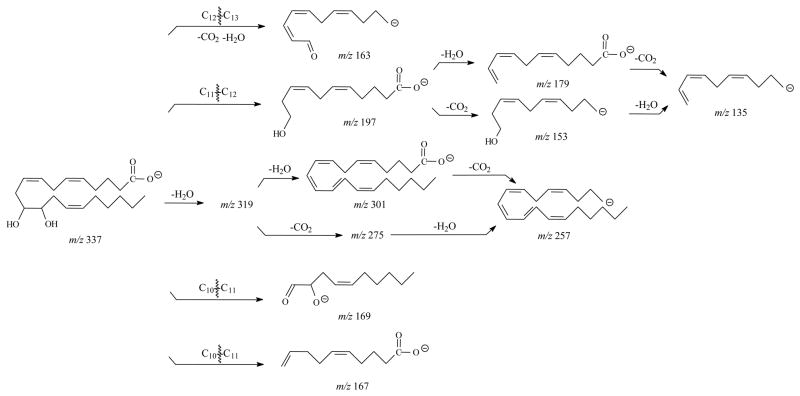
In the SORI-CID spectrum of [M-H]−, m/z 337, for 11,12-DHET is shown in Figure 3A and the ions are shown in Table 2. The prominent m/z 167, 163, 135, 179, 197, 153 and 169 were observed and were similar to the results from ion trap mass spectrometer [40]. Formation of the highest abundant m/z 167 was similar to 11-HETE [41]. If the charge was relocated on the hydroxyl oxygen at C12, the m/z 169 could be formed by the same fragmentation mechanism. The m/z 197 was a result of the cleavage of C11–C12 bond [41]. Both m/z 179 and 153 corresponded to a loss of H2O and CO2 from the m/z 197, respectively. The m/z 135 was formed by a loss of CO2 from the m/z 179 or a loss of H2O from the m/z 153, respectively. The m/z 163 was derived from the cleavage of C12–C13 and the losses of H2O and CO2. The major fragmentation pathways of 11,12-DHET were proposed in Scheme 2.
Scheme 2.
Proposed major fragmentation pathways of 11,12-DHET by negative ion ESI FTICR.
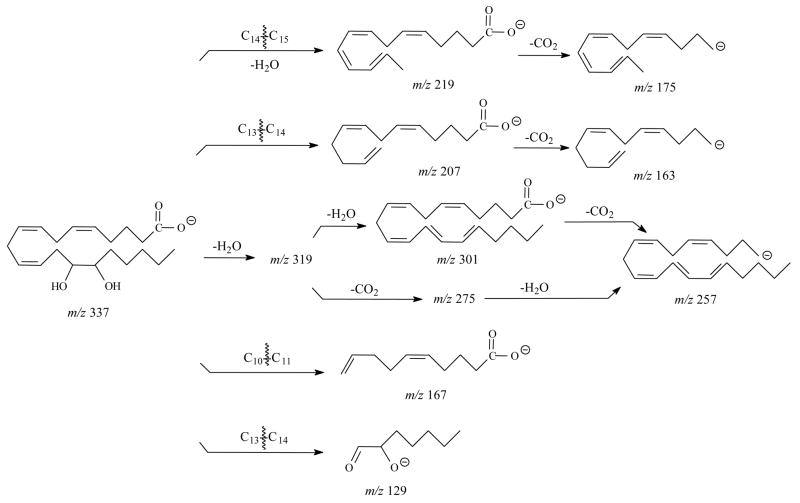
The CID spectrum of [M-H]−, m/z 337, for 14,15-DHET had several characteristic ions (Table 2) that were similar to the results from the ion trap mass spectrometer [39] with the most abundant fragments of m/z 207 and 257 (Figure 3C). The m/z 257 was the result of the loss of 2H2O and CO2 from the [M-H]− ion. The m/z 207 was derived from the cleavage of the C13–C14 bond as previously described [39,41]. In addition to m/z 207, other major ions were observed at m/z 129, 163, 175, and 219. The m/z 163 was from a loss of CO2 from the m/z 207. If the charge was relocated on the hydroxyl oxygen at C15, m/z 129 can be formed at high abundance by the same dissociation as m/z 207. The m/z 219 resulted from a loss of H2O and the charge-driven cleavage of the C14–C15 bond from the molecular ion as described for 15-HETE above. The subsequent loss of CO2 by m/z 219 formed m/z 175 with high abundance. Some other low abundant ions were also observed in the spectra, such as m/z 127 derived from cleavage at the C7–C8 bond, m/z 167 derived from the cleavage at the C10–C11 bond. Scheme 3 illustrates the proposed dissociation reactions of 14,15-DHET.
Scheme 3.
Proposed major fragmentation pathways of 14,15-DHET by negative ion ESI FTICR.
(2) IRMPD of DHETs
The IRMPD spectra of [M-H]− for DHETs were similar to those formed by SORI-CID, indicating the same major fragmentation patterns. In the IRMPD spectra of [M-H]−for 11,12- and 14,15-DHETs (Figure 3B and D), the intensity of m/z 257 also decreased similar to HETEs as described above. The intensities of m/z 319 and 301, which were the results of the loss of one and two H2O from the molecular ions, became higher, indicating easy losses of H2O to produce [M-H-H2O]− and [M-H-2H2O]−. Interestingly, the m/z 163 instead of m/z 167 was observed as the high abundant ion for 11,12-DHET (Figure 3B) similar to 12-HETE. The results suggested that 11,12-DHET possibly lost H2O at the C11 position and fragmented with the mechanism similar to 12-HETE. More low abundant ions were observed in the low m/z range of the IRMPD spectrum of 11,12-DHET, such as m/z 58, 123, 113, 177, and 139, indicating further fragmentation from excessive energy. For 14,15-DHET, the intensities of m/z 175, 163, and 129 became lower in the IRMPD spectrum with the m/z 207 as the highest abundance ion (Figure 3D). This suggested the dominant C13–C14 cleavage.
In general, the major product ions in the CID spectra of HETEs and DHETs obtained from FTICR were similar to ions obtained from ion trap and triple quadrupole mass spectrometers [34–41]. However, more intense and more characteristic fragmentation ions were obtained from FTICR similar to ion trap than triple quadrupole mass spectrometry. Losses of H2O and CO2 to form characteristic ions are more favorable in FTICR. Furthermore, the structures of these fragments can be ascertained based on the corresponding high-resolution and accurate mass data from FTICR. For example, the m/z 163 for 12-HETE and 11,12-DHET has the masses of 163.11239 and 163.11235, respectively. This ion has the elemental composition of C11H15O-1 (Table 1 and 2). However, the m/z 163 for 14,15-DHET has the mass of 163.14947 with the elemental composition of C12H19-1 (Table 2). These results indicated that the fragmentation mechanisms of the m/z 163 for 11-HETE/11,12-DHET and 14,15-DHET are different as shown in Scheme 1, 2 and 3.
(c) MS/MS characteristics of THETAs by SORI-CID and IRMPD
(1) SORI-CID of THETAs
All THETAs exhibited identical [M-H]−, m/z 353. Figure 4A, C and E show the MS/MS spectra obtained from SORI-CID FTICR of 11,12,15-, 11,14,15-, and 13,14,15-THETA, respectively. Their high-resolution and accurate mass spectrometric data and corresponding predicted elemental composition of their fragments are shown in Table 3, 4 and 5, respectively. With three hydroxyl groups, the spectra of THETAs were more complex than spectra of HETEs and DHETs.
Table 4.
High-resolution accurate mass measurements by SORI-CID FTICR for 11,14,15-THETA.
| Measured Ions (m/z) | Calculated Ions (m/z) | Error (ppm) | Relative Abundance (%) | Elemental Composition |
|---|---|---|---|---|
| 353.23520 | 353.23335 | 5.2 | 26.34 | C20H33O5−1 |
| 335.22255 | 335.22278 | −0.7 | 1.71 | C20H31O4−1 |
| 317.21416 | 317.21222 | 6.1 | 9.01 | C20H29O3−1 |
| 299.20354 | 299.20165 | 6.3 | 4.44 | C20H27O2−1 |
| 273.22405 | 273.22239 | 6.1 | 9.48 | C19H29O −1 |
| 255.21371 | 255.21182 | 7.4 | 1.89 | C19H27−1 |
| 235.13527 | 235.13397 | 5.5 | 15.85 | C14H29O3−1 |
| 223.13530 | 223.13397 | 6.0 | 7.50 | C13H19O3−1 |
| 205.12465 | 205.12340 | 6.1 | 19.90 | C13H17O2−1 |
| 167.10833 | 167.10775 | 3.5 | 100.00 | C10H15O2−1 |
| 85.02952 | 85.02950 | 0.2 | 30.47 | C4H5O2−1 |
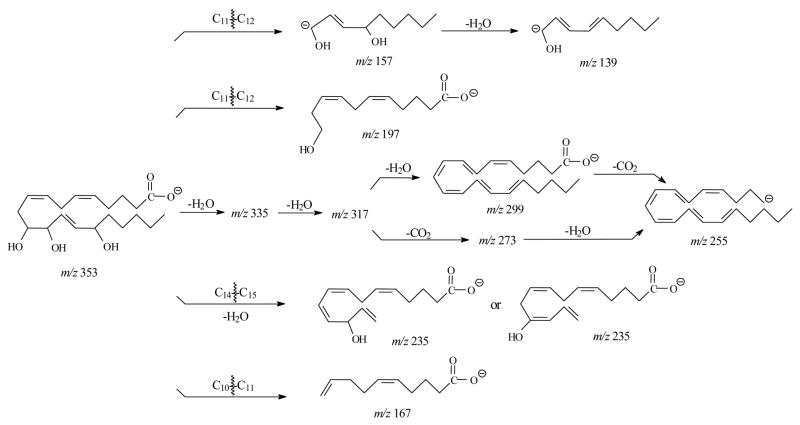
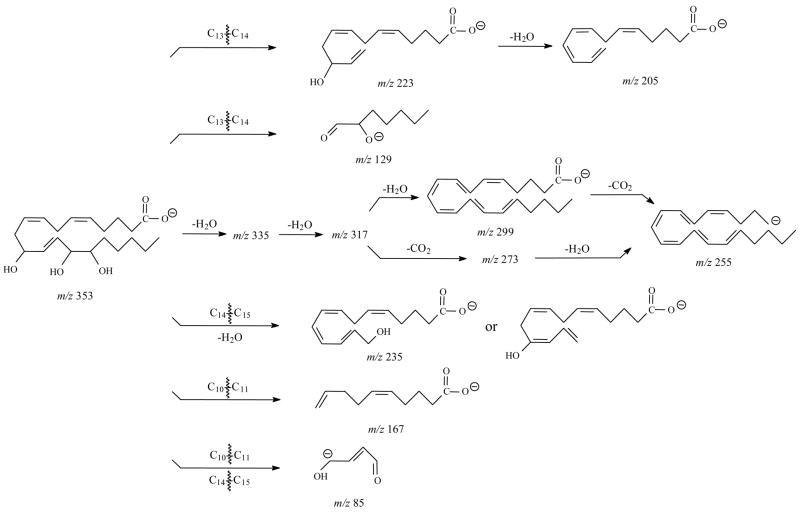
For 11,12,15-THETA, (Figure 4A and Table 3), the major ions were m/z 197, 167, 157, 139 and 127. The most abundant product ion was m/z 197. This ion was the result of the charge-driven cleavage of C11–C12 by the loss of neutral aldehyde from the enolate anion in which the charge was relocated on the hydroxyl oxygen at C12. If the charge was relocated on the hydroxyl oxygen at C11, the m/z 157 was formed by the similar fragmentation mechanism as shown in Scheme 7. The m/z 157 then lost H2O to form m/z 139. The mechanism for formation of m/z 167 was the same as the ion of 11-HETE [41]. If the charge was relocated on the hydroxyl oxygen at C-15, the m/z 235 was likely formed by the losses of H2O and hexyl aldehyde from the cleavage of C14–C15 bond. Scheme 4 illustrates the proposed fragmentation pathways for 11,12,15-THETA.
Scheme 7.
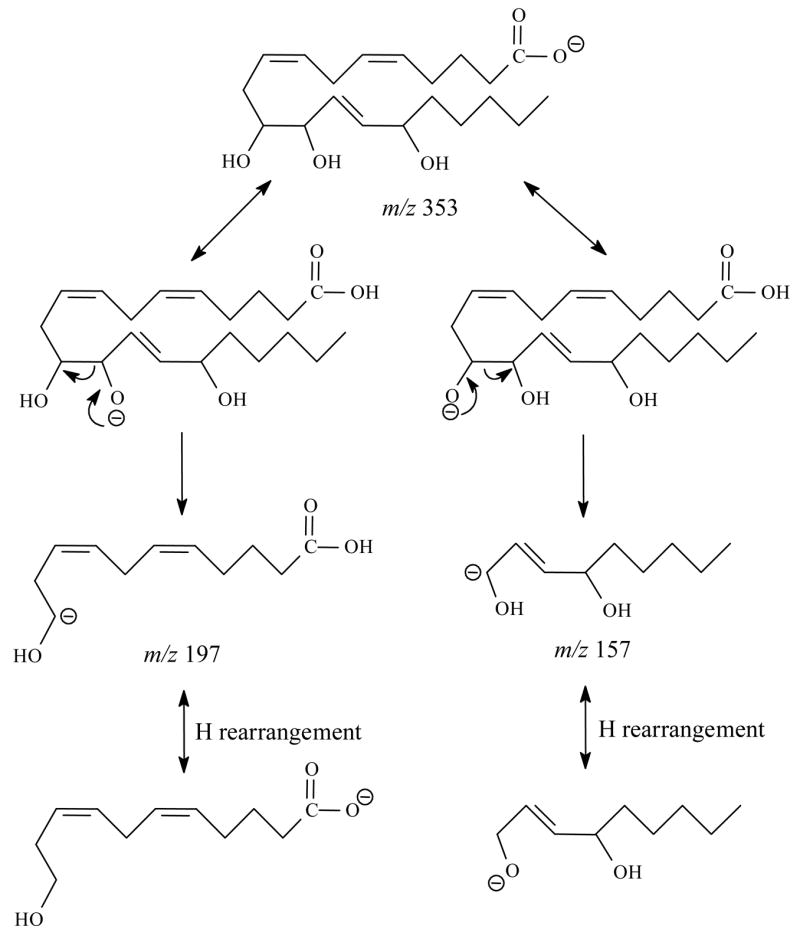
Proposed mechanism of formation of the m/z 197 and m/z 157 in the negative ion SORI-CID spectrum of [M-H]− for 11,12,15-THETA.
Scheme 4.
Proposed fragmentation pathways of 11,12,15-THETA by negative ion ESI FTICR.
The SORI-CID spectrum of [M-H]− for 11,14,15-THETA (Figure 4C and Table 4) was dominated by the m/z 167. The formation of the m/z 167 was the result of the double bond conjugation and then, the break of C10–C11 bond as previously described for 11-HETE [41]. In addition, the unique characteristic m/z 85 was observed for 11,14,15-THETA. The elemental composition of this ion was assigned as C4H5O2−1. The proposed mechanism for its formation was the cleavages of C10–C11 bond and C14–C15 bond. Besides the m/z 167 and 85, the m/z 129, 205, 223, and 235 were also observed for 11,14,15-THETA. The proposed fragmentation pathways for these ions were similar to DHETs as shown in Scheme 5.
Scheme 5.
Proposed fragmentation pathways of 11,14,15-THETA by negative ion ESI FTICR.
When 11,12,15- and 11,14,15-THETA were compared, 11,12,15-THETA needs more collisional energy to fragment than 11,14,15-THETA. The different positions of the second hydroxyl group and the third double bond in the structures of 11,12,15-THETA and 11,14,15-THETA resulted in a remarkable and diagnostically useful difference in their major fragmentation pathways. The m/z 197, 207, 157 and 139 were the characteristic product ions with m/z 197 as the highest abundant ion for 11,12,15-THETA. The m/z 167, 205 and 85 were the characteristic product ions with m/z 167 as the most abundant ion for 11,14,15-THETA.
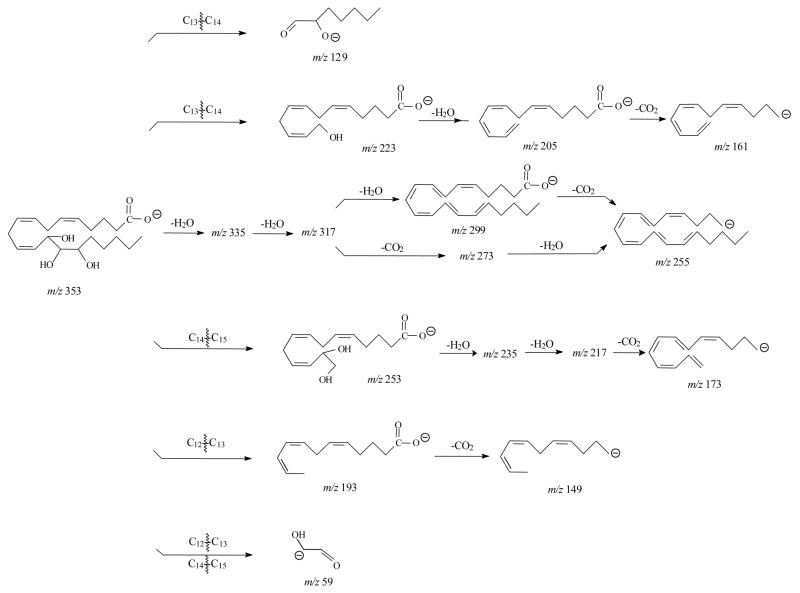
Figure 4E and Table 5 show the SORI CID spectrum and fragments of [M-H]− for 13,14,15-THETA. The m/z 193 was observed as the most abundant ion, which was proposed to form by the double bond conjugation and the break of C12 –C13 bond similar to the formation of m/z 179 for 12-HETE [41]. This ion then lost CO2 to form the m/z 149. Other product ions were m/z 253, 235, 223, 217, 205, 173, 161, and 129. If the charge was relocated at C15 oxygen group, the m/z 253 was formed by the charge-driven loss of neutral aldehyde from C14–C15 bond. The m/z 235, 217 and 173 were formed by the losses of H2O or CO2 from m/z 253. The m/z 223 and 129 were formed by breaking of the C13–C14 bond. The former ion lost H2O to form the m/z 205, and then lost CO2 to produce the m/z 161. The unique characteristic m/z 59 was observed for 13,14,15-THETA. The proposed formation of this ion was the cleavage of C12–C13 bond and C14–C15 bond similar to the m/z 85 for 11,14,15-THETA. The proposed fragmentation pathways for 13,14,15-THETA are shown in Scheme 6.
Scheme 6.
Proposed fragmentation pathway of 13,14,15-THETA by negative ion ESI FTICR.
(2) IRMPD of THETAs
Figure 4B, D and F show the product ion spectra obtained from IRMPD of 11,12,15-, 11,14,15-, and 13,14,15-THETA, respectively. The major product ions obtained from IRMPD were similar to SORI-CID, suggesting similar major fragmentation pathways of THETAs. However, there were some differences between SORI-CID and IRMPD spectra. For 11,14,15-THETA (Figure 4D), the intensities of the m/z 205 in the IRMPD spectrum increased two-fold, and the abundance of m/z 85 decreased, compared with SORI-CID. IRMPD favored the m/z 205 by the cleavage of neutral aldehyde from C13–14 bond and the subsequent loss of H2O. This may be due to the product ion obtaining more energy from the laser, and then fragmention to generate higher abundant m/z 205. For 11,12,15-THETA, the relative abundance of the m/z 207 increased with IRMPD. However, the abundance of the other product ions, such as m/z 157, 167, 177, 139 and 127, decreased. For 13,14,15-THETA, there were obvious differences between IRMPD and SORI-CID. The abundance of the m/z 59 and 173 decreased ten-fold in the IRMPD spectrum, and the other ions such as m/z 205, 149, 129, 217, 235 and 253 also decreased. These two techniques complemented each other, providing more useful structural information.
Identification of THETAs as arachidonic acid metabolites in rabbit aorta samples
The THETA fraction in rabbit aorta samples was analyzed by negative ion LC-FTICR to obtain structural information for identification of THETA isomers. The mass spectrum of the samples showed the most abundant ion of m/z 353 ([M-H]−). The molecular weight was determined as 354 Da with the elemental composition of C20H34O5.
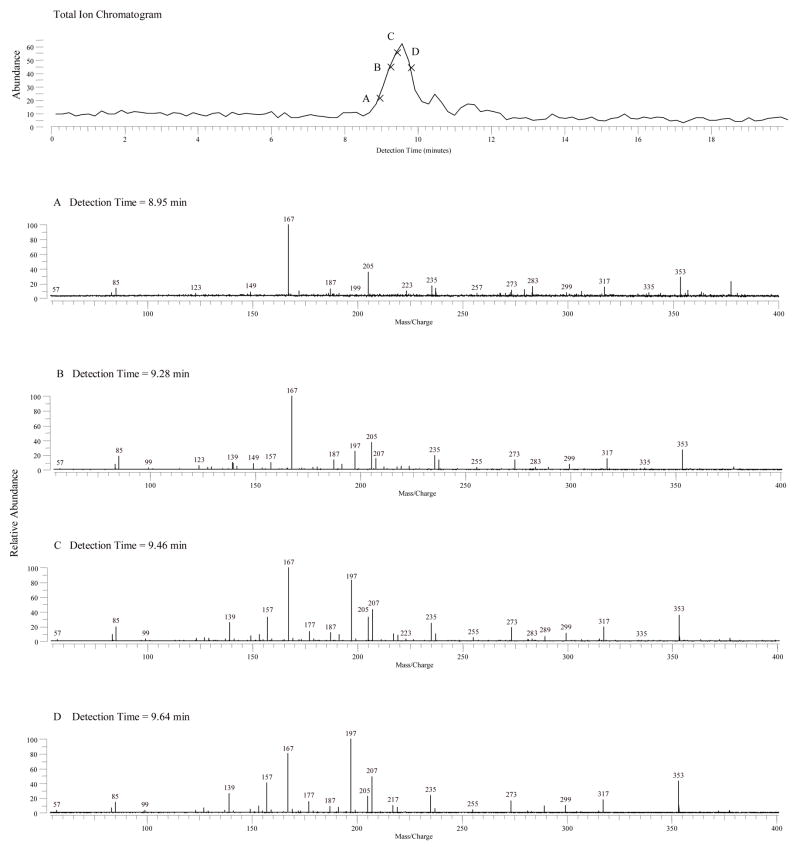
Figure 5 (top panel) shows the total ion chromatogram of the MS/MS of m/z 353 by IRMPD. Figure 5A, B, C and D show the product ions of m/z 353 obtained from different retention times by IRMPD. The m/z 335, 317, and 299 were observed, suggesting the subsequent losses of one to three H2O from [M-H]−. These ions indicated three OH groups were present in the structures. The low abundance of these ions also suggested that the positions of three OH groups were not adjacent. The changes in spectral patterns at different retention times (from A to D) suggested that the peak contained more than one compound. A complete separation of THETA regioisomers on a reverse phase LC column was not obtained.
Figure 5.
Total ion chromatogram (top panel) and product ion mass spectra of THETAs isolated from rabbit aorta by negative ion LC-ESI-FTICR with IRMPD. MS/MS spectrum of m/z 353 obtained from negative ion ESI FTICR at detection time of (A) 8.93 min; (B) 9.28 min; (C) 9.46 min, and (D) 9.64 min.
These mass spectra revealed the presence of characteristic products, m/z 85, 167, 205, 197, 157, 139 and 207, which belonged to THETAs. The m/z 167, 205 and 85 were the characteristics of 11,14,15-THETA, and the m/z 197, 157, 139 and 207 were the characteristics of 11,12,15-THETA. As shown in Figure 5A, the characteristics of 11,14,15-THETA, such as m/z 167, 205 and 85, were observed, but no m/z 197, 157, 139 and 207 were observed, suggesting that 11,14,15-THETA eluted first. With a longer eluting time (as shown in Figure 5B, C and D), the m/z 197, 157, 139 and 207 appeared and the intensities of these ions increased, suggesting that 11,12,15-THETA eluted after 11,14,15-THETA.
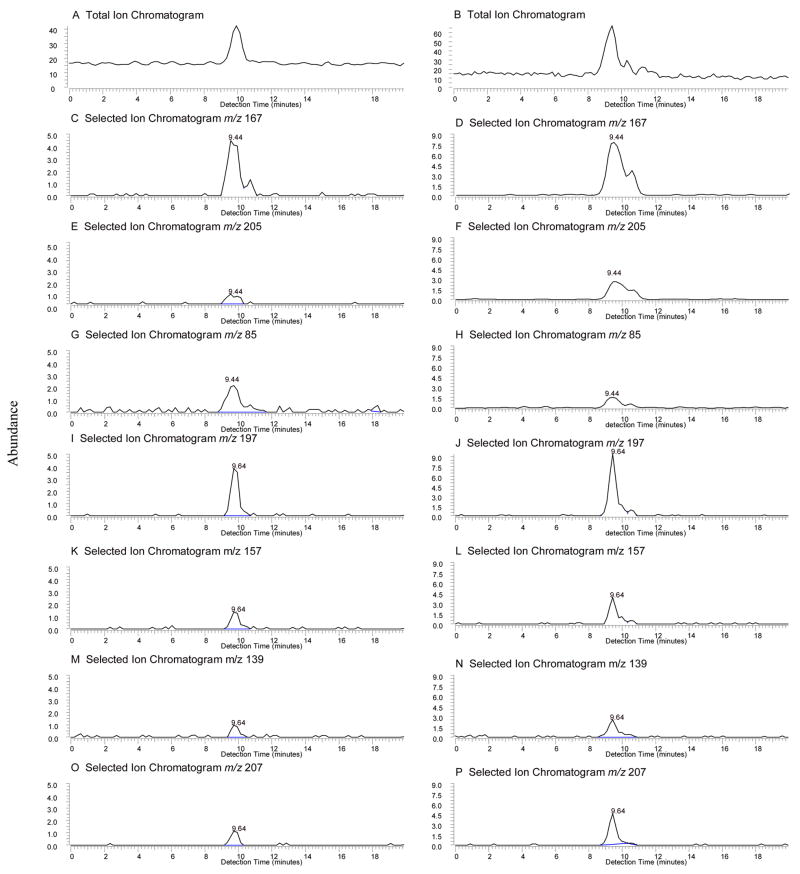
Figure 6 shows the total ion chromatograms (top panel by IRMPD) and the selected ion chromatograms of m/z 85, 139, 157, 167, 197, 205, and 207 by both SORI-CID and IRMPD. The m/z 167, the major ion for 11,14,15-THETA and the minor ion for 11,12,15-THETA, exhibited a broad peak. According to the different retention times of these ions (run time of 25.00 min + detection time), the ions could be divided into two groups. A group of m/z 167, 205 and 85 (Figure 6C, E, G and D, F, H) with identical detection times (9.44 min), suggesting that they were generated from one compound, 11,14,15-THETA. Another group of m/z 197,157, 139 and 207 (Figure 6I, K, M, O and J, L, N, P) with identical detection times (9.64 min), suggesting that they were from 11,12,15-THETA (see also Figure 4A, B, C, and D). The m/z 205 also exhibited a small peak at a longer detection time (10.60 min). This ion is present in the spectra of both 11,14,15- and 13,14,15-THETA. However, the peak of the biological sample at 10.60 min did not have m/z 193 and the retention time did not match 13,14,15-THETA, suggesting the possibility of another THETA being present at very low concentration.
Figure 6.
Total ion chromatograms and selected ion chromatograms of THETA fraction (top panels) isolated from rabbit aorta by negative ion LC-ESI-FTICR with SORI-CID and IRMPD. Total ion chromatograms by SORI-CID (A) and IRMPD (B); Selected ion chromatogram of m/z 167 by SORI-CID (C) and IRMPD (D); Selected ion chromatogram of m/z 205 by SORI-CID (E) and IRMPD (F); Selected ion chromatogram of m/z 85 by SORI-CID (G) and IRMPD (H); Selected ion chromatogram of m/z 197 by SORI-CID (I) and IRMPD (J); Selected ion chromatogram of m/z 157 by SORI-CID (K) and IRMPD (L); Selected ion chromatogram of m/z 139 by SORI-CID (M) and IRMPD (N); Selected ion chromatogram of m/z 207 by SORI-CID (O) and IRMPD (P).
Note: The indicated times were detection times (retention time = detection time + 25 min).
To further confirm the identity of these THETAs, a mixture of 11,12,15-THETA and 11,14,15-THETA was analyzed by LC-FTICR using the same conditions as the biological sample. The retention times and MS/MS spectra of biological THETAs were identical to the THETA standards. Comparing to the abundance of THETA standards, the concentration of THETAs in biological samples was approximately 800 pg on the column. The results indicated that both 11,12,15- and 11,14,15-THETA were produced in the rabbit aorta with 11,14,15-THETA being the major isomer.
Conclusions
Many isomers of low molecular weight, biologically active compounds such as eicosanoids can be present in biological samples. LC-MS and LC-MS/MS have been very successful in the identification and determination of eicosanoids with less complex molecular structures such as HETEs and DHETs. However, relatively newer groups of eicosanoids such as THETAs which contain more hydroxyl groups at various positions on the arachidonic acid backbone are more challenging. Chromatographic separation, particularly with reverse phase, of these compounds is difficult. Furthermore, the MS/MS fragmentation patterns of these compounds are very complex and not always useful for stereochemical identification.
Previously, eicosanoids were successfully identified by GC-MS. The substituents on the eicosanoids such as hydroxyl groups were typically derivatized to improve sample volatility. With increasing hydroxyl groups, the efficiency of chemical derivatization decreased. Thus, if LC-MS can accomplish the identification without the need for derivatization, it will be a powerful tool for these compounds. The SORI-CID and IRMPD in FTICR provide unique and useful spectral characteristics of highly substituted eicosanoids such as THETAs. Taking advantages of FTICR for its high mass resolution and accuracy, their fragments and molecular structures can be assigned. As demonstrated here, the regioisomers of the unresolved mixture of THETAs in biological samples were identified.
Table 6.
High-resolution accurate mass measurements by IRMPD FTICR for biological samples.
| Measured Ions (m/z) | Calculated Ions (m/z) | Error (ppm) | Elemental Composition |
|---|---|---|---|
| 353.23141 | 353.23335 | −5.5 | C20H33O5−1 |
| 317.21112 | 317.21222 | −3.5 | C20H29O3−1 |
| 299.20090 | 299.20165 | −2.5 | C20H27O2−1 |
| 273.22148 | 273.22239 | −3.5 | C19H29O −1 |
| 235.13307 | 235.13397 | −3.8 | C14H19O3−1 |
| 207.13821 | 207.13905 | −4.1 | C13H19O2−1 |
| 205.12257 | 205.12340 | −4.0 | C13H17O2−1 |
| 197.11747 | 197.11832 | −4.3 | C11H17O3−1 |
| 167.10673 | 167.10775 | −6.1 | C10H15O2−1 |
| 157.12265 | 157.12340 | −4.8 | C9H17O2−1 |
| 139.11211 | 139.11284 | −5.2 | C9H15O −1 |
| 85.02898 | 85.02950 | −6.1 | C4H5O 2−1 |
Acknowledgments
This equipment was made possible by the generosity of the Kern Family Foundation, the Walter Schroeder Foundation, the Stackner Family Foundation, Associated Bank, the Raymond and the Bernice Eschenburg Fund of the Greater Milwaukee Foundation, and an anonymous donor. The upgrades of the FTICR system was supported by Advancing a Healthier Wisconsin Research and Education Funding. These studies were supported by grants from the National Institute of Health (HL-37981 and GM-31278) and the Robert A. Welch Foundation.
Footnotes
Publisher's Disclaimer: This is a PDF file of an unedited manuscript that has been accepted for publication. As a service to our customers we are providing this early version of the manuscript. The manuscript will undergo copyediting, typesetting, and review of the resulting proof before it is published in its final citable form. Please note that during the production process errors may be discovered which could affect the content, and all legal disclaimers that apply to the journal pertain.
References
- 1.Laude DA. Electrospray Ionization Mass Spectrometry: Fundamentals, Instrumentation, and Applications. John Wiley & Sons, Inc; New York: 1997. Electrospray Ionization/Fourier Transform Ion Cyclotron Resonance Mass Spectrometry; pp. 291–320. [Google Scholar]
- 2.Flora JW, Muddiman DC. Determination of the relative energies of activation for the dissociation of aromatic versus aliphatic phosphopeptides by ESI-FTICR-MS and IRMPD. J Am Soc Mass Spectrom. 2004;15:121–127. doi: 10.1016/j.jasms.2003.10.004. [DOI] [PubMed] [Google Scholar]
- 3.Johnson KL, Ovsyannikova IG, Madden BJ, Poland GA, Muddiman DC. Accurate mass precursor ion data and tandem mass spectrometry identify a class I human leukocyte antigen A*0201-presented peptide originating from vaccinia virus. J Am Soc Mass Spectrom. 2005;16:1812–1817. doi: 10.1016/j.jasms.2005.07.015. [DOI] [PubMed] [Google Scholar]
- 4.Park Y, Lebrilla CB. Application of Fourier transform ion cyclotron resonance mass spectrometry to oligosaccharides. Mass Spectrom Rev. 2005;24:232–264. doi: 10.1002/mas.20010. [DOI] [PubMed] [Google Scholar]
- 5.Pasa-Tolic L, Masselon C, Barry RC, Shen Y, Smith RD. Proteomic analyses using an accurate mass and time tag strategy. Biotechniques. 2004;37:621–624. 626–633, 636. doi: 10.2144/04374RV01. passim. [DOI] [PubMed] [Google Scholar]
- 6.Page JS, Masselon CD, Smith RD. FTICR mass spectrometry for qualitative and quantitative bioanalyses. Curr Opin Biotechnol. 2004;15:3–11. doi: 10.1016/j.copbio.2004.01.002. [DOI] [PubMed] [Google Scholar]
- 7.Reinhold SW, Vitzthum H, Filbeck T, Wolf K, Lattas C, Riegger GA, Kurtz A, Kramer BK. Gene expression of 5-, 12-, and 15-lipoxygenases and leukotriene receptors along the rat nephron. Am J Physiol Renal Physiol. 2006;290:F864–872. doi: 10.1152/ajprenal.00169.2005. [DOI] [PubMed] [Google Scholar]
- 8.Newby CS, Mallet AI. Rapid simultaneous analysis of prostaglandin E2, 12-hydroxyeicosatetraenoic acid and arachidonic acid using high performance liquid chromatography/electrospray ionization mass spectrometry. Rapid Commun Mass Spectrom. 1997;11:1723–1727. doi: 10.1002/(SICI)1097-0231(19971015)11:15<1723::AID-RCM71>3.0.CO;2-K. [DOI] [PubMed] [Google Scholar]
- 9.Nithipatikom K, Isbell MA, See WA, Campbell WB. Elevated 12- and 20-hydroxyeicosatetraenoic acid in urine of patients with prostatic diseases. Cancer Lett. 2005 doi: 10.1016/j.canlet.2005.03.025. [DOI] [PubMed] [Google Scholar]
- 10.Fretland DJ, Anglin CP, Bremer M, Isakson P, Widomski DL, Paulson SK, Docter SH, Djuric SW, Penning TD, Yu S, et al. Antiinflammatory effects of second-generation leukotriene B4 receptor antagonist, SC-53228: impact upon leukotriene B4- and 12(R)-HETE-mediated events. Inflammation. 1995;19:193–205. doi: 10.1007/BF01534461. [DOI] [PubMed] [Google Scholar]
- 11.Suzuki N, Hishinuma T, Saga T, Sato J, Toyota T, Goto J, Mizugaki M. Determination of urinary 12(S)-hydroxyeicosatetraenoic acid by liquid chromatography-tandem mass spectrometry with column-switching technique: sex difference in healthy volunteers and patients with diabetes mellitus. J Chromatogr B Analyt Technol Biomed Life Sci. 2003;783:383–389. doi: 10.1016/s1570-0232(02)00666-9. [DOI] [PubMed] [Google Scholar]
- 12.Vanderhoek JY. Role of the 15-lipoxygenase in the immune system. Ann N Y Acad Sci. 1988;524:240–251. doi: 10.1111/j.1749-6632.1988.tb38547.x. [DOI] [PubMed] [Google Scholar]
- 13.Ternowitz T, Fogh K, Kragballe K. 15-Hydroxyeicosatetraenoic acid (15-HETE) specifically inhibits LTB4-induced chemotaxis of human neutrophils. Skin Pharmacol. 1988;1:93–99. doi: 10.1159/000210754. [DOI] [PubMed] [Google Scholar]
- 14.Grimminger F, Mayser P. Lipid mediators, free fatty acids and psoriasis. Prostaglandins Leukot Essent Fatty Acids. 1995;52:1–15. doi: 10.1016/0952-3278(95)90090-x. [DOI] [PubMed] [Google Scholar]
- 15.Capdevila JH, Falck JR, Harris RC. Cytochrome P450 and arachidonic acid bioactivation. Molecular and functional properties of the arachidonate monooxygenase. J Lipid Res. 2000;41:163–181. [PubMed] [Google Scholar]
- 16.Fang X, Kaduce TL, Weintraub NL, Harmon S, Teesch LM, Morisseau C, Thompson DA, Hammock BD, Spector AA. Pathways of epoxyeicosatrienoic acid metabolism in endothelial cells. Implications for the vascular effects of soluble epoxide hydrolase inhibition. J Biol Chem. 2001;276:14867–14874. doi: 10.1074/jbc.M011761200. [DOI] [PubMed] [Google Scholar]
- 17.Fang X, Weintraub NL, McCaw RB, Hu S, Harmon SD, Rice JB, Hammock BD, Spector AA. Effect of soluble epoxide hydrolase inhibition on epoxyeicosatrienoic acid metabolism in human blood vessels. Am J Physiol Heart Circ Physiol. 2004;287:H2412–2420. doi: 10.1152/ajpheart.00527.2004. [DOI] [PubMed] [Google Scholar]
- 18.Hirt DL, Capdevila J, Falck JR, Breyer MD, Jacobson HR. Cytochrome P450 metabolites of arachidonic acid are potent inhibitors of vasopressin action on rabbit cortical collecting duct. J Clin Invest. 1989;84:1805–1812. doi: 10.1172/JCI114365. [DOI] [PMC free article] [PubMed] [Google Scholar]
- 19.Fang X, Moore SA, Stoll LL, Rich G, Kaduce TL, Weintraub NL, Spector AA. 14,15-Epoxyeicosatrienoic acid inhibits prostaglandin E2 production in vascular smooth muscle cells. Am J Physiol. 1998;275:H2113–2121. doi: 10.1152/ajpheart.1998.275.6.H2113. [DOI] [PubMed] [Google Scholar]
- 20.Campbell WB, Gebremedhin D, Pratt PF, Harder DR. Identification of epoxyeicosatrienoic acids as endothelium-derived hyperpolarizing factors. Circ Res. 1996;78:415–423. doi: 10.1161/01.res.78.3.415. [DOI] [PubMed] [Google Scholar]
- 21.Campbell WB, Deeter C, Gauthier KM, Ingraham RH, Falck JR, Li PL. 14,15-Dihydroxyeicosatrienoic acid relaxes bovine coronary arteries by activation of K(Ca) channels. Am J Physiol Heart Circ Physiol. 2002;282:H1656–1664. doi: 10.1152/ajpheart.00597.2001. [DOI] [PubMed] [Google Scholar]
- 22.Li PL, Campbell WB. Epoxyeicosatrienoic acids activate K+ channels in coronary smooth muscle through a guanine nucleotide binding protein. Circ Res. 1997;80:877–884. doi: 10.1161/01.res.80.6.877. [DOI] [PubMed] [Google Scholar]
- 23.Oltman CL, Weintraub NL, VanRollins M, Dellsperger KC. Epoxyeicosatrienoic acids and dihydroxyeicosatrienoic acids are potent vasodilators in the canine coronary microcirculation. Circ Res. 1998;83:932–939. doi: 10.1161/01.res.83.9.932. [DOI] [PubMed] [Google Scholar]
- 24.Li PL, Chen CL, Bortell R, Campbell WB. 11,12-Epoxyeicosatrienoic acid stimulates endogenous mono-ADP-ribosylation in bovine coronary arterial smooth muscle. Circ Res. 1999;85:349–356. doi: 10.1161/01.res.85.4.349. [DOI] [PubMed] [Google Scholar]
- 25.Fisslthaler B, Popp R, Kiss L, Potente M, Harder DR, Fleming I, Busse R. Cytochrome P450 2C is an EDHF synthase in coronary arteries. Nature. 1999;401:493–497. doi: 10.1038/46816. [DOI] [PubMed] [Google Scholar]
- 26.Fang X, Hu S, Xu B, Snyder GD, Harmon S, Yao J, Liu Y, Sangras B, Falck JR, Weintraub NL, Spector AA. 14,15-Dihydroxyeicosatrienoic acid activates peroxisome proliferator-activated receptor-alpha. Am J Physiol Heart Circ Physiol. 2006;290:H55–63. doi: 10.1152/ajpheart.00427.2005. [DOI] [PubMed] [Google Scholar]
- 27.Pfister SL, Spitzbarth N, Edgemond W, Campbell WB. Vasorelaxation by an endothelium-derived metabolite of arachidonic acid. Am J Physiol. 1996;270:H1021–1030. doi: 10.1152/ajpheart.1996.270.3.H1021. [DOI] [PubMed] [Google Scholar]
- 28.Pfister SL, Spitzbarth N, Nithipatikom K, Edgemond WS, Falck JR, Campbell WB. Identification of the 11,14,15- and 11,12, 15-trihydroxyeicosatrienoic acids as endothelium-derived relaxing factors of rabbit aorta. J Biol Chem. 1998;273:30879–30887. doi: 10.1074/jbc.273.47.30879. [DOI] [PubMed] [Google Scholar]
- 29.Campbell WB, Spitzbarth N, Gauthier KM, Pfister SL. 11,12,15-Trihydroxyeicosatrienoic acid mediates ACh-induced relaxations in rabbit aorta. Am J Physiol Heart Circ Physiol. 2003;285:H2648–2656. doi: 10.1152/ajpheart.00412.2003. [DOI] [PubMed] [Google Scholar]
- 30.Gauthier KM, Spitzbarth N, Edwards EM, Campbell WB. Apamin-sensitive K+ currents mediate arachidonic acid-induced relaxations of rabbit aorta. Hypertension. 2004;43:413–419. doi: 10.1161/01.HYP.0000110945.84443.d2. [DOI] [PubMed] [Google Scholar]
- 31.Zhang DX, Gauthier KM, Chawengsub Y, Holmes BB, Campbell WB. Cyclooxygenase- and lipoxygenase-dependent relaxation to arachidonic acid in rabbit small mesenteric arteries. Am J Physiol Heart Circ Physiol. 2005;288:H302–309. doi: 10.1152/ajpheart.00661.2004. [DOI] [PubMed] [Google Scholar]
- 32.Kerwin JL, Torvik JJ. Identification of monohydroxy fatty acids by electrospray mass spectrometry and tandem mass spectrometry. Anal Biochem. 1996;237:56–64. doi: 10.1006/abio.1996.0200. [DOI] [PubMed] [Google Scholar]
- 33.Nakamura T, Bratton DL, Murphy RC. Analysis of epoxyeicosatrienoic and monohydroxyeicosatetraenoic acids esterified to phospholipids in human red blood cells by electrospray tandem mass spectrometry. J Mass Spectrom. 1997;32:888–896. doi: 10.1002/(SICI)1096-9888(199708)32:8<888::AID-JMS548>3.0.CO;2-W. [DOI] [PubMed] [Google Scholar]
- 34.Nakamura T, Henson PM, Murphy RC. Occurrence of oxidized metabolites of arachidonic acid esterified to phospholipids in murine lung tissue. Anal Biochem. 1998;262:23–32. doi: 10.1006/abio.1998.2749. [DOI] [PubMed] [Google Scholar]
- 35.Sun D, McDonnell M, Chen XS, Lakkis MM, Li H, Isaacs SN, Elsea SH, Patel PI, Funk CD. Human 12(R)-lipoxygenase and the mouse ortholog. Molecular cloning, expression, and gene chromosomal assignment. J Biol Chem. 1998;273:33540–33547. doi: 10.1074/jbc.273.50.33540. [DOI] [PubMed] [Google Scholar]
- 36.Wheelan P, Zirrolli JA, Murphy RC. Low-energy fast atom bombardment tandem mass spectrometry of monohydroxy substituted unsaturated fatty acids. Biol Mass Spectrom. 1993;22:465–473. doi: 10.1002/bms.1200220808. [DOI] [PubMed] [Google Scholar]
- 37.Nithipatikom K, DiCamelli RF, Kohler S, Gumina RJ, Falck JR, Campbell WB, Gross GJ. Determination of cytochrome P450 metabolites of arachidonic acid in coronary venous plasma during ischemia and reperfusion in dogs. Anal Biochem. 2001;292:115–124. doi: 10.1006/abio.2001.5044. [DOI] [PubMed] [Google Scholar]
- 38.MacPherson JC, Pavlovich JG, Jacobs RS. Biosynthesis of arachidonic acid metabolites in Limulus polyphemus amebocytes: analysis by liquid chromatography-electrospray ionization mass spectrometry. Biochim Biophys Acta. 1996;1303:127–136. doi: 10.1016/0005-2760(96)00097-5. [DOI] [PubMed] [Google Scholar]
- 39.Bylund J, Ericsson J, Oliw EH. Analysis of cytochrome P450 metabolites of arachidonic and linoleic acids by liquid chromatography-mass spectrometry with ion trap MS. Anal Biochem. 1998;265:55–68. doi: 10.1006/abio.1998.2897. [DOI] [PubMed] [Google Scholar]
- 40.Zhang JH, Pearson T, Matharoo-Ball B, Ortori CA, Warren AY, Khan R, Barrett DA. Quantitative profiling of epoxyeicosatrienoic, hydroxyeicosatetraenoic, and dihydroxyeicosatetraenoic acids in human intrauterine tissues using liquid chromatography/electrospray ionization tandem mass spectrometry. Anal Biochem. 2007;365:40–51. doi: 10.1016/j.ab.2007.03.001. [DOI] [PubMed] [Google Scholar]
- 41.Murphy RC, Barkley RM, Zemski Berry K, Hankin J, Harrison K, Johnson C, Krank J, McAnoy A, Uhlson C, Zarini S. Electrospray ionization and tandem mass spectrometry of eicosanoids. Anal Biochem. 2005;346:1–42. doi: 10.1016/j.ab.2005.04.042. [DOI] [PubMed] [Google Scholar]
- 42.Falck JR, Barma DK, Mohapatra S, Bandyopadhyay A, Reddy KM, Qi J, Campbell WB. Asymmetric synthesis of the stereoisomers of 11,12,15(S)-trihydroxyeicosa-5(Z),8(Z),13(E)-trienoic acid, a potent endothelium-derived vasodilator. Bioorg Med Chem Lett. 2004;14:4987–4990. doi: 10.1016/j.bmcl.2004.07.019. [DOI] [PubMed] [Google Scholar]


