Abstract
The wingbeat kinematics and wake structure of a trained house martin in free, steady flight in a wind tunnel have been studied over a range of flight speeds, and compared and contrasted with similar measurements for a thrush nightingale and a pair of robins. The house martin has a higher aspect ratio (more slender) wing, and is a more obviously agile and aerobatic flyer, catching insects on the wing. The wingbeat is notable for the presence at higher flight speeds of a characteristic pause in the upstroke. The essential characteristics of the wing motions can be reconstructed with a simple two-frequency model derived from Fourier analysis. At slow speeds, the distribution of wake vorticity is more simple than for the other previously measured birds, and the upstroke does not contribute to weight support. The upstroke becomes gradually more significant as the flight speed increases, and although the vortex wake shows a signature of the pause phase, the global circulation measurements are otherwise in good agreement with surprisingly simple aerodynamic models, and with predictions across the different species, implying quite similar aerodynamic performance of the wing sections. The local Reynolds numbers of the wing sections are sufficiently low that the well-known instabilities of attached laminar flows over lifting surfaces, which are known to occur at two to three times this value, may not develop.
Keywords: bird flight, aerodynamics, vortex wakes, wind tunnel, digital particle image velocimetry, Delichon urbica
1. Introduction
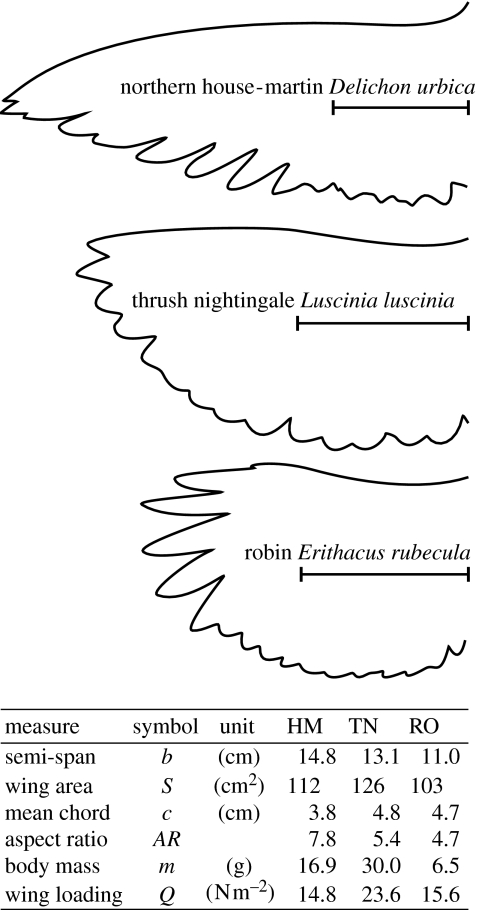
A number of studies have investigated in some detail the structure of the vortex wake in two bird species: the thrush nightingale Luscinia luscinia (Spedding et al. 2003a; Rosén et al. 2004) and the robin Erithacus rubecula (Hedenström et al. 2006) over a range of flight speeds. Both qualitatively and quantitatively, the wakes and the kinematics of the wingbeats that produced them were strikingly similar, and most features were consistent with quite simple aerodynamic models (Hedenström et al. 2006). Although they are both long-distance migrants, neither species could be regarded as being particularly notable in their apparent aerodynamic prowess, and their short, stubby wings do not appear to be extremely adapted to efficient migratory flight. While it is naive to imagine that almost any animal morphology is the result of optimization of a single function, nevertheless, the high energetic demands (high energy expenditure per unit time) of heavier-than-air, powered flight encourages a search for adaptations towards aerodynamic efficiency (as measured for example by the lift: drag ratio, where the drag required to maintain any given lift represents a cost whose compensating thrust must be generated by doing work) in animal flight. In particular, a classical result from aerodynamics texts (e.g. Anderson 1984) shows that the drag due to lift of fixed-wing aircraft is inversely proportional to the aspect ratio (AR=2b/c for a wing with semi-span b and chord c) and it would be interesting to know whether the measured wakes of higher-AR biological wing systems are the same, or different from those studied thus far. Figure 1 compares the wing planforms of the previously studied robin and thrush nightingale with the house-martin Delichon urbica, which is the focus of this paper. The house martin is also a long-distance migrant, leaving Northern Europe for central and southern Africa to winter, but in contrast to the primarily bush-dwelling songbirds, it feeds on aerial insects, spending most of its time in open airspace where it displays high agility and manoeuvrability.
Figure 1.
Wing planform of three different species of songbirds. Morphological characteristics are given in the table. The wings were measured according to Pennycuick (1989). HM, house martin; RO, robin; and TN, thrush nightingale.
The objective of this paper is to investigate the wingbeat kinematics and wake structure of the house martin, comparing and contrasting the findings with the previously reported thrush nightingale and robin data.
2. Methods
2.1 Birds, flight training and wind tunnel
On 15 May 2003, four house martins were caught at Ottenby Bird Observatory, Sweden. All were adult birds that had completed at least one migration to and from Africa. The birds were brought to the wind tunnel facility at Lund, and allowed some time of acclimation before flight training began. Early on in training it was evident that one of the birds would fly steadily for longer periods in the test section than the others. This bird was then trained intensively, using the same protocols developed in the thrush nightingale and robin studies (Spedding et al. 2003a; Hedenström et al. 2006). The house martin trained and handled easily, perhaps because it is well adapted to a life on the wing and has perfected the art of manoeuvring, a skill that makes this species more at ease in the confined environment of a wind tunnel test section.
Typical flights lasted about 20 s and were continuously repeated for 1.5 h before the bird was allowed to rest and feed in the aviary. Each flight was induced by rapidly lowering the perch where the bird was sitting, and after the bird had reached stable flight in the desired position, the recording of an image sequence was triggered (involving a burst of laser flashes). Subsequently, the perch was raised to allow landing by the bird. Most days of experiments consisted of two flight sessions, one in the morning and the other in the afternoon. The wake visualization experiments lasted from 28 May 2003 to 17 September 2003 and the high speed filming for kinematic analysis lasted from 24 September 2003 to 1 November 2003.
Wake data and kinematics were sampled at flight speeds 4, 6, 8 and 10 m s−1. All flight speeds are equivalent airspeeds that correct for variations in ambient pressure and density as noted in previous publications (e.g. Pennycuick et al. 1997). The average wind tunnel air characteristics in all experiments were (mean±s.d.): ρ=1.19±0.01 kg m−3, temperature=21.8±1.4°C and air pressure, p=1016±6 hPa. No safety nets were deployed inside or upstream of the test section, therefore the flow characteristics of the tunnel are also those given by Pennycuick et al. (1997).
2.2 Acquisition and analysis of kinematics
The bird was filmed using two digital high speed cameras (Redlake, MotionScope PCI500, USA) operated at 250 frames s−1 (shutter speed 1/1850 s, requiring approx. 2 kW light). One camera was positioned in line with the bird on the outside of the test section recording a side view [x, z], while the other camera was mounted 4 m downstream the bird, yielding a rear-view projection onto [y, z] (x, y and z are the tunnel coordinate axes in the streamwise, spanwise and vertical directions). All sequences from the rear-view camera are calculated as an average from both the wings; only one wing is visible from the side view. Sequences have been selected for stable flight with the bird positioned in the centre of field of view to minimize the effects of lens distortion. The two cameras were synchronized and the data from the rear-view camera are always matched by the coincident sequence from the side-view camera. Certain sequences at 4 and 6 m s−1 had only one wing visible from the rear view and so were not used. The number of sequences used in side view were [4, 5, 5, 5] and in rear view were [2, 3, 5, 5] at flight speeds, U, [4, 6, 8, 10] m s−1, respectively. The duration of sequences ranged from 0.124 to 0.420 s.
The raw data (strings of JPEG images) were digitized by hand to yield time sequences of [x, y, z] coordinates of characteristic points on the wings and body. On the side-view images, four points were digitized: tip of bill; wingtip; shoulder joint (the point where the humerus is attached to the body); and tail base. On the rear-view images, both wingtips and shoulder joints (wing roots; four points) were digitized.
The start of downstroke and upstroke were defined from the maxima in z of the trace of the wingtip ztip(t). The wingbeat frequency, f, is calculated from the duration of an integer number of wingbeats in a series and the wingbeat period is denoted T=1/f. If Td and Tu are the downstroke and upstroke periods, respectively, then the downstroke ratio, τ=Td/T. The wingbeat frequency, f, is the instantaneous frequency, and is not directly comparable to an ‘effective wingbeat frequency’ (Liechti & Bruderer 2002) taken as an average that includes gliding intervals.
The tip-to-tip amplitude is defined as 2A=ztip,max−ztip,min. The span ratio, R, is the ratio of the horizontal distance between the wingtips in mid-upstroke and mid-downstroke, when the wing passes through ztip(t)=0.
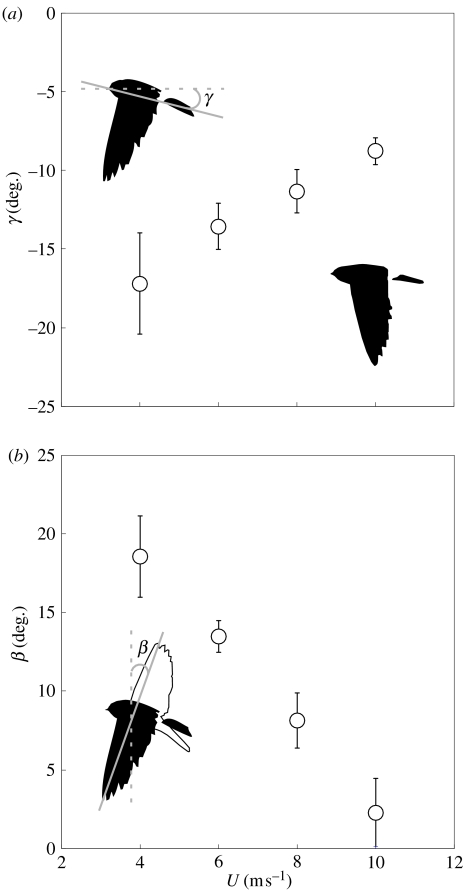
The body tilt angle, γ, is the angle between a straight line through the bill and the tail seen from the side-view camera, and the horizontal (see insert figure 4a). γ is averaged over an integer number of wingbeats. The stroke plane angle, β, is the inclination of the wingtip path from vertical, calculated as the angle between a straight line through the maxima and minima of ztip (see insert figure 4b).
Figure 4.
(a) Body-tilt angle, γ, calculated as an average over n discrete wingbeats in each series of consecutive wingbeats and (b) stroke-plane angle, β versus flight speed, U. Values are mean±s.d.
2.3 Acquisition and analysis of wake data
The procedures were as detailed in Spedding et al. (2003a,b) and only a brief summary is given here.
Pairs of images from two side-by-side mounted CCD cameras (Pulnix, TM9701N) were acquired at a sampling rate of 10 Hz, as dictated by the fixed repetition rate of the double-pulsed dual head Nd: YAG laser (Spectra Physics, Quanta Ray II). Each sequence would typically comprise 10 consecutive image pairs. The two frames of each image pair were analysed using a custom correlation imaging velocimetry (CIV) algorithm (Fincham & Spedding 1997) with adaptations for the dual camera geometry (Spedding et al. 2003b). Other than the quality of the laser and imaging optics, and of the particle seeding density, the single most important variable experimental parameter is the delay time between images in a pair, δt. Here it took values from 300 to 800 μs, depending on the wind tunnel speed, U, and on the flow complexity. In a correctly tuned system, the uncertainty in the velocity estimation is very approximately ±1% (although we may note that the probable estimation errors are not constant multiples of the velocity magnitude, but are fixed in pixels, the unit of camera discretization).
The velocity components in [x, y, z] are denoted [u, v, w]. For vertical image planes aligned in the streamwise direction, information on [u, w] in [x, z] allows the spanwise component of vorticity to be calculated from
| (2.1) |
ωy is computed during a smoothing spline interpolation of the raw data onto a regular grid, and not from finite difference calculations. The integrated strength of any contiguous patch of like-signed vorticity is measured by the circulation, Γ. Γ is summed over all above-threshold values of ωy in a local neighbourhood in grid cells of size dx×dz indexed by i, j,
| (2.2) |
The size of the local neighbourhood is a fixed constant. It is chosen so that most vortex patches fit within its boundaries, when their perimeter is defined as the edge of the above-threshold patch. There are occasional cases where above-threshold vorticity links two apparently different vortex patches of the same sign. The local neighbourhood cut-off prevents the two objects from being double-counted or artificially inflated. Then the neighbourhood edge (a circular arc across the border) is counted as the completing part of the patch perimeter. The presumed sub-threshold contributions of low amplitude vorticity outside the patch perimeter were included by assuming a sub-threshold Gaussian distribution of ωy that trails from the perimeter line. The symbols ω+, ω− and Γ+, Γ− denote quantities for individual patches of spanwise vorticity identified with positive-signed structures (most evidently created at the beginning of a downstroke) and negative ones (from the end of a downstroke). For short, they may be referred to as start and stop vortices, respectively.
In the wake experiments, a video camera mounted 4 m downstream of the bird recorded the position of the light sheet relative to the bird. The CIV analysis data were sorted into categories based on the measured intersection of the light sheet image with the silhouette of the wings and body. Image sequences are further selected for steady-level flight, as determined by both the downstream video and the calculated wake vorticity patterns.
3. Results
3.1 Flight characteristics
The flight of a house martin in the wild is characterized by a series of wingbeats followed by short gliding intervals and frequent sharp turns to catch the prey. In the wind tunnel, the bird is restricted by the confined space of the test section and the imposition of a steady uniform flow. Nevertheless, the characteristic mix of flapping and glide sequences is still shown while inside the test section. The gliding sequences are almost absent at the lowest flight speeds, but gradually increase in length and frequency with increasing U. The data presented here are selected for steady flapping flight only and therefore represent a subset of the general flight behaviour of the species.
3.2 Timing of the wingbeat cycle
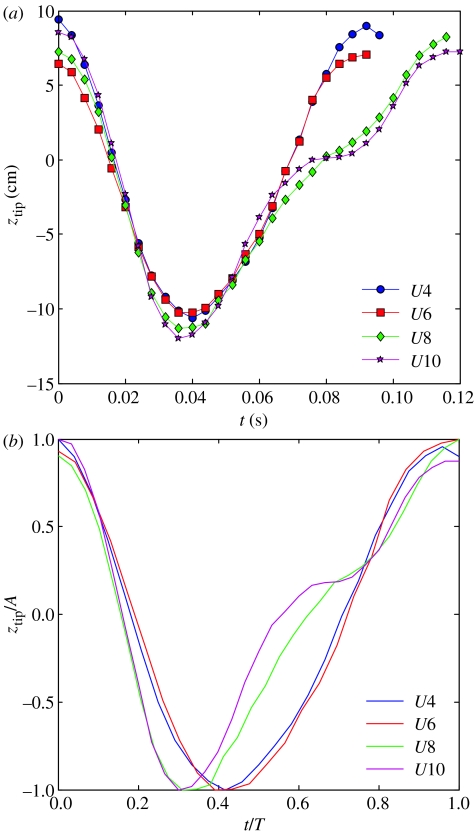
The primary difference in wingtip traces as the flight speed increases is the insertion of a characteristic pause in mid-upstroke, roughly at ztip(t)=0, for U≥8 m s−1 (figure 2a). The pause is associated with a very short effective wingspan, where the wingtips are held close to the body. The relative change in shape of the tip traces can be seen when ztip is normalized by the maximum amplitude and t by the wingbeat period T (figure 2b). The downstroke fraction decreases, and the length of the upstroke pause increases with increasing U. The change in shape of the waveform can be described in terms of its component frequencies, and the discrete Fourier transform of ztip(j), j=1, N is
| (3.1) |
where n frequencies have values over n=−N/2, N/2 and Δt is the sampling interval. The Z are complex coefficients, with phase and amplitude information. The wing trace can be reconstructed from the inverse transform
| (3.2) |
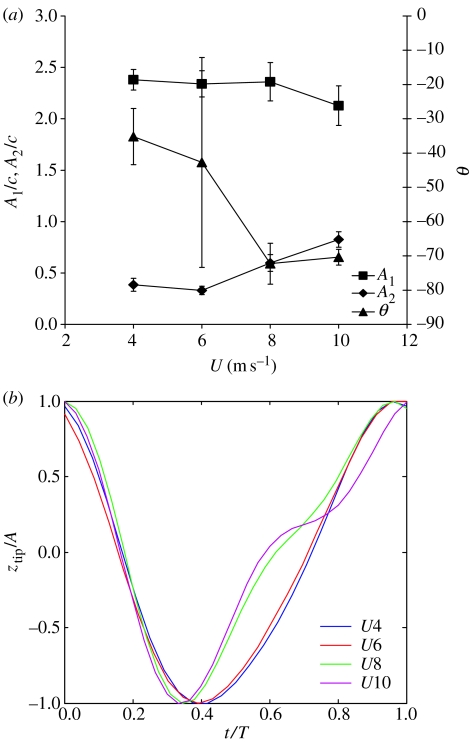
where nc, the number of Fourier coefficients used in the reconstruction, is less than or equal to the total available, N. Much information is in fact contained in just two coefficients, the highest amplitude coefficient at the wingbeat frequency itself, f1=f, and its first harmonic, f2=2f1. Figure 3a shows the amplitude and phase difference between these two frequency components as a function of flight speed U. For U=8 and 10 m s−1, the amplitude of the harmonic, f2, increases significantly and the phase difference between it and the fundamental increases. It is now possible to construct a synthetic wingbeat from only this information, and figure 3b has most of the characteristics of the original in figure 2b, including the pause at mid-upstroke. A simple but faithful mechanical or analytical model could be constructed from only these modes and the neurophysiological control and actuator system of the real bird might also reflect this simplicity.
Figure 2.
(a) Single typical wingbeats at flight speeds, U=4, 6, 8 and 10 m s−1. (b) Wing traces of (a) normalized with amplitude, A, and stroke period, T, to illustrate the change in shape with U.
Figure 3.
(a) The amplitude, A, and phase difference, θ, between the fundamental and the first harmonic frequencies of the wingtip trace. A1 and A2 are the real-valued magnitudes of complex coefficients Z1 and Z2. Values are mean±s.d. Number of sequences analysed for the different speeds are 2, 4, 5 and 5, respectively. (b) Wing trace reconstructions based only on the coefficients shown in (a).
Table 1 summarizes the wingbeat timing data. The wingbeat frequency drops by about 14% as the flight speed more than doubles from 4 to 10 m s−1. This is accompanied by a decrease in the downstroke ratio, τ. There are two dimensionless numbers that describe the relative time-scales of the motion. The Reynolds number (Re=ul/ν) can be thought of as characterizing time-scales of instabilities due to inertial forcing of coherent fluid motions of scale l moving at speed u versus the time-scale of viscous damping (ν is the kinematic viscosity) of these instabilities. The values based on the mean chord (l=c) and mean flow speed (u=U) fall between 1×10⁴ and 2.5×10⁴. Even though these are large numbers, they signal a proximity to flow regimes of marginal boundary-layer stability, where airfoil section shapes and smoothness are known to be of great importance. The second dimensionless number, the reduced frequency, k=ωc/2U, also spans a marginal range from 0.3 to 0.1. k is a measure of the time, c/2U, required for fluid to move over the half-chord versus the time period of oscillation of the forcing in the propulsion system (1/ω). When k=0.1 (from the highest flight speed at U=10 m s−1), one might argue that unsteady or time-varying motions can be ignored in aerodynamic analyses, but when k=0.3 the same argument is much less clear.
Table 1.
Characteristic times and frequencies associated with the wingbeat cycle of the house martin at different flight speeds (side-view camera). Values are ±s.d.
| speed | U (m s−1) | 4 | 6 | 8 | 10 |
|---|---|---|---|---|---|
| wingbeat frequency | f (Hz) | 11±1 | 10.7±0.2 | 10±1 | 9.1±0.7 |
| downstroke period | td (s) | 0.039±0.002 | 0.036±0.002 | 0.034±0.003 | 0.035±0.002 |
| upstroke period | tu (s) | 0.06±0.01 | 0.058±0.003 | 0.07±0.01 | 0.08±0.01 |
| downstroke ratio | τ | 0.41±0.03 | 0.38±0.02 | 0.34±0.02 | 0.32±0.03 |
| reduced frequency | k | 0.31±0.03 | 0.21±0.002 | 0.15±0.01 | 0.11±0.01 |
| Reynolds number | Re (×103) | 10 | 15 | 20 | 25 |
Local values of such dimensionless numbers characterizing particular span locations will be considered later.
3.3 Wingbeat geometry
At the higher flight speeds, the span ratio, R, drops by about 20% from its initial value of 0.4. At the same time, the wingbeat amplitude, A, increases by about 10%. These values are given in table 2. Larger changes are observed in the angles of the body with respect to the horizontal and the wings with respect to the vertical (figure 4). These are not independent quantities because the wings are attached to the body, but the body angle changes by about 8°, while the stroke plane angle changes by approximately 16°.
Table 2.
Simple geometric parameters of the wingbeat cycle (rear-view camera). c is the mean chord. Values are ±s.d.
| flight speed | U (m s−1) | 4 | 6 | 8 | 10 |
|---|---|---|---|---|---|
| amplitude | A/c | 2.5±0.2 | 2.5±0.2 | 2.6±0.2 | 2.7±0.1 |
| span ratio | R | 0.39±0.005 | 0.41±0.04 | 0.33±0.01 | 0.31±0.02 |
3.4 Geometry and quantitative properties of the wake
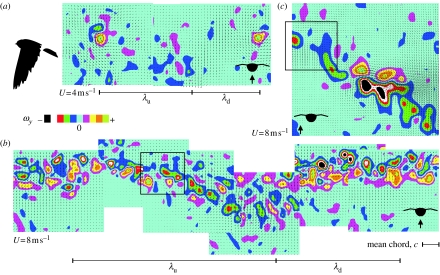
The wingbeat frequency of the house martin is close to the repetition rate of the laser at 10 Hz, therefore each sequence of images (usually 10 of them) is close to being phase-locked with some arbitrary phase of the wake cycle. The criterion for velocity field selection—that the field should be repeatable and come from level, apparently steady flight—is thus quite simple to impose. Figure 5 shows two composites compiled from multiple sequences, each on a different phase in the wingbeat. The wake wavelength can be calculated from the kinematics as λ=UT, and for a downstroke ratio τ, the downstroke wavelength, λd=τλ, and the upstroke-generated wake wavelength, λu=λ−λd.
Figure 5.
Vortex wakes at flight speed, U=4 and 8 m s−1 for a house martin, as shown by composite colour coded spanwise vorticity, ωy, with superimposed velocity field vectors. The individual panels originate from different series of data due to the phase-lock of laser and wingbeat frequency at 10 Hz. Data are from the vertical centreline in (a) and (b) and from mid-wing in (c). The bird silhouette is drawn to scale, but the data are taken about 22 chord lengths downstream of the bird. The boxes in (b) and (c) show the wake signature of the wingbeat pause in mid-upstroke. ωy is symmetrically mapped onto a 10-step colour bar (ωy is ±4U/c at 4 m s−1 and ±U/2c at 8 m s−1), and the resolution represents the uncertainty in the measurements. The wavelengths of the downstroke, λd, and upstroke, λu, and the mean chord, c, are shown for scale reference to (a) and (b).
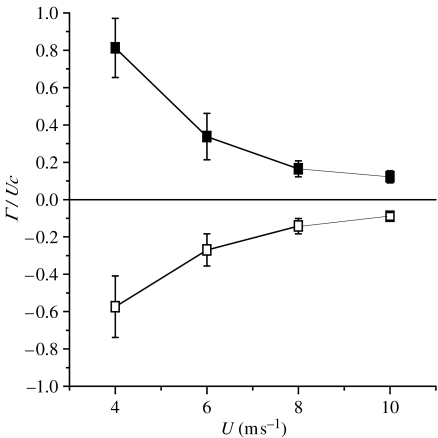
The wake at 4 m s−1 is characterized by comparatively few vortex structures that are usually located at the transitions from upstroke→downstroke and downstroke→upstroke regions. The start vortex generated at the beginning of the downstroke is much more compact and higher in peak vorticity magnitude than the corresponding stop vortex. The upstroke wake is much weaker in general than the downstroke wake. At the lowest flight speed it appears almost negligible. As U increases, the peak vorticity magnitude |ωy|max and maximum circulation |Γ|max of the structures in the upstroke wake also increase gradually. At the higher flight speeds, the wake is longer (since U is higher and T changes little) and weaker, and more disorganized vortex trails are left along a path that rises and falls in phase with the wingbeat trace that created it. The amplitude of the wingbeat must actually be very close to 0 at the body itself, and therefore by the time it reaches the measurement station, 22 chord lengths downstream of the bird, some information about the vertical displacement of the wake further along the span must have propagated into the centreline. Variation in measured circulation of the strongest starting (positive) and stopping (negative) vortices, respectively, as a function of flight speed is shown in figure 6.
Figure 6.
Variation in measured circulation (Γ) of the strongest starting (filled squares) and stopping (open squares) vortices, rescaled by the mean wing chord c and flight speed U, as a function of flight speed U. The error bars represent ±1 s.d.
The remarks on the general wake characteristics are just the same as for the thrush nightingale and for the robin. In the previous studies, a reference circulation Γ1 was defined as
| (3.3) |
This is the circulation that would be required to support the weight W for one wingbeat period, T, if the wake were composed of elliptic vortex loops of uniform circulation, Γ, and horizontally projected area, Se. If the observed circulation, Γobs, for the downstroke wake is measured by the maximum, the total measured value from the sum of all components of one sign found in the start vortex, throughout the downstroke, and the region surrounding the stop vortex, then for the house martin, the ratio of Γobs/Γ1 is approximately 1 at U=4 m s−1, for both positive and negative circulations. This is similar to the procedures for the thrush nightingale and robin, where it was also necessary to add contributions from the wake at the transition between down and upstrokes, however weak, in order to balance the averaged vertical forces. Unlike the thrush nightingale and robins however, the house-martin wake at low speeds has a negligible contribution to weight support from the upstroke at low flight speeds.
4. Discussion
4.1 Kinematic changes with flight speed
The basic changes in body angle γ, stroke plane angle β and wingbeat amplitude A can be understood in terms of the varying balance of lift and thrust requirements with varying U. In a time-averaged sense, the wingbeat kinematics are such that the mean momentum flux, which has both magnitude and direction, will be directed so as to support steady locomotion. When U is small, the mass flow per unit time over the wings is also comparatively small, and so a large fraction must be directed downwards to support the weight. As U increases, the mass flow rate also increases, and generating lift to balance weight requires less circulation, and less downward deflection of the oncoming air. The viscous and pressure drags on the wings and body increase with U2, however, and therefore the average force vector must be directed increasingly forward. β and γ both change in ways to perform this redirection, and when A increases, the magnitude of the differences between thrust from the downstroke and drag on the upstroke can also be balanced to maintain U. This is a rather general mechanism, so these qualitative changes in β and γ are similar to those found in other species such as barn swallows (Park et al. 2001), pigeons and magpies (Tobalske & Dial 1996).
The downstroke appears to occupy an almost constant time (in seconds), regardless of U, an observation that agrees well with previous studies (Tobalske & Dial 1996; Bruderer et al. 2001; Park et al. 2001; Rosén et al. 2004; Hedenström et al. 2006). On the other hand, the downstroke fraction, τ, decreases, associated with an increased duration of the upstroke. This relationship of τ with U seems rather general in birds studied in wind tunnels: barn swallows (Bruderer et al. 2001; Park et al. 2001), magpies and pigeons (Tobalske & Dial 1996), thrush nightingales (Rosén et al. 2004) and robins (Hedenström et al. 2006). Commonly, τ=0.5 at the lowest tested speed in other birds, but here τ=0.4 at U=4 m s−1. This speed is not limited by the willingness or ability of the house martin to fly steadily, but by the reliability of the wind tunnel operation, and extrapolating to τ=0.5 yields Umin=3 m s−1, a plausible value in this species.
Asymmetry of the correct sign in the downstroke : upstroke geometry to give net positive thrust can be reached through reducing the wing span on the upstroke, so that the span ratio, R<1. This is found in all previously studied species for which wind tunnel data are available (Tobalske & Dial 1996; Park et al. 2001; Hedrick et al. 2002; Rosén et al. 2004; Hedenström et al. 2006). R usually increases with increasing U, associated with the increased importance of the upstroke in generating lift (Rosén et al. 2004; Hedenström et al. 2006). However, in the house martin, R decreases significantly with increasing U (table 2). This trend is associated with the use of the wingbeat pause at 8 and 10 m s−1 in the house martin, where the wing is retracted towards the body to form a more streamlined profile in mid-upstroke than that observed in the thrush nightingale and robin at their faster flight speeds (Rosén et al. 2004; Hedenström et al. 2006). A similar decrease in R with increasing U was reported also in the barn swallow by Park et al. (2001). The barn swallow is a different genus than the house martin but has a similar morphology and also has a pause in mid-upstroke. An upstroke pause has also been found in the cockatiel which as a similar aspect ratio (AR=7) to that of the martin and swallow (Hedrick et al. 2002), but also in the house martin and the barn swallow studied in another wind tunnel (Bruderer et al. 2001). In a normal wingbeat, the wings pause during mid-upstroke and are then gradually extended to the starting position for the following downstroke. It is also from the pause position that the house martin shifts to gliding flight, which is accomplished by extending the wings from the pause position further into the free stream, with maintained position relative to the body (observations from rear-view camera during these experiments).
The function of the pause in higher aspect ratio, on wing hunting birds is not yet known. The kinematics vary with flight speed as if the basic lift and propulsion requirements can be easily met, and at higher speeds there is a phase at which variations in intermittent flight behaviour can be inserted. Brief gliding intervals can optionally be generated here, and it would be interesting to observe whether other turning or accelerating manoeuvres, upon which their aerial hunting lifestyle depends, also begin at this phase in the wingbeat.
4.2 Local wing section aerodynamics
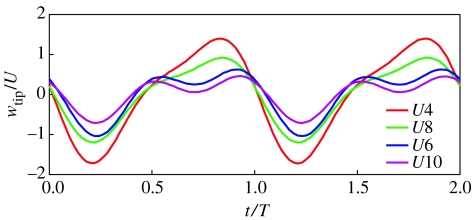
When the wing kinematics can be successfully modelled using a reduced number of Fourier modes, further synthetic models can readily be constructed. For example, the Fourier coefficients A1 and A2 for modes f1 and f2 can be differentiated directly to find the vertical wingtip speed as
| (4.1) |
where ω=2πf is the radian frequency, and the Fourier modes are expressed as real amplitudes A1,2 and their phase difference, θ. The result is shown for all flight speeds in figure 7.
Figure 7.
Normalized vertical wingtip speed over two wingbeat cycles, calculated from the reduced, two-frequency model.
The normalized tip speed (which is proportional to an inverse advance ratio) has the highest amplitude at the slowest flight speed. The tip speed maxima vary from approximately 0.5 to 1.5U—they are always comparable in magnitude to U. This suggests that quantities based simply on mean free stream U might not be the appropriate ones for even approximate calculations of local wing aerodynamics.
As an example, consider a local section Reynolds number
| (4.2) |
where uloc is a local relative velocity due to the oncoming wind and the wing motion itself, and c(y) is a local chord length at span station y along the wing. The local wing vertical velocity can be calculated from equation (4.1) and then multiplied by the local span station relative to the span,
| (4.3) |
so it is 0 at the root and equal to wtip at the tip, as though the wing were rigid and hinged at its root. Then,
| (4.4) |
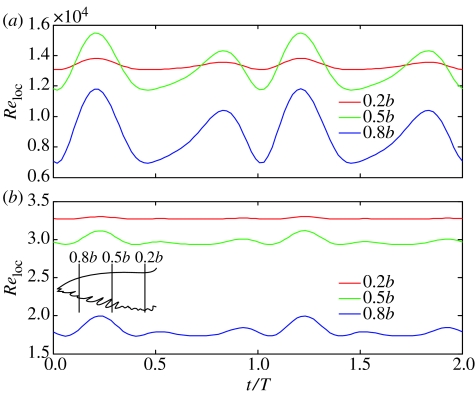
Figure 8 shows Reloc at U=4 and 10 m s−1, for three spanwise locations. Although the highest speeds occur at the wingtip, the highest Reynolds numbers do not, because the local chord is small. This is true even at 10 m s−1, and Reloc over the outer wing does not exceed 3×10⁴. Moreover, this estimate of Reloc near the wing tip is still likely to overestimate Re as the correct length-scale when the primaries separate would be a primary tip width.
Figure 8.
Local Reynolds numbers calculated close to the root (0.2b), at mid-wing (0.5b), and close to the tip (0.8b) in red, green and blue, respectively, for (a) U=4 m s−1 and (b) U=10 m s−1.
It has been remarked before (Spedding et al. 2003a, 2004) that birds appear to occupy a rather puzzling niche in a Reynolds number range where aerofoil section flow properties are notoriously unstable: difficult to predict, measure and compute. However, figures 7 and 8 together show that, just where one might expect great problems due to the high tip speeds, the local Reynolds numbers are actually quite moderate. There can be a very significant increase in the stability of aerofoil characteristics as the Reynolds number drops from the 5×10⁴ range to 2×10⁴ (Schmitz 1942). The flow becomes subcritical, requiring some significant disturbance to destabilize. Supercritical, attached flows at Re≈5×10⁴, on the other hand, are extremely sensitive to small perturbations, and suffer huge and abrupt increases in drag if, for example, the local angle of attack increases by just one or two degrees. Selig et al. (1989) give examples of drag polars—lift coefficient as a function of drag coefficient—using the Eppler 387, as an example of great variations in measured properties between facilities supposedly measuring the same flow when Re=6×10⁴. At Re=2×10⁴, recent measurements show that these variations are absent (Spedding et al. submitted).
The finding that local Reynolds numbers are comparatively small at the wingtip supports the idea that flow management over the bird wing may be less of a mystery than hitherto supposed. Although the flow may not be so close to instability as to be unduly sensitive to exact details of feather and vane geometry, it may still be close enough to allow predictable control by purposeful changes in geometry of the local wing section.
4.3 Predicting wake circulation
Hedenström et al. (2006) derived a relationship between wake circulation and body geometry and weight using a simple fixed wing analysis
| (4.5) |
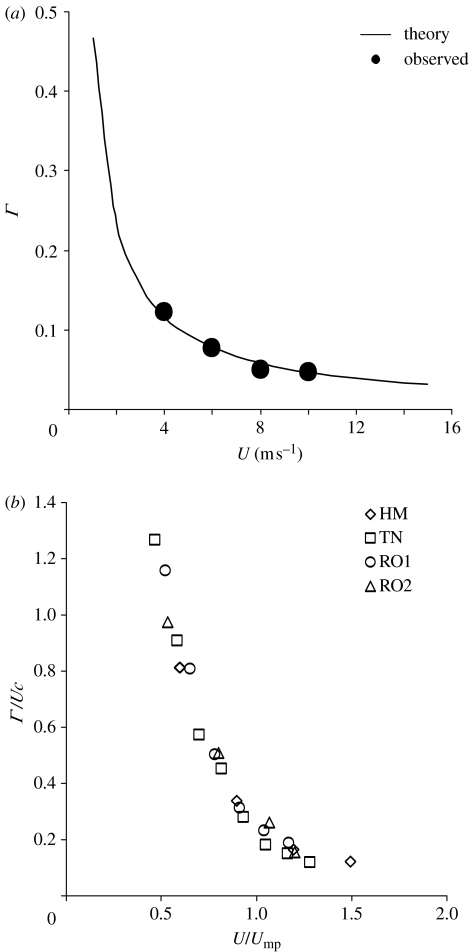
Equation (4.5) generates the solid curve in figure 9a for the house martin and the experimentally measured points agree well. It is far from obvious why the agreement should be too close, because the house-martin wake (or any of the others in figure 9b) is not much like a fixed wing wake. To illustrate the point, we may begin with a house martin in steady gliding flight, leaving behind a system of trailing vortices with circulation Γ that is quite closely predicted by equation (4.5). If gliding at constant speed, then the glide path must be descending, owing to the resistance to forward motion due to friction and pressure drags from the body and wings. In order to overcome that drag, our hypothetical bird begins to flap its wings. Doing so increases the circulation on them and changes the shape of the wake so that a net forward force, or thrust, is exerted. In fast or cruising flight, it is easy to imagine these perturbations to the original gliding wake being small, but at low speeds the departures in wake geometry must be, and demonstrably are, large (figure 5a). Nevertheless, the circulation Γ plotted in figure 9a is as if it were part of a rectangular vortex wake, and the strongest measurable circulations, at any speed, continue to take that value.
Figure 9.
(a) Circulation, Γ, of the strongest start (+) vortex as a function of flight speed, U, for the house martin. The theoretical curve is from equation (4.5). (b) Comparison of normalized circulations for the house martin (HM; this study), robin (RO1 and 2; Hedenström et al. 2006) and thrush nightingale (TN; Spedding et al. 2003a).
The wake circulations may be plotted in dimensionless form in order to compare different bird species. Γ/Uc is the natural choice of normalization for Γ measurements based on the spanwise vorticity formed over a wing chord of length c. We now require an equivalent flight speed among different birds. Because viscous and pressure drags rise with U (as U2) while drag due to lift decreases (as 1/U), all aerodynamics models (for birds and planes) predict a characteristic speed, Ump, at which mechanical power will be minimized, and this can be used as a reference flight speed. Estimates of Ump were found using the model described by Pennycuick (1989, Flight v. 1.16) for the house martin in this study, and for the thrush nightingale (Spedding et al. 2003a) and robins (Hedenström et al. 2006) of previous wind tunnel studies. Figure 9b shows that the curves agree well. It is not immediately obvious why this should be so. Equation (4.5) shows how one expects flying devices of different morphology to have different Γ. Dividing equation (4.5) by Uc, and setting L=W for steady, level flight,
| (4.6) |
where q=(1/2)ρU2 is the dynamic pressure based on the momentum flux through a surface of area S, given here by the planform area. Inspecting the right-hand side, we see that equation (4.6) is in fact a lift coefficient, and the collapse of the data for the different birds in figure 9b is consistent with their operating at roughly equal time-averaged lift coefficients.
5. Conclusions
There are two principal differences in the kinematics and wakes of the aerobatic house martin as compared with its bush-dwelling songbird counterparts. There is a measurable pause in mid-upstroke, where the wing is held comparatively close to the body. The signature of this phase can be seen in wake velocity and vorticity fields but has no obvious function. It appears to be the start point for intermittent gliding when that occurs and may act as general control stop. Second, it appears that at the lowest flight speed, the upstroke makes no contribution at all to weight support. The total wake circulation magnitudes are otherwise not different from previous measurements and agree well with simple predictive flight models, even though the reason for the close agreement with fixed wing models remains unclear. A decomposition of the wingbeat into its component Fourier modes shows that most features, including the pause phase, can be accounted for by only two oscillation modes. Manipulation of the simple wingbeat model shows that local wing section aerodynamics may be less prone to instability from small disturbances than suspected, because where the wing amplitude variations are large, the local wing section Reynolds numbers are always less than 2×10⁴.
The details of the aerodynamic function of the flapping wing will only be revealed when information is available from detailed three-dimensional, time-resolved wing geometry and similarly three-dimensional, time-resolved wake measurements. These could then be combined with reference aerofoil data now being gathered to form a more complete picture of the intricate balance of forces on the wing itself.
Acknowledgments
We are grateful to Felix Liechti and two anonymous referees for careful and constructive criticism. The research was supported by the Knut and Alice Wallenberg foundation, the Carl Tryggers foundation, the Swedish Research Council and the Swedish Foundation for International Cooperation in Research and Higher Education (STINT) (to A.H). A.H. is a Royal Swedish Academy of Sciences Research Fellow supported by a grant from the Knut and Alice Wallenberg Foundation. This study was approved by the Lund University Ethical committee for the use of live animals in research and follows the legal requirements in Sweden for keeping animals in captivity for research purposes.
References
- Anderson J.D. McGraw-Hill; New York, NY: 1984. Fundamentals of aerodynamics. [Google Scholar]
- Bruderer L, Liechti F, Bilo D. Flexibility in flight behaviour of barn swallows (Hirundo rustica) and house martins (Delichon urbica) tested in a wind tunnel. J. Exp. Biol. 2001;204:1473–1484. doi: 10.1242/jeb.204.8.1473. [DOI] [PubMed] [Google Scholar]
- Fincham A.M, Spedding G.R. Low-cost, high resolution DPIV for measurement of turbulent fluid flow. Exp. Fluids. 1997;23:449–462. doi: 10.1007/s003480050135. [DOI] [Google Scholar]
- Hedenström A, Rosén M, Spedding G.R. Vortex wakes generated by robins Erithacus rubecula during free flight in a wind tunnel. J. R. Soc. Interface. 2006;3:263–276. doi: 10.1098/rsif.2005.0091. [DOI] [PMC free article] [PubMed] [Google Scholar]
- Hedrick T.L, Tobalske B.W, Biewener A.A. Estimates of circulation and gait change based on a three-dimensional kinematic analysis of flight in cockatiels (Nymphicus hollandicus) and a ringed turtle-doves (Streptopelia risoria) J. Exp. Biol. 2002;205:1389–1409. doi: 10.1242/jeb.205.10.1389. [DOI] [PubMed] [Google Scholar]
- Liechti F, Bruderer L. Wingbeat frequency of barn swallows and house martins: a comparison between free flight and wind tunnel experiments. J. Exp. Biol. 2002;205:2461–2467. doi: 10.1242/jeb.205.16.2461. [DOI] [PubMed] [Google Scholar]
- Park K.J, Rosén M, Hedenström A. Flight kinematics of the barn swallow Hirundo rustica over a wide range of speeds in a wind tunnel. J. Exp. Biol. 2001;204:2741–2750. doi: 10.1242/jeb.204.15.2741. [DOI] [PubMed] [Google Scholar]
- Pennycuick C.J. Oxford University Press; Oxford, UK: 1989. Bird flight performance: a practical calculation manual. [Google Scholar]
- Pennycuick C.J, Alerstam T, Hedenström A. A new low-turbulence wind tunnel for bird flight experiments at Lund University, Sweden. J. Exp. Biol. 1997;200:1441–1449. doi: 10.1242/jeb.200.10.1441. [DOI] [PubMed] [Google Scholar]
- Rosén M, Spedding G.R, Hendeström A. The relationship between wingbeat kinematics and vortex wake of a thrush nightingale. J. Exp. Biol. 2004;207:4255–4268. doi: 10.1242/jeb.01283. [DOI] [PubMed] [Google Scholar]
- Schmitz F.W. Volckmann; Berlin, Germany: 1942. Aerodynamik des Flugmodells. [Google Scholar]
- Selig M.S, Donovan J.F, Fraser D.B. Soartech. vol. 8. Herk Stokely; Virgina Beach, VA: 1989. Airfoils at low speeds. [Google Scholar]
- Spedding G.R, Rosén M, Hedenström A. A family of vortex wakes generated by a thrush nightingale in free flight in a wind tunnel over its entire natural range of flight speeds. J. Exp. Biol. 2003a;206:2313–2344. doi: 10.1242/jeb.00423. [DOI] [PubMed] [Google Scholar]
- Spedding G.R, Hedenström A, Rosén M. Quantitative studies of the wakes of freely-flying birds in a low turbulence wind tunnel. Exp. Fluids. 2003b;34:291–303. doi: 10.1007/s00348-002-0559-8. [DOI] [Google Scholar]
- Spedding, G. R., McArthur, J., Rosén, M. & Hedenström, A. 2004 Force measurements and flow structure for fixed and flapping wings at low Reynolds number. In 11th Int. Symp. on flow visualization. University of Notre Dame, Notre Dame, Indiana, USA.
- Spedding, G. R., Hedenström, A., McArthur, J. & Rosén, M. Submitted. The implications of low-speed fixed-wing aerofoil measurements on the analysis and performance of flapping bird wings. [DOI] [PubMed]
- Tobalske B.W, Dial K.P. Flight kinematics of black-billed magpies and pigeons over a wide range of speeds. J. Exp. Biol. 1996;199:263–280. doi: 10.1242/jeb.199.2.263. [DOI] [PubMed] [Google Scholar]


