

Abstract
The amino acid composition and architecture of all β-barrel membrane proteins of known three-dimensional structure have been examined to generate information that will be useful in identifying β-barrels in genome databases. The database consists of 15 nonredundant structures, including several novel, recent structures. Known structures include monomeric, dimeric, and trimeric β-barrels with between 8 and 22 membrane-spanning β-strands each. For this analysis the membrane-interacting surfaces of the β-barrels were identified with an experimentally derived, whole-residue hydrophobicity scale, and then the barrels were aligned normal to the bilayer and the position of the bilayer midplane was determined for each protein from the hydrophobicity profile. The abundance of each amino acid, relative to the genomic abundance, was calculated for the barrel exterior and interior. The architecture and diversity of known β-barrels was also examined. For example, the distribution of rise-per-residue values perpendicular to the bilayer plane was found to be 2.7 ± 0.25 Å per residue, or about 10 ± 1 residues across the membrane. Also, as noted by other authors, nearly every known membrane-spanning β-barrel strand was found to have a short loop of seven residues or less connecting it to at least one adjacent strand. Using this information we have begun to generate rapid screening algorithms for the identification of β-barrel membrane proteins in genomic databases. Application of one algorithm to the genomes of Escherichia coli and Pseudomonas aeruginosa confirms its ability to identify β-barrels, and reveals dozens of unidentified open reading frames that potentially code for β-barrel outer membrane proteins.
Keywords: Proteomic, genomic, β-barrel, membrane protein, outer membrane, dyad repeat
The β-barrel is one of two known structural motifs for membrane-spanning proteins. As many as several hundred β-barrel species can be found in the outer membrane of Gram-negative bacteria (Schulz 2000; Alm et al. 2000; Molloy et al. 2000), and they also occur in the outer membranes of mitochondria (Benz 1994) and chloroplasts (Fischer et al. 1994). In addition to these native proteins, the β-barrel motif is also used by a large, diverse set of secreted membrane permeabilizing protein toxins and antibiotics that assemble into β-barrels on exogenous membranes (Saier 2000). In a recent review, Schulz (2000) summarized the main structural features shared by all known β-barrel membrane proteins in a list of 10 explicit rules: in summary, known β-barrels are composed of an even number of membrane-spanning β-strands with an antiparallel β-meander topology. Neighboring strands in the barrel are connected by alternating long and short loops. The lipid-interacting outer surfaces of all β-barrels are hydrophobic, and have a band of aromatics near the bilayer interfaces, while the internal residues have an intermediate polarity. Known structures contain between 8 and 22 strands and include monomeric, dimeric, and trimeric β-barrels. Many of these features are apparent in the structure of the dimeric β-barrel phospholipase, OmpLA, which is shown in Figure 1 ▶.
Fig. 1.

Molecular graphics image of a β-barrel outer membrane protein, the dimeric phospholipase OmpLA (Snijder et al. 1999). In this image we show the interfacial aromatic residues tryptophan and tyrosine in green and external charged residues in blue. These residues were used to orient the dimer in the bilayer plane (see text). The grid superimposed over the structure shows the protein in the bilayer-coordinate system that it was transformed to by the procedures described in the text.
One might assume that knowing these explicit rules would make the prediction of β-barrel structure and topology and the identification of β-barrels in genome databases readily solvable problems. In fact, several different types of structure prediction algorithms have been applied with mixed success (Schirmer and Cowan 1993; Fischbarg et al. 1995; von Heijne 1996), and recent structure prediction algorithms based on neural networks have been able to make reasonably accurate predictions of β-barrel structure and topology (Gromiha et al. 1997; Jacoboni et al. 2001). But these predictions were made for proteins already known to be β-barrel membrane proteins by other means. A more difficult part of the problem, and one that has not yet been solved, is the accurate identification of β-barrel membrane proteins in genome databases from physical principles. Currently, β-barrels are identified in genome annotations mainly by their homology to known β-barrels. Each Gram-negative bacterial genome has hundreds of "putative" and "probable" outer membrane proteins identified in this way. It would also be useful to able to identify them through their fundamental physical properties so that novel classes of β-barrels can be identified, and so that the homology-based annotation can be verified. Because each bacterial genome has as many as 1000 hypothetical or unknown proteins that have not been classified at all, there are undoubtedly many β-barrel membrane proteins that have not yet been identified.
We are broadly interested in understanding β-barrel membrane proteins through a knowledge of their composition and physical properties and through parallel studies of how model β-sheets assemble in membranes (Bishop et al. 2001). In theory, a thorough understanding of the fundamental physical principles should contain sufficient information to allow researchers to determine if an unknown protein sequence is a β-barrel membrane protein. For α-helical bundle membrane proteins this idea is a proven one; prediction algorithms based on the physical principle that membrane-spanning helices will have a contiguous stretch of 19 or more hydrophobic residues, have very high accuracy (Rost et al. 1995; Casadio et al. 1996; Krogh et al. 2001), exceeding 99% in recent applications (S. Jayasinghe, K. Hristova, and S.H. White, 2001). However, β-barrel membrane proteins have been more difficult to identify from physical principles for several reasons. First, their hydrophobic, membrane-interacting residues are cryptic, hidden in the alternating inside-outside (dyad repeat) motif. Second, compared to helical membrane proteins, there are many fewer membrane-interacting residues on each strand, and this reduces the uniqueness of the membrane-spanning sequences. And third, some β-sheets in soluble proteins have, superficially, many of the same physical properties, such as similar strand length and amphipathicity as the β-sheets of β-barrel membrane proteins. In this work we set out to analyze the composition and architecture of all β-barrel membrane proteins of known structure, including many new structures, and to generate a body of data that will be a useful starting point in the rapid identification of β-barrel membrane proteins in genome databases.
Results
The β-barrel database
All of the initial β-barrel structures published in the early 1990s belong to the closely related class of trimeric porins of 16 or 18 membrane-spanning β strands. The architecture of this class of porins has been discussed in the literature (Seshadri et al. 1998). In the last few years, the total number of known β-barrel membrane proteins has nearly doubled, and the architectural diversity of known structures has increased significantly with the addition of new β-barrel membrane proteins having different functions, topology, and architecture. For example, three-dimensional structures are now known for the monomeric, TonB-dependent transport proteins FepA (Buchanan et al. 1999) and FhuA (Locher et al. 1998), which have 22 β-strands each and for the trimeric, single-barrel transporter TolC (Koronakis et al. 2000) in which each monomer contributes four β-strands to a 12-stranded barrel. New additions also include the first known dimeric β-barrel, OmpLA (Snijder et al. 1999), shown in Figure 1 ▶, and the adhesion protein OmpX (Vogt and Schulz 1999), a monomeric eight-stranded β-barrel.
For this work we identified all β-barrel membrane proteins in the Protein Data Bank (Berman et al. 2000) and used a BLAST (Altschul et al. 1990) sequence alignment to screen each sequence against all other sequences in the PDB. For closely homologous or identical sequences (i.e., those with more than 70% conserved residues) we eliminated all but one member. The β-barrel database that we used in the calculations is described in detail in Table 1. It has 15 diverse members comprising a total of 210 membrane-spanning β-strands with more than 2000 amino acids in the membrane-spanning segments.
Table 1.
The β-barrel database
| Protein | Organism | PDB codea | Architecture | Strands | Reference |
| Porin | Rhodobacter capsulatus | 2POR | trimer | 16 | Weiss and Schulz 1992 |
| Pho E | Escherichia coli | 1PHO | trimer | 16 | Cowan et al. 1992 |
| Porin | Rhodobacter blastica | 1PRN | trimer | 16 | Kreusch and Schulz 1994 |
| Omp F | Escherichia coli | 1OPF | trimer | 16 | Cowan et al. 1995 |
| α hemolysin | Staphylococcus aureus | 1AHL | heptameric single barrelb | 2 | Song et al. 1996 |
| Maltoporin | Salmonella Typhimurium | 2MPR | trimer | 18 | Meyer et al. 1997 |
| Omp A | Escherichia coli | 1BXW | monomer | 8 | Pautsch and Schulz 1998 |
| Sucrose porin | Salmonella Typhimurium | 1AOS | trimer | 18 | Forst et al. 1998 |
| FhuA | Escherichia coli | 1BY5 | monomer | 22 | Locher et al. 1998 |
| Osmoporin | Klebsiella Pneumoniae | 1OSM | trimer | 16 | Dutzler et al. 1999 |
| FepA | Escherichia coli | 1FEP | monomer | 22 | Buchanan et al. 1999 |
| OmpLA | Escherichia coli | 1QD6 | dimer | 12 | Snijder et al. 1999 |
| Omp X | Escherichia coli | 1QJ9 | monomer | 8 | Vogt and Schulz 1999 |
| Tol C | Escherichia coli | 1EK9 | trimeric single barrelc | 4 | Koronakis et al. 2000 |
| Omp 32 | Comamonas acidovorans | 1E54 | trimer | 16 | Zeth et al. 2000 |
a Accession number for the structure in the protein data bank (Berman et al. 2000).
b Each monomer contributes two β-strands to the 14 stranded barrel.
c Each monomer contributes four β-strands to the 12 stranded barrel.
Identification of membrane-spanning segments
Three features, which are present in all β-barrel structures, were used to align the XY plane of each protein's Cartesian coordinates with the putative plane of the bilayer: the band of aromatics that lies in the bilayer interfacial region (Schiffer et al. 1992; von Heijne 1994; Yau et al. 1998), the band of charged residues just outside of the aromatics, and the band of aliphatic residues that interact with the hydrocarbon core of the bilayer (see Fig. 1 ▶ for an example). Structure coordinates were transformed as described in Materials and Methods so that the three bands of residues around each β-barrel (aromatic, aliphatic, and charged) were aligned with the XY plane of the new coordinate system.
After aligning the structures along the bilayer normal, we identified all β-strands in each structure using the annotation in the PDB datafile, and we identified the β-strands that span the membrane by inspection of molecular graphics images. One additional residue beyond the designated membrane-spanning β-sheet was also included in each strand segment. Residues in a membrane-spanning strand were designated as either exposed, internal, or involved in protein–protein interfaces. Exposed residues were those whose Cα to Cβ vector extended away from the axis of the barrel and whose side chain was more than 50% "solvent" exposed on the barrel surface. Internal residues were those whose Cα to Cβ vector pointed towards the interior of the barrel. The geometry of β-sheet secondary structure places side chains on alternating inner and outer surfaces of the β-sheet so this distinction is unambiguous. We classified the numerous glycine residues in the β-barrel database by the orientation of their Cα-H vectors and the exposure of the α carbon. We did not differentiate between internal residues that were exposed to water within an aqueous pore or those that were buried in the protein. Residues in protein–protein contacts were those residues whose Cα to Cβ vector was oriented out from the barrel axis, but whose side chain was not exposed in the multimer structure because of protein–protein contacts. Because we are trying to characterize and exploit the unique physical properties of the membrane-interacting surfaces of these proteins, we have excluded the residues in protein–protein contacts from the database. The properties and composition of these residues, which are similar to protein–protein interfaces in soluble proteins, have been discussed (Seshadri et al. 1998).
Identification of the bilayer midplane with hydrophobicity profiles
Hydrophobicity profiles for the external and internal residues for all XY-aligned structures were calculated by summing the hydrophobicity of all β-strand residues within a 5-Å sliding window that was moved along the axis of the bilayer normal. Examples of hydrophobicity profiles for external residues are shown in Figure 2A and B ▶. For this analysis we used an experimentally derived hydrophobicity scale measured for peptides partitioning into bulk octanol (Wimley et al. 1996). This scale is "absolute" in the sense that it is a whole-residue hydrophobicity scale that includes contributions from both the side chains and the polypeptide backbone. Thus, negative ΣΔG values indicate a net preference of the polypeptide in the window for an octanol phase relative to water. For all the β-barrel structures examined, the hydrophobicity profile of the external surfaces was very similar to the examples shown in Figure 2A and B ▶, with a band of negative ΣΔG 27-Å wide (average: 26.5 ± 0.7 SD Å) flanked by regions of large positive ΣΔG. The 27-Å band corresponds to the width of the bacterial outer membrane. The crossover points signify the edges of the hydrophobic membrane phase.
Fig. 2.
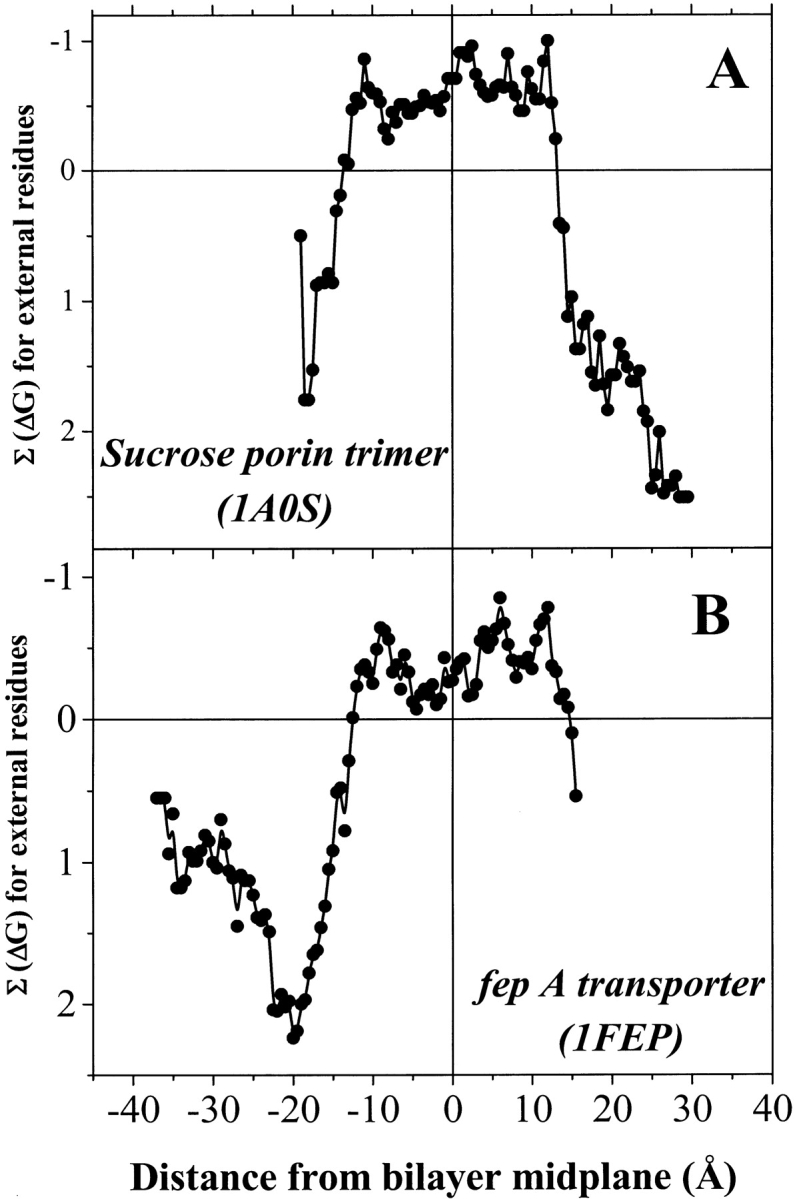
Examples of external hydrophobicity profiles for two β-barrels. (A) The trimeric 18-stranded sucrose porin from Salmonella typhimurium (Table 1). (B) The monomeric 22-stranded iron transport protein fepA from Escherichia coli (Table 1). A 5-Å sliding window was used to generate hydrophobicity profiles for exposed barrel residues that were identified and centered on the bilayer midplane as described in the text. The hydrophobicity scale used was an experimentally determined scale based on partitioning of model peptides into octanol. Negative numbers on the X-axis signify residues closer to the periplasmic space. Negative numbers of the Y-axis signify residues that are more hydrophobic.
The midpoint of the negative ΣΔG band, as delineated by the crossover points, was taken to be the midpoint of the bilayer. We transformed the coordinates of the β-barrel structures so that the bilayer midplane for all structures was set to z = 0. This places all of the proteins in the database on a universal "bilayer" coordinate system. The transbilayer profiles for all of the β-barrel proteins in the database (e.g., Fig. 2A,B) were remarkably similar. Composite profiles calculated from the sum of all the β-barrels are shown in Figure 3A and B ▶. There are several universal features of the hydrophobicity profiles that may be important for genomic identification of β-barrel membrane proteins. The 27-Å negative ΣΔG band, the pronounced peaks in the distribution of external aromatic residues at ±10 Å, and the peaks in the abundance of external charged residues at ±15 Å. In Figure 3B ▶ we also show the hydrophobicity profile of the internal β-barrel residues, which have a featureless broad hydrophilic character across the membrane.
Fig. 3.

Composite transbilayer profiles for all β-barrel membrane proteins of known structure. (A) Fractional abundance of external aromatic and ionized residues summed over a 5-Å sliding window. The abundance is divided by the total number of external residues within the window. (B) Composite hydrophobicity of internal and exposed amino acids in the β-barrel membrane proteins of known structure (Table 1). The hydrophobicity scale is an absolute scale based on octanol partitioning of model peptides (Wimley et al. 1996), and was calculated using a 5-Å sliding window. Negative numbers on the X-axis signify residues closer to the periplasmic space, and negative numbers on the Y-axis of (B) signify greater hydrophobicity. The hydrophobic thickness of the membrane, 27 Å, is centered on X = 0 Å, and is shown as a gray box. Note that the hydrophobicity scale is an absolute scale that has not been normalized. The fact that the natural zero level of the octanol scale corresponds exactly to the actual membrane-spanning segments has been noted elsewhere for helical bundle membrane proteins applications (S. Jayasinghe, K. Hristova, and S.H. White 2001).
Composition of β-barrels
The β-barrel database contains 1592 amino acids in membrane-spanning β-barrels that are either exposed or internal and about 400 additional residues that are found at protein–protein interfaces. Raw abundance (Fig. 4 ▶) was determined for residues within the 27 Å width of the bilayer, or ±13.5 Å from the bilayer midplane and also for interfacial and hydrocarbon core regions of the bilayer separately. The bilayer thickness was subdivided, following structural models of bilayers (Wiener and White 1992), into a hydrocarbon core region ±6.5 Å from the midplane and an interfacial region between 6.5 and 13.5 Å from the midplane. Interior residues had similar abundances in both regions of the bilayer, as shown in Figure 4B ▶ and listed in Table 2. However, some external residues had very distinct abundance differences between the hydrocarbon core and the interface. For example, tyrosine is about twofold more abundant in the interface than the core, and tryptophan is about sixfold more abundant in the interface, while leucine and alanine are about half as abundant in the interface as in the hydrocarbon core. Abundance data are given in Table 2, and are available as electronic supplementary material.
Fig. 4.
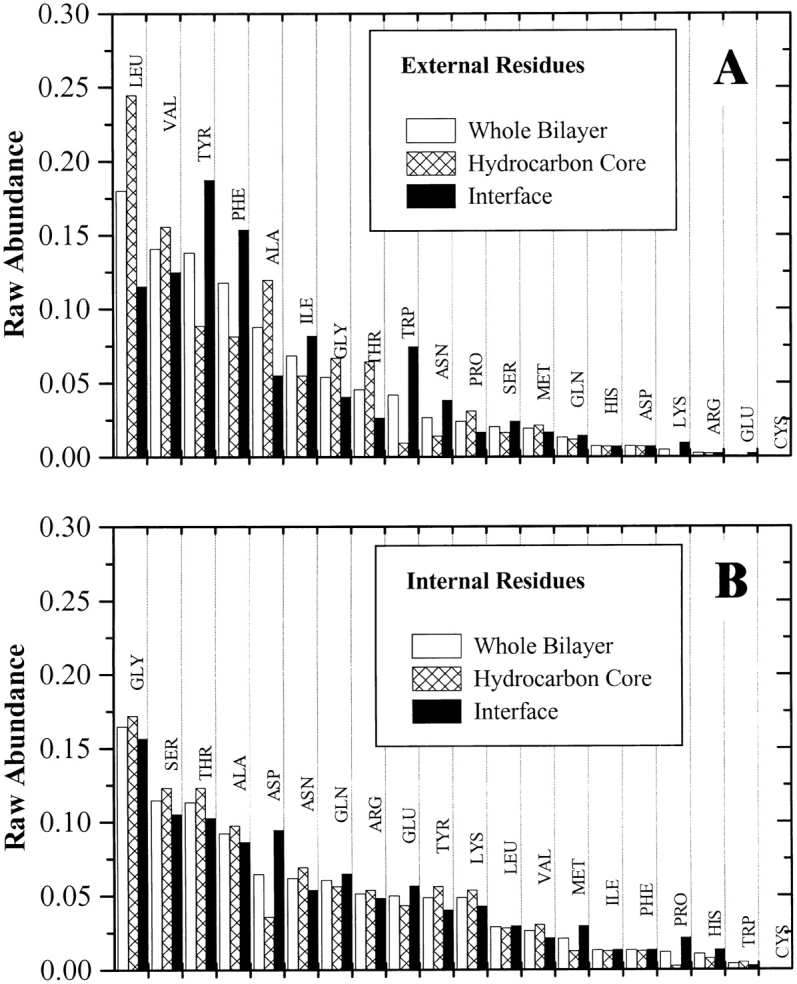
Raw amino acid abundance for the external and internal amino acids in the database of all known β-barrel membrane proteins. (A) External residues. (B) Internal residues. Raw abundance values are the total number of each amino acid divided by the total number of amino acids in that structural subclass. In addition to the abundance across the whole bilayer, we also show the abundance for each of two bilayer regimes, the hydrocarbon core ±6.5 Å from the bilayer midplane and the bilayer interface between 6.5 and 13.5 Å from the midplane. Abundance values are ranked, left to right, by the value for the whole bilayer.
Table 2.
Composition data for β-barrels of known structure
| Abundance on external surfaces | Abundance on internal surfaces | |||||||||||
| Bilayera | Interfaceb | Corec | Bilayer | Interface | Core | |||||||
| Amino acid | Rawd | Norme | Raw | Norm | Raw | Norm | Raw | Norm | Raw | Norm | Raw | Norm |
| Ala | 0.088 | 0.87 | 0.055 | 0.55 | 0.120 | 1.19 | 0.092 | 0.91 | 0.086 | 0.86 | 0.098 | 0.97 |
| Arg | 0.002 | 0.04 | 0.002 | 0.042 | 0.002 | 0.04 | 0.051 | 0.90 | 0.049 | 0.85 | 0.054 | 0.95 |
| Asu | 0.026 | 0.70 | 0.038 | 1.0 | 0.014 | 0.38 | 0.062 | 1.63 | 0.054 | 1.42 | 0.069 | 1.83 |
| Asp | 0.007 | 0.13 | 0.007 | 0.13 | 0.007 | 0.13 | 0.065 | 1.20 | 0.095 | 1.75 | 0.036 | 0.67 |
| Cysf | 0 | 0.02f | 0 | 0.02f | 0 | 0.02f | 0 | 0.02f | 0 | 0.02f | 0 | 0.02f |
| Gln | 0.013 | 0.31 | 0.014 | 0.34 | 0.012 | 0.29 | 0.061 | 1.44 | 0.065 | 1.54 | 0.057 | 1.35 |
| Glug | 0.001 | 0.02 | 0.002 | 0.041 | 0 | 0.02g | 0.050 | 0.86 | 0.057 | 0.98 | 0.044 | 0.75 |
| Gly | 0.054 | 0.71 | 0.041 | 0.54 | 0.067 | 0.88 | 0.165 | 2.17 | 0.157 | 2.06 | 0.172 | 2.27 |
| His | 0.007 | 0.33 | 0.007 | 0.33 | 0.007 | 0.33 | 0.011 | 0.48 | 0.014 | 0.61 | 0.008 | 0.35 |
| Ile | 0.068 | 1.18 | 0.082 | 1.4 | 0.055 | 0.95 | 0.013 | 0.23 | 0.014 | 0.23 | 0.013 | 0.22 |
| Leu | 0.180 | 1.75 | 0.115 | 1.1 | 0.245 | 2.37 | 0.029 | 0.28 | 0.030 | 0.29 | 0.028 | 0.27 |
| Lysh | 0.005 | 0.11 | 0.010 | 0.22 | 0 | 0.02h | 0.049 | 1.11 | 0.043 | 0.98 | 0.054 | 1.23 |
| Met | 0.019 | 0.71 | 0.017 | 0.62 | 0.022 | 0.80 | 0.021 | 0.78 | 0.030 | 1.10 | 0.013 | 0.48 |
| Phe | 0.118 | 3.10 | 0.154 | 4.0 | 0.082 | 2.15 | 0.013 | 0.35 | 0.014 | 0.36 | 0.013 | 0.34 |
| Pro | 0.024 | 0.55 | 0.017 | 0.38 | 0.031 | 0.71 | 0.012 | 0.27 | 0.022 | 0.49 | 0.003 | 0.06 |
| Ser | 0.020 | 0.35 | 0.024 | 0.41 | 0.017 | 0.29 | 0.115 | 1.98 | 0.105 | 1.82 | 0.123 | 2.13 |
| Thr | 0.046 | 0.83 | 0.026 | 0.48 | 0.065 | 1.18 | 0.113 | 2.06 | 0.103 | 1.87 | 0.123 | 2.24 |
| Trp | 0.042 | 3.00 | 0.075 | 5.3 | 0.010 | 0.69 | 0.004 | 0.28 | 0.003 | 0.19 | 0.005 | 0.37 |
| Tyr | 0.138 | 4.93 | 0.188 | 6.7 | 0.089 | 3.17 | 0.049 | 1.74 | 0.041 | 1.45 | 0.057 | 2.02 |
| Val | 0.140 | 1.98 | 0.125 | 1.8 | 0.156 | 2.20 | 0.026 | 0.37 | 0.022 | 0.30 | 0.031 | 0.43 |
a The bilayer is defined as the region ±13.5 Å from the bilayer midplane defined as shown in Figures 1, 2, and 3 ▶ ▶ ▶.
b The interface is the region more than ±6.5 Å from the bilayer midplane, but equal to or less than 13.5 Å away.
c The hydrocarbon core of the membrane is the region within ±6.5 Å of the bilayer midplane.
d Raw abundance is abundance in the β-barrel database divided by the total number of amino acids.
e Normalized abundance is the raw abundance divided by the genomic abundance, calculated as described in the text.
f There are no cysteine residues in the β-barrel database. For genomic screening the normalized abundance of Cys was set to 0.02.
g There are no glutamate residues in the external hydrocarbon core areas. For genomic screening the normalized abundance of Glu in the core was set to 0.02.
h There are no lysine residues in the hydrocarbon core areas. For genomic screening the normalized abundance of Lys in the core was set to 0.02.
The information content of an amino acid abundance measurement such as those shown in Figure 4A and B ▶ does not reside in the raw abundance values but instead in the deviation of the observed abundance from the expected genomic abundance. We, therefore, calculated the expected abundance of each amino acid in the database, fx, using a weighted average of genomic abundances, fix, using
 |
where the relative weight, wi, is for each organism, i. Weights were calculated by
 |
where ni is the number of amino acids in the database that are from each organism, i, and ntotal is the total number of amino acids in the database. Relative β-barrel abundance values (Table 2) were calculated by dividing raw abundance by the weighted expectation values, fx. Relative abundances are plotted in Figure 5A and B ▶ and are listed in Table 2. The dotted line in the relative abundance plots (Fig. 5A,B), shows the value of 1 expected from the genomic abundance. Deviations from 1 are a measure of the information content of each amino acid (Seshadri et al. 1998). Note that the most abundant external β-barrel residues leucine and valine (Fig. 4A ▶), have a smaller information content in the relative scale (Fig. 5A ▶) because of their high natural abundance, while the aromatics have a high information content.
Fig. 5.

Normalized amino acid abundance for the external and internal amino acids in the database of all known β-barrel membrane proteins. (A) External residues. (B) Internal residues. Normalized abundance values are the raw abundance (Fig. 4 ▶, Table 2) divided by the weighted genomic abundance of each amino acid (see text). In addition to the abundance across the whole bilayer, we also show the abundance for each of two bilayer regimes: the hydrocarbon core ±6.5 Å from the bilayer midplane and the bilayer interface between 6.5 and 13.5 Å from the midplane. The line at 1.0 is the expectation value for residues whose abundance equals the expected genomic abundance. Abundance values are ranked, left to right, by the value for the whole bilayer.
Architecture of β-barrels
The goal of this work is to obtain information from known β-barrels that will be useful in characterizing unknown sequences in genome databases. Thus, we also need to explore the architecture and architectural diversity of known structures. The most relevant architectural variable is the rise per residue of the β-strands along the direction normal to the bilayer plane. Simulations have shown that the shear number and tilt angle of β-barrels can vary within certain bounds (Murzin et al. 1994; Sansom and Kerr 1995), as reflected in the known structures. Although the maximum possible rise per residue is about 3.6 Å for a β-strand perpendicular to the bilayer, known structures (Schulz 2000) and theory (Sansom and Kerr 1995) suggest that tilted strands are energetically preferred. We determined the distribution of β-barrel rise per residue values at the bilayer midplane by calculating the value, over the three residues closest to the midplane, for each membrane-spanning strand. The results, shown in Figure 6 ▶, demonstrate the narrow range of variation in known structures. The rise per residue in the database is 2.7 ± 0.25 Å per residue, or about 10 ± 1 residues across the membrane.
Fig. 6.

Histogram of the rise per residue in β-barrel membrane proteins of known structure. For each lipid-exposed β-strand in our database we calculated the rise per residue from the three residues closest to the bilayer midplane. The scale at the top shows a conversion to the number of residues required to span the 27-Å thickness of the membrane.
We also calculated the distribution of loop length in the β-barrels in the database. These data are shown in Figure 7 ▶. In this work, loops are defined as segments between membrane-spanning β-strands that are outside the thickness of the membrane. In other words, more than 13.5 Å from the bilayer midplane. Note that about half of the loops are shorter than six residues, indicating that most membrane-spanning β-strands are connected to at least one other strand by a short loop. This suggests that the β-hairpin is the basic structural building block of β-barrel membrane proteins. As apparent in the example shown in Figure 1 ▶ and in Figure 2A and B ▶, the short and long loops of β-barrel membrane proteins are generally segregated onto opposite sides of the membrane.
Fig. 7.

Histogram of interstrand loop lengths in the known β-barrel membrane proteins. In this measurement, a loop is a count of all the residues between two β-strands that are outside of the bilayer, more than 13.5 Å from the bilayer midplane. The distribution is bimodal, with about 45% of the loops shorter than eight residues and 55% of the loops longer.
Discussion
Uniqueness of membrane β-barrel dyad repeats
Membrane-spanning β-strands, like all β-sheets, have a dyad repeat topology in which alternating residues are oriented toward alternating faces of the sheet. In β-barrel membrane proteins about half of the membrane-spanning residues are hydrophobic residues that are oriented toward the membrane lipids, while the other half are more hydrophilic residues that are oriented towards the interior of the barrel. Several β-barrel identification algorithms have been developed, in part, on the idea that membrane β-barrels could be recognizable through the dyad repeat of hydrophobic (external) and hydrophilic (internal) residues (e.g., Fischbarg et al. 1995). However, difficulties arise when genome databases are screened for β-barrel membrane proteins using this simple idea because the interior of membrane-spanning β-barrels are not necessarily very hydrophilic, and because many soluble β-sheets also have a similar dyad repeat motif in which one hydrophobic face of a sheet is buried and one hydrophilic face is more exposed to the aqueous phase. Our goal in this work was to use the known β-barrels to generate a data set based on the observed abundance of the amino acids and the architecture of β-barrel membrane proteins that will further help to differentiate β-barrel membrane proteins from the abundant amphipathic β-sheets of soluble proteins.
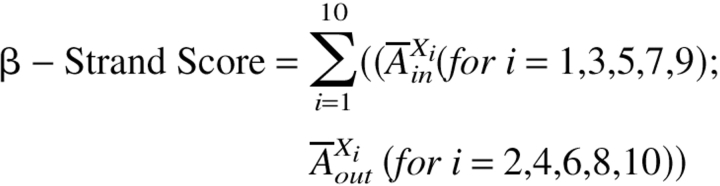
From the strand length distribution shown in Figure 6 ▶ we concluded that a search for a membrane-spanning segment of 10 residues will be able to identify most transmembrane β-strands. We performed a 10-residue sliding window analysis for each protein examined. For each 10-residue sliding window in a protein's amino acid sequence we calculated a "β-strand score" based on the two abundance data sets (interior and exposed) determined for β-barrel membrane proteins (shown in Fig. 5A,B, and listed in Table 2) using
 |
or
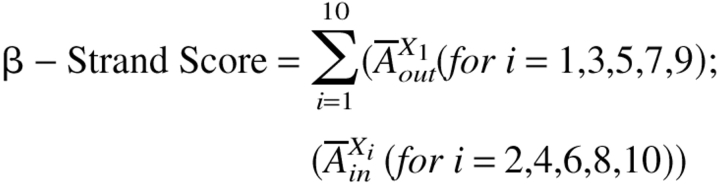 |
whichever is highest, where  Xlin and
  Xlout are ln (relative abundance) values for interior (in) and exterior (out) residues (Table 2) for the ith amino acid in the sliding window. A comparison between the β-strand scores for the membrane-spanning β-strands of β-barrel membrane proteins and the whole E. coli genome (Perna et al. 2001) is shown in Figure 8 ▶. The peak for the β-barrel strands is at approximately 2.5 σ from the center of the genome distribution. This is a good starting point for the distinction of membrane-spanning β-strands in genome databases. We also made the same calculations using a simple dyad repeat of alternating octanol hydrophobicity (Wimley et al. 1996). The results of this comparison, shown in Figure 9 ▶, show that the distinction between membrane-spanning β-strands and the genomic distribution is significantly poorer than for the scores generated with the abundance data of Table 2.
Fig. 8.

Distribution of β-strand scores for the whole Escherichia coli genome (Perna et al. 2001) and for the membrane-spanning β-strands of known β-barrel proteins (Table 1). β-Strand scores reflect the match between the composition of alternating amino acids in an unknown segment and the composition expected from the analysis of known β-barrels. Calculation of β-strand scores is described in the text. Note that the center of the distribution of known β-barrel membrane protein is at about 2.5 σ from the genomic peak.
Fig. 9.

Distribution of alternating hydrophobicity scores for the whole Escherichia coli genome (Perna et al. 2001) and for the membrane-spanning β-strands of known β-barrel proteins (Table 1). Alternating hydrophobicity scores reflect the idea that the residues on the inside and outside of a β-barrel will have a hydrophobic-hydrophilic pattern. Calculation of abundance scores is described in the text. The value cannot be negative because we take the highest positive score of the two possible scores for the 10-residue window. Note that the overlap is much greater than the overlap in Figure 8 ▶, and thus, alternating hydrophobicity is a weaker detection method than the abundance comparison in Figure 8 ▶.
β-barrel profiles
An example of a 10 residue sliding window score profile using the abundance data in Table 2 is shown in Figure 10A ▶. The sequence examined is the membrane-spanning domain of the 22-stranded monomeric β-barrel FhuA from E. coli. The actual membrane-spanning β-strands are shown as solid black bars. For reference, the figure has a gray area between 2 and 6 that covers the range in which most membrane-spanning β-strands are found (see Fig. 8 ▶). Note that the algorithm is successful at identifying most membrane-spanning β-strands, although there are also some false positive peaks. A similar over prediction is encountered for the prediction of transmembrane helices in many hydropathy analyses (Zen et al. 1995; Casadio et al. 1996; Krogh et al. 2001). The results of this analysis were the same if we treated FhuA as an unknown protein and left it out of the abundance calculation.
Fig. 10.

Examples of sliding window scores for the membrane-spanning segment of FhuA, a monomeric 22-stranded β-barrel (Table 1). The actual membrane-spanning strands are shown by the horizontal bars. (A) β-Strand score calculated as described in the text. A membrane-spanning β-strand will have a sharp peak. The gray box represents the area in which most known membrane-spanning β-strands fall. Note that every β-strand in this protein has a corresponding peak in this regime. (B) β-Hairpin score is the sum, in a 25-residue sliding window, of the highest peak in residues 1–10 and the highest peak in residues 15–25. Arrows denote the location of the short turns between known β-strands. Note that most of the β-hairpins in the protein are correctly identified.
To improve the ability to rapidly recognize β-barrels in genome databases and to simplify the sliding window average, we also incorporated the architectural data (Figs. 6 ▶, ▶) into a secondary sliding window calculation that gives a "β-hairpin" score from the β-strand score. The β-hairpin score, as shown in Figure 10B ▶, is the sum, in a 25-residue sliding window, of the highest β-strand score in residues 1–10 and the highest β-strand score in residues 15–25. The β-hairpin score is thus highest when there are two β-strand peaks separated by a short loop. A prototypical β-hairpin with two 10 residue β-strands separated by a five-residue loop (see Figs. 6 ▶, ▶) will give a high, flat peak in this β-hairpin analysis. Note in Figure 10B ▶ that most of the β-hairpins of FhuA are correctly identified in this analysis.
Screening of genomic data
These analyses are being conducted so that we can begin to develop methods for rapidly identifying potential β-barrels in genome databases. Potential β-barrels can then be further analyzed with neural network-based structure prediction algorithms (Gromiha et al. 1997; Jacoboni et al. 2001) and with molecular biology and proteomics tools (Molloy et al. 2000). A rapid genomic screening algorithm requires a simple parameterization or scoring of each protein sequence. One feature we expect to find in all β-barrel membrane proteins is a set of roughly 5 to 15 peaks in the β-hairpin analysis like that in Figure 10B ▶. The number of β-strands or β-hairpins is expected to scale approximately with protein size; thus, in our preliminary genomic analyses we calculated a single β-barrel score for each protein by summing the high peaks as follows:
 |
and we obtained the distribution shown in Figure 11 ▶ for the E. coli genome. We chose a cutoff value of 6 because it correctly identifies ∼90% of the β-hairpins in our structure database, without also including many false peaks (see Fig. 10B ▶). Using this algorithm, we calculated scores for three sets of known β-barrel membrane proteins: known crystal structures used in this work (Table 1), trimeric porins, and TonB-dependent outer membrane receptors. The median genomic score is 0.4, whereas all members of these three sets of β-barrel membrane proteins are found beyond the 85th percentile at 1.0 and many score higher than the 97th percentile score at 2.0. The eight-stranded β-barrel OmpX (Table 1), at 5.5, is the highest scoring protein in the entire E. coli genome.
Fig. 11.

Distribution of β-barrel scores for all proteins in the E. coli genome and in sets of known β-barrel membrane proteins. The known proteins are from three groups: known structures from the protein data bank (Table 1), trimeric porins, and TonB-dependent outer membrane receptors. Note that the known outer membrane proteins have scores that fall well beyond the mean of the E. coli distribution, 0.4.
Using this simple and rapid scoring algorithm we have begun to analyze the whole genomes of Gram-negative bacteria. Here we discuss preliminary results from the genomes of Escherichia coli and Pseudomonas auriginosa as examples. After scoring and ranking all the open reading frames in these two genomes, we examined the 125 highest scoring proteins for each genome. These proteins, which represent about 2.5% of all open reading frames, fall between 1.7 and 5.5 in β-barrel score (Fig. 11 ▶). They have been categorized in Table 3. We find four main classes of proteins in this high-scoring group. Known outer membrane proteins and putative or probable outer membrane proteins, identified by sequence homology, comprise approximately half of the genes in the highest scoring group. This observation strongly supports the idea that this algorithm can accurately detect β-barrel membrane proteins. Unidentified, open reading frames or hypothetical proteins also comprise about half of these highest scoring proteins. It seems very likely that some of these sequences encode for functional β-barrel membrane proteins. Interestingly, we also find a significant number of fimbrial (piliar) proteins, fimbrial usher proteins, adhesin-like proteins, and exoproteins in this highest scoring group. These are all proteins that reside in, or pass through, the outer membrane. Proteins or hypothetical proteins belonging to other classes, such as probable soluble enzymes, comprise only a very small fraction of the high-scoring genes. The complete genomic lists of β-barrel scores are provided as Electronic Supplementary Material to this manuscript.
Table 3.
Analysis of high-scoring proteins in bacterial genomes
| Organism | ||
| Protein classification | Escherichia colia | Pseudomonas aeruginosab |
| Known outer membrane proteinsd | 21c | 22c |
| Putative or probable outer membrane proteins | 39 | 28 |
| Unidentified or hypothetical proteins | 40 | 65 |
| Fimbrial proteins, fimbrial ushers, and adhesins | 16 | 5 |
| Other proteins | 9 | 5 |
a Complete genome of E. coli O157:H7 (Perna et al. 2001). Annotation dated January 25, 2001.
b Complete genome of Pseudomonas aeruginosa AR01 (Stover et al. 2000). Annotation dated August 30, 2000.
c We chose for close examination the 125 proteins that scored the highest in the β-hairpin score. These constitute about 2.5% of the genome and cover scores equal to or higher than ∼1.7, as shown in Figure 11 ▶. The complete genome lists of β-barrel scores are provided as Electronic Supplemental Material to this manuscript.
d Known proteins were those designated in the genome annotation as outer membrane proteins, porins, outer membrane receptors, etc., but without any adjectives such as "probable," "possible," or "putative."
Conclusions
We have analyzed the amino acid composition and architecture of all β-barrel membrane proteins of known structure. These data have been used to develop a simple algorithm for rapidly screening genomes for potential β-barrel membrane proteins. Application of this algorithm to the genomes of the Gram-negative bacteria Escherichia coli and Psedomonas auriginosa has revealed dozens of potential β-barrel membrane proteins that have previously not yet been identified or annotated as such. Future experiments will be directed toward refinement of the screening algorithm and toward application of proteomics methods to determine if the potential β-barrels that we have identified can be expressed as β-barrel membrane proteins in bacterial outer membranes.
Materials and methods
Transformation of PDB coordinates to the bilayer plane
Each protein's XYZ PDB coordinates were transformed to align the "bilayer plane" of the protein with the XY plane of the coordinate system. First, the PDB coordinate file was converted to a kinemage file using PreKin (Richardson and Richardson 1994). With the program Mage (Richardson and Richardson 1994) we viewed the kinemage and used the position of the external aromatics, aliphatics, and charged residues to align each protein with the XY plane. The transformation matrix was obtained from Mage and used in a modified version of the program KinPlot (Wimley et al. 1994) to transform the coordinates and rewrite them in PDB format. The output of this procedure is a PDB format file in which the plane of the bilayer is coincident with the XY plane of the atomic coordinate system. Alignment of the proteins along the z-axis is described in the text. All the software used in this work that is not publicly obtainable is available from the author upon request.
Hydrophobicity profiles
Hydrophobicity profiles were calculated over a 5-Å sliding average window, which was moved across the protein in the bilayer coordinate system along a line normal to the bilayer. The "location" of each residue was taken to be the XYZ coordinates of the β-carbon, or the α-carbon for glycine. We examined the differences that would occur in the locations of long polar side chains, such as lysine, if we instead used the position of the polar side-chain moiety, but we found only small net differences from the position of the β-carbon (∼1 Å or less). The octanol hydrophobicity scale, which has been discussed in detail elsewhere (Wimley et al. 1996; White and Wimley 1998 White and Wimley 1999) is based on the partitioning of peptides of the form AcWL-X-LL into bulk octanol. The scale is less permissive of polar residues, and appears to be a good scale for mimicking the environment of membrane proteins.
Electronic supplemental material
Electronic supplemental material consists of tabulated amino acid abundance data (Table 2) and tables of sorted β-barrel scores for the complete genomes of the two Gram-negative bacteria discussed in the text: Escherichia coli and Pseudomonas aeruginosa. After the file header, the genomic data are given in five columns: β-barrel score (sorted), protein length, number of peaks in the β-hairpin score greater than 4.0 (Fig. 10 ▶), description of the protein in the genome annotation, and the protein's code. File name conventions are as follows: Ecoli.doc: Escherichia coli; Paeruginosa. doc: Pseudomonas aeruginosa.
Acknowledgments
The New Orleans Protein Folding Intergroup is gratefully acknowledged for many invaluable discussions, and we thank Samuel J. Landry and William F. Walkenhorst for critically reading the manuscript. We are indebted to Dr. Harald Engelhardt (Max-Planck Institute for Biochemistry, Munich) for sending the coordinates of Omp32 before their release from the PDB. Funded by NIH (GM60000) and the Louisiana Board of Regents Support Fund 1999-02-RD-A-43.
The publication costs of this article were defrayed in part by payment of page charges. This article must therefore be hereby marked "advertisement" in accordance with 18 USC section 1734 solely to indicate this fact.
Article and publication are at http://www.proteinscience.org/cgi/doi/10.1110/ps.29402
References
- Alm, R.A., Bina, J., Andrews, B.M., Doig, P., Hancock, R.E., and Trust, T.J. 2000. Comparative genomics of Helicobacter pylori: Analysis of the outer membrane protein families. Infect. Immun. 684155–4168. [DOI] [PMC free article] [PubMed] [Google Scholar]
- Altschul, S.F., Gish, W., Miller, W., Myers, E.W., and Lipman, D.J. 1990. Basic local alignment search tool. J. Mol. Biol. 215403–410. [DOI] [PubMed] [Google Scholar]
- Benz, R. 1994. Permeation of hydrophilic solutes through mitochondrial outer membranes: Review on mitochondrial porins. Biochim. Biophys. Acta 1197167–196. [DOI] [PubMed] [Google Scholar]
- Berman, H.M., Westbrook, J., Feng, Z., Gilliland, G., Bhat, T.N., Weissig, H., Shindyalov, I.N., and Bourne, P.E. 2000. The Protein Data Bank. Nucleic Acids Res. 28235–242. [DOI] [PMC free article] [PubMed] [Google Scholar]
- Bishop, C.M., Walkenhorst, W.F., and Wimley, W.C. 2001. Folding of β-sheet membrane proteins: Specificity and promiscuity in peptide model systems. J. Mol. Biol. 309975–988. [DOI] [PubMed] [Google Scholar]
- Buchanan, S.K., Smith, B.S., Venkatramani, L., Xia, D., Esser, L., Palnitkar, M., Chakraborty, R., van der Helm, D., and Deisenhofer, J. 1999. Crystal structure of the outer membrane active transporter FepA from Escherichia coli. Nat. Struct. Biol. 656–63. [DOI] [PubMed] [Google Scholar]
- Casadio, R., Fariselli, P., Taroni, C., and Compiani, M. 1996. A predictor of transmembrane α-helix domains of proteins based on neural networks. Eur. Biophys. J. 24165–178. [DOI] [PubMed] [Google Scholar]
- Cowan, S.W., Garavito, R.M., Jansonius, J.N., Jenkins, J.A., Karlsson, R., Koenig, N., Pai, E.F., Pauptit, R.A., Rizkallah, P.J., Rosenbusch, J.P., Rummel, G., and Schirmer, T. 1995. The structure of OmpF porin in a tetragonal crystal form. Structure 31041–1050. [DOI] [PubMed] [Google Scholar]
- Cowan, S.W., Schirmer, T., Rummel, G., Steiert, M., Ghosh, R., Pauptit, R.A., Jansonius, J.N., and Rosenbusch, J.P. 1992. Crystal structures explain functional properties of two E. coli porins. Nature 358727–733. [DOI] [PubMed] [Google Scholar]
- Dutzler, R., Rummel, G., Alberti, S., Hernandez-Alles, S., Phale, P., Rosenbusch, J., Benedi, V., and Schirmer, T. 1999. Crystal structure and functional characterization of OmpK36, the osmoporin of Klebsiella pneumoniae.Struct. Fold. Design 7425–434. [DOI] [PubMed] [Google Scholar]
- Fischbarg, J., Li, J., Cheung, M., Czegledy, F., Iserovich, P., and Kuang, K. 1995. Predictive evidence for a porin-type β-barrel fold in CHIP28 and other members of the MIP family. A restricted-pore model common to water channels and facilitators. J. Membr. Biol. 143177–188. [DOI] [PMC free article] [PubMed] [Google Scholar]
- Fischer, K., Weber, A., Brink, S., Arbinger, B., Schunemann, D., Borchert, S., Heldt, H.W., Popp, B., Benz, R., and Link, T.A. 1994. Porins from plants. Molecular cloning and functional characterization of two new members of the porin family. J. Biol. Chem. 26925754–25760. [PubMed] [Google Scholar]
- Forst, D., Welte, W., Wacker, T., and Diederichs, K. 1998. Structure of the sucrose-specific porin ScrY from Salmonella typhimurium and its complex with sucrose. Nat. Struct. Biol. 537–46. [DOI] [PubMed] [Google Scholar]
- Gromiha, M.M., Majumdar, R., and Ponnuswamy, P.K. 1997. Identification of membrane spanning β-strands in bacterial porins. Protein Eng. 10497–500. [DOI] [PubMed] [Google Scholar]
- Jacoboni, I., Martelli, P.L., Fariselli, P., De, P.V., and Casadio, R. 2001. Prediction of the transmembrane regions of β-barrel membrane proteins with a neural network-based predictor. Protein Sci. 10779–787. [DOI] [PMC free article] [PubMed] [Google Scholar]
- Jayasinghe, S., Hristova, K., and White, S.H. 2001. Energetics, stability, and prediction of transmembrane helices. J. Mol. Biol. 312927–934. [DOI] [PubMed] [Google Scholar]
- Koronakis, V., Sharff, A., Koronakis, E., Luisi, B., and Hughes, C. 2000. Crystal structure of the bacterial membrane protein TolC central to multidrug efflux and protein export. Nature 405914–919. [DOI] [PubMed] [Google Scholar]
- Kreusch, A. and Schulz, G.E. 1994. Refined structure of the porin from Rhodopseudomonas blastica. Comparison with the porin from Rhodobacter capsulatus.J. Mol. Biol. 243891–905. [DOI] [PubMed] [Google Scholar]
- Krogh, A., Larsson, B., von Heijne, G., and Sonnhammer, E.L. 2001. Predicting transmembrane protein topology with a hidden Markov model: Application to complete genomes. J. Mol. Biol. 305567–580. [DOI] [PubMed] [Google Scholar]
- Locher, K.P., Rees, B., Koebnik, R., Mitschler, A., Moulinier, L., Rosenbusch, J.P., and Moras, D. 1998. Transmembrane signaling across the ligand-gated FhuA receptor: Crystal structures of free and ferrichrome-bound states reveal allosteric changes. Cell 95771–778. [DOI] [PubMed] [Google Scholar]
- Meyer, J.E.W., Hofnung, M., and Schulz, G.E. 1997. Structure of maltoporin from Salmonella typhimurium ligated with a nitrophenyl-maltotrioside. J. Mol. Biol. 266761–775. [DOI] [PubMed] [Google Scholar]
- Molloy, M.P., Herbert, B.R., Slade, M.B., Rabilloud, T., Nouwens, A.S., Williams, K.L., and Gooley, A.A. 2000. Proteomic analysis of the Escherichia coli outer membrane. Eur. J. Biochem. 2672871–2881. [DOI] [PubMed] [Google Scholar]
- Murzin, A.G., Lesk, A.M., and Chothia, C. 1994. Principles determining the structure of β-sheet barrels in proteins: I. A theoretical analysis. J. Mol. Biol. 2361369–1381. [DOI] [PubMed] [Google Scholar]
- Pautsch, A. and Schulz, G.E. 1998. Structure of the outer membrane protein A transmembrane domain. Nat. Struct. Biol. 51013–1017. [DOI] [PubMed] [Google Scholar]
- Perna, N.T., Plunkett III, G., Burland, V., Mau, B., Glasner, J.D., Rose, D.J., Mayhew, G.F., Evans, P.S., Gregor, J., Kirkpatrick, H.A., Posfai, G., Hackett, J., Klink, S., Boutin, A., Shao, Y., Miller, L., Grotbeck, E.J., Davis, N.W., Lim, A., Dimalanta, E.T., Potamousis, K.D., Apodaca, J., Anantharaman, T.S., Lin, J., Yen, G., Schwartz, D.C., Welch, R.A., and Blattner, F.R. 2001. Genome sequence of enterohaemorrhagic Escherichia coli O157:H7. Nature 409529–533. [DOI] [PubMed] [Google Scholar]
- Richardson, D.C. and Richardson, J.S. 1994. Kinemages: Simple macromolecular graphics for interactive teaching and publication. Trends Biochem. Sci. 19135–138. [DOI] [PubMed] [Google Scholar]
- Rost, B., Casadio, R., Fariselli, P., and Sander, C. 1995. Transmembrane helices predicted at 95% accuracy. Protein Sci. 4521–533. [DOI] [PMC free article] [PubMed] [Google Scholar]
- Saier Jr., M.H. 2000. Families of proteins forming transmembrane channels. J. Membr. Biol. 175165–180. [DOI] [PubMed] [Google Scholar]
- Sansom, M.S.P. and Kerr, I.D. 1995. Transbilayer pores formed by β-barrels: Molecular modeling of pore structures and properties. Biophys. J. 691334–1343. [DOI] [PMC free article] [PubMed] [Google Scholar]
- Schiffer, M., Chang, C.H., and Stevens, F.J. 1992. The functions of tryptophan residues in membrane proteins. Protein Eng. 5213–214. [DOI] [PubMed] [Google Scholar]
- Schirmer, T. and Cowan, S.W. 1993. Prediction of membrane-spanning β-strands and its application to maltoporin. Protein Sci. 21361–1363. [DOI] [PMC free article] [PubMed] [Google Scholar]
- Schulz, G.E. 2000. β-Barrel membrane proteins. Curr. Opin. Struct. Biol. 10443–447. [DOI] [PubMed] [Google Scholar]
- Seshadri, K., Garemyr, R., Wallin, E., von Heijne, G., and Elofsson, A. 1998. Architecture of β-barrel membrane proteins: Analysis of trimeric porins. Protein Sci. 72026–2032. [DOI] [PMC free article] [PubMed] [Google Scholar]
- Snijder, H.J., Ubarretxena-Belandia, I., Blaauw, M., Kalk, K.H., Verheij, H.M., Egmond, M.R., Dekker, N., and Dijkstra, B.W. 1999. Structural evidence for dimerization-regulated activation of an integral membrane phospholipase. Nature 401717–721. [DOI] [PubMed] [Google Scholar]
- Song, L., Hobaugh, M.R., Shustak, C., Cheley, S., Bayley, H., and Gouaux, J.E. 1996. Structure of staphylococcal α-hemolysin, a heptameric transmembrane pore. Science 2741859–1866. [DOI] [PubMed] [Google Scholar]
- Stover, C.K., Pham, X.Q., Erwin, A.L., Mizoguchi, S.D., Warrener, P., Hickey, M.J., Brinkman, F.S., Hufnagle, W.O., Kowalik, D.J., Lagrou, M., Garber, R.L., Goltry, L., Tolentino, E., Westbrock-Wadman, S., Yuan, Y., Brody, L.L., Coulter, S.N., Folger, K.R., Kas, A., Larbig, K., Lim, R., Smith, K., Spencer, D., Wong, G.K., Wu, Z., and Paulsen, I.T. 2000. Complete genome sequence of Pseudomonas aeruginosa PA01, an opportunistic pathogen. Nature 406959–964. [DOI] [PubMed] [Google Scholar]
- Vogt, J. and Schulz, G.E. 1999. The structure of the outer membrane protein OmpX from Escherichia coli reveals possible mechanisms of virulence. Struct. Fold. Design 71301–1309. [DOI] [PubMed] [Google Scholar]
- von Heijne, G. 1994. Membrane proteins: From sequence to structure. Annu. Rev. Biophys. Biomol. Struct. 23167–192. [DOI] [PubMed] [Google Scholar]
- von Heijne, G. 1996. Prediction of transmembrane protein topology. In Protein structure prediction (eds. M.J.E. Sternberg), pp. 101–110. Oxford University Press, Oxford.
- Weiss, M.S. and Schulz, G.E. 1992. Structure of porin refined at 1.8 Å resolution. J. Mol. Biol. 227493–509. [DOI] [PubMed] [Google Scholar]
- White, S.H. and Wimley, W.C. 1998. Hydrophobic interactions of peptides with membrane interfaces. Biochim. Biophys. Acta 1376339–352. [DOI] [PubMed] [Google Scholar]
- ———. 1999. Membrane protein folding and stability: Physical principles. Annu. Rev. Biophys. Biomol. Struct. 28319–365. [DOI] [PubMed] [Google Scholar]
- Wiener, M.C. and White, S.H. 1992. Structure of a fluid dioleoylphosphatidylcholine bilayer determined by joint refinement of X-ray and neutron diffraction data. III. Complete structure. Biophys. J. 61434–447. [DOI] [PMC free article] [PubMed] [Google Scholar]
- Wimley, W.C., Creamer, T.P., and White, S.H. 1996. Solvation energies of amino acid sidechains and backbone in a family of host–guest pentapeptides. Biochemistry 355109–5124. [DOI] [PubMed] [Google Scholar]
- Wimley, W.C., Selsted, M.E., and White, S.H. 1994. Interactions between human defensins and lipid bilayers: Evidence for the formation of multimeric pores. Protein Sci. 31362–1373. [DOI] [PMC free article] [PubMed] [Google Scholar]
- Yau, W.M., Wimley, W.C., Gawrisch, K., and White, S.H. 1998. The preference of tryptophan for membrane interfaces. Biochemistry 3714713–14718. [DOI] [PubMed] [Google Scholar]
- Zen, K.H., Consler, T.G., and Kaback, H.R. 1995. Insertion of the polytopic membrane protein lactose permease occurs by multiple mechanisms. Biochemistry 343430–3437. [DOI] [PubMed] [Google Scholar]
- Zeth, K., Diederichs, K., Welte, W., and Engelhardtm H. 2000. Crystal structure of Omp32, the anion-selective porin from Comamonas acidovorans, in complex with a periplasmic peptide at 2.1 A resolution. Struct. Fold. Design 8981–992. [DOI] [PubMed] [Google Scholar]