

Abstract
Previous studies have shown that many arachidonic acid metabolites bind to human serum albumin (HSA) and that the metabolism of these molecules is altered as a result of binding. The present study attempted to gain insights into the mechanisms by which prostaglandins bound to subdomain 2A of HSA are metabolized by catalytic processes. The breakdown of the prostaglandin 15-keto-PGE2 to 15-keto-PGA2 and 15-keto-PGB2 in the presence of wild-type HSA and a number of subdomain 2A mutants was examined using a previously validated spectroscopic method which monitors absorbance at 505 nm. The species examined using this method were wild-type HSA, K195M, K199M, F211V, W214L, R218M, R218P, R218H, R222M, H242V, R257M, and bovine serum albumin. Previous studies of HSA-mediated catalysis indicated that the breakdown of HSA-bound prostaglandins results from an alkaline microenvironment in the binding site. Our results show that the catalytic breakdown of HSA-bound 15-keto-PGE2 to 15-keto-PGB2 results from two specific processes which are modulated by specific amino acid residues. Specifically, some amino acid residues modulate the rate of step 1, the conversion of 15-keto-PGE2 to 15-keto-PGA2, while other residues modulate the rate of step 2, the conversion of 15-keto-PGA2 to 15-keto-PGB2. Some residues modulate the rate of steps 1 and 2. In total, while our results support the involvement of certain basic amino acid residues in the catabolism of HSA-bound 15-keto-PGE2, our data suggest that metabolism of HSA-bound prostaglandins may be a more complex and specific process than previously thought.
Keywords: Human serum albumin, prostaglandins, catalysis, binding site, site-directed mutagenesis
The structures of the first two prostaglandins, prostaglandins E1 and F1 (PGE1 and PGF1) were elucidated in 1962. As more prostaglandins were discovered it soon became clear that they all shared a similar chemical structure, namely they were 20-carbon unsaturated carboxylic acids with a cyclopentane ring, all of which were derived from the precursor arachidonic acid. It was soon found that arachidonic acid was a precursor for other chemically related biologically active molecules such as prostacyclin (PGI2), thromboxanes, and leukotrienes. For a more complete background and synthesis pathways showing the interrelationships among the above compounds, the reader is referred to the pharmacology text by Campbell and Halushka (1996).
The general instability of prostaglandins and related compounds in aqueous media has complicated attempts to unravel the many biological roles played by these highly active signaling molecules. It became apparent early on in prostaglandin research that proteins in the blood might play an important role in modulating the biological activities of these compounds by binding to and stabilizing or destabilizing certain prostaglandins. A series of binding studies using radiolabeled PGE1, PGE2, PGA2, and PGF2 found that the only plasma protein that significantly binds to the above prostaglandins is human serum albumin (HSA) (Raz 1972). Although the affinity of HSA for a variety of biologically active arachidonic acid metabolites is relatively low (Kd = 10−5 M) (Unger 1972; Gueriguian 1976), the high serum HSA concentration (40 g/L) makes these interactions physiologically significant. For example, one study showed that HSA catalyzes the conversion of prostaglandin H2 (PGH2), a precursor of thromboxane A2 (TXA2), a stimulator of platelet aggregation to prostaglandin D2 (PGD2), an inhibitor of platelet aggregation (Watanabe et al. 1982). HSA has also been shown to stabilize PGI2 (Wynalda and Fitzpatrick 1980), another unstable but potent inhibitor of platelet aggregation derived from PGH2. However, HSA stabilizes the potent stimulant of irreversible platelet aggregation TXA2 (Folco et al. 1977), enhancing its activity. In addition, HSA binds to leukotriene A4 (LTA4) (Fitzpatrick et al. 1981), the unstable precursor of most leukotrienes, preventing its rapid nonenzymatic degradation to biologically inactive metabolites in aqueous media.
A number of competitive binding studies with warfarin and other site I ligands have shown that the above interactions of HSA with arachidonic acid metabolites (Folco et al. 1977; Fitzpatrick and Wynalda 1981; Fitzpatrick et al. 1984) occurs at ligand binding site I on HSA; that is, the effect of HSA on metabolism of the above arachidonic acid metabolites can be eliminated by adding high concentrations of ligands that compete for binding to site I, but not by ligands that bind to other sites on HSA. X-ray crystallographic studies (He and Carter 1992; Carter and Ho 1994; Curry et al. 1998; Peptitas et al. 2001) and experiments with recombinantly produced HSA fragments (Dockal et al. 1999, 2000) showed that ligand-binding site I on HSA is located in subdomain 2A. Although HSA enhances the activity of both inhibitors and stimulators of platelet aggregation, it should be noted that a number of studies revealed that the overall effect of HSA on platelet aggregation is strongly inhibitory (Silver et al. 1973; Remuzzi et al. 1979). In light of the many epidemiological studies that have found a strong inverse correlation between serum HSA concentration and risk of death from cardiovascular disease (Gillum and Makuc 1992; Goldwasser and Feledman 1997; Gillum 2000), one might propose that prostaglandin/HSA interactions play an important role in the development of coronary heart disease.
The present study was based on a previous investigation which found that the half-life of PGD2, PGE1, PGE2, 6-keto-PGE1, and 15-keto-PGE2 were reduced in the presence of HSA, relative to their half-lives in aqueous buffer at pH 7.4 (Fitzpatrick and Wynalda 1981). By comparing the breakdown products obtained for the above prostaglandins in the presence of HSA to those obtained at various pH values, those authors concluded that all of the above prostaglandins bind to the same site on HSA which has an alkaline microenvironment with a local pH greater than or equal to 10.0. Those authors proposed that this alkaline microenvironment in the HSA/prostaglandin binding site is responsible for the accelerated breakdown of these prostaglandins in the presence of HSA.
The above hypothesis is consistent with the large number of basic and hydrophobic amino acid residues protruding into the subdomain 2A-binding pocket. By comparing the half-lives of PGE2 and PGD2 in the presence of albumin from various mammalian species, an important observation was made (Fitzpatrick and Wynalda 1981). The relative effects of each albumin species on the half-lives of PGE2 and PGD2 were similar; that is, those albumin species which caused the greatest reduction in the half-life of PGE2 also caused the greatest reduction in the half-life of PGD2. Similarly, those albumin species which caused the smallest reduction in the half-life of PGE2 also showed the smallest reduction in the half-life of PGD2. In total, the above results suggested a similar mechanism for the breakdown of PGD2 and PGE2, strengthening the idea that a similar mechanism may be involved in the breakdown of all the prostaglandins listed above.
In the above study, the breakdown of prostaglandins bound to HSA was monitored using high-performance liquid chromatography (HPLC) with ultraviolet spectrophotometric detection. A further study which measured the breakdown products obtained from 15-keto-PGE2 incubated with HSA by similar methodology and by a visible spectrophotometric method (Fitzpatrick et al. 1984) found that both methods gave the same reaction rates. Namely, the breakdown of 15-keto-PGE2 leads to the formation of a keto-enol tautomer intermediate with a peak absorbance at 505 nm (Fig. 1 ▶). Thus, one can monitor the rate at which HSA catalyzes the breakdown of 15-keto-PGE2 to the keto-enol tautomeric hybrid, which is formed instantaneously from 15-keto-PGA2 by monitoring absorbance at 505 nm. This study found that albumin from different species had markedly different effects on the breakdown of 15-keto PGE2 (Fitzpatrick et al. 1984), suggesting that subtle changes in the subdomain 2A binding site, that is, amino acid substitutions, could alter the catalytic rate for 15-keto PGE2 breakdown to the keto-enol tautomers and ultimately to 15-keto-PGB2 (Fig. 1 ▶). Unfortunately, the many amino acid differences among species makes it difficult to draw specific structural conclusions about reaction mechanism from the above data.
Fig. 1.

Diagram showing the proposed mechanism by which 15-keto-PGE2 is converted to 15-keto-PGB2 (Fitzpatrick et al. 1984). The spectroscopic assay employed in the present study monitors the formation of the keto-enol tautomeric hybrid of 15-keto-PGA2, which absorbs light at 505 nm.
Our present study was undertaken to obtain insights into the above HSA/prostaglandin interaction by comparing the rate at which specific site-directed mutants of HSA with substitutions in subdomain 2A catalyze the breakdown of 15-keto-PGE2 to the keto-enol tautomer intermediate and to the final reaction product PGB2. Since the spectroscopic assay technique which monitors absorbance at 505 nm was well validated in a previous study (Fitzpatrick et al. 1984) and is inexpensive and technically easy to carry out, we chose it to assay various subdomain 2A mutants for their ability to convert 15-keto-PGE2 to the keto-enol tautomers. The following recombinant HSA species were studied: wild-type recombinant (wtrHSA), K195M, K199M, F211V, W214L, R218M, R218H, R218P, R222M, H242V, and R257M. Recombinantly produced fragments corresponding to domains I, II, and III of HSA were also produced and assayed in a manner identical to full-length HSA.
Results
A 26-h time course showing absorbance at 505 nm, which corresponds to the amount of keto-enol tautomer as a function of time, is shown as Figure 2 ▶. As expected, the rate at which 15-keto-PGE2 is converted to the keto-enol tautomers is insignificant in the absence of albumin. Our control with BSA showed that wild-type BSA was much less efficient than wild-type HSA in catalyzing keto-enol tautomer formation, a result expected from a previous study (Fitzpatrick et al. 1984). Most mutations in subdomain 2A had a significant effect on the kinetics of keto-enol tautomer formation (Fig. 2 ▶). The analysis of the time course for keto-enol tautomer formation is complicated by the fact that the keto-enol tautomeric hybrid decays to 15-keto PGB2 (a species which does not absorb light) at a significant rate as the concentration of the keto-enol tautomers builds up (Fig. 1 ▶). Based on the observation that the rate of increase in absorbance at 505 nm is linear until 2 h after the start of the reaction for all HSA species, the following approximation was made. We assumed that within 1 h after the start of the reaction, the rate of formation of 15-keto PGB2 was insignificant because only a very small amount of its precursor, the keto-enol tautomers, had been formed. We also assumed that the concentration of the HSA substrate 15-keto-PGE2 did not change significantly during this time period. It should be noted that the formations of 15-keto-PGA2 and its keto-enol tautomers occur simultaneously when 15-keto-PGE2 decomposes in the presence of HSA. The above assumptions allowed us to calculate an approximate relative rate constant for the formation of the keto-enol tautomers for each species from the absorbance at 505 nm after 1 h as follows. The absorbance at 505 nm after 1 h determined for wild-type HSA was set equal to 1. The normalized rate constants for all other HSA species are equal to (A505nm at 1 h) / (A505nm at 1 h of wild-type HSA). All experiments were done three times, and the relative rate constants shown are the average of three determinations. The approximate relative rate constants calculated for keto-enol tautomer formation for K195M, K199M, F211V, W214L, R218M, R218P, R218H, R222M, H242V, and R257M were 1.07, 0.51, 0.46, 1.77, 0.40, 0.52, 0.36, 1.59, 1.17, and 0.15, respectively (Table 1). By visual inspection of Figure 2 ▶ it is clear that specific mutations affect the rate at which the keto-enol tautomer is converted to 15-keto-PGB2. For example, for some HSA species, the A505nm reaches a peak and then only decreases slightly, while for other species the A505nm reaches a peak and then drops rapidly, indicating that after a certain time period the rate of 15-keto-PGB2 formation significantly exceeds the rate of keto-enol tautomer formation for some HSA mutants. We estimated the values for step 2 (Table 1) using nonlinear regression assuming a two-step model:
Fig. 2.


Effects of albumin species on 15-keto-PGE2 catalysis. All three panels show the absorbance at 505 nm of a cuvette containing a particular albumin species or wild-type HSA fragment and the same initial amount of 15-keto-PGE2 on the ordinate. The incubation time of 15-keto-PGE2 with a particular albumin species is shown on the abscissa in hours. (A) Wild-type recombinant HSA (wtrHSA), F211V, K199M, R218P, R218H, R218M, and R257M. (B) wtrHSA, K195M, W214L, R222M, H242V and BSA. (C) Recombinant fragments corresponding to Domains I, II, and III of HSA, and BSA.
Table 1.
Relative rate constants for step 1 and for step 2
| Albumin species | Step 1 | Step 2 |
| wtrHSA | 1.0 | 1.0 |
| F211V | 0.46 | 1.1 |
| K199M | 0.51 | 2.1 |
| R218P | 0.52 | 2.2 |
| R218H | 0.36 | 1.4 |
| R218M | 0.40 | 1.9 |
| R257M | 0.15 | 3.1 |
| H242V | 1.17 | 0.24 |
| K195M | 1.07 | 0.32 |
| W214L | 1.77 | 1.1 |
| R222M | 1.59 | 1.1 |
The values for wild-type recombinant (wtrHSA) are taken as unity. The values for step 1 are calculated based on initial rate, whereas the values for step 2 are derived by nonlinear regression assuming a two-step model: 15-keto-PGE2 → chromophore (enol tautomeric hybrid) → 15-keto-PGB2.
15-keto-PGE2 → chromophore (enol tautomeric hybrid) → 15-keto-PGB2.
Based on the 95% confident intervals, the computed values for step 2 are comparable to those for step 1 with regard to reliability. The values for step 1 obtained by regression (data not shown) agree well with those obtained by the simple calculation based on the data for the first h of reaction.
Domain II caused significant formation of the keto-enol tautomers, while domains I and III showed virtually no color formation (Fig. 2C ▶). BSA showed an initial rate about one-third that of domain II. The normalized rate constant observed for domain II relative to a wild-type HSA was about 0.1. The above result is important in two ways. First, it suggests that prostaglandins and related arachidonic acid metabolites bind to the ligand-binding site located in subdomain 2A of HSA, a result indicated by a large amount of previous circumstantial evidence, that is, competitive binding studies and x-ray crystallography. Secondly, the above result shows that some of the subdomain 2A binding site structure is maintained in a domain II fragment, independently of domains I and III. However, the reduced catalytic rate observed for domain II suggests that domains I and III play some role in stabilizing the native structure of the subdomain 2A prostaglandin-binding site.
Discussion
Interestingly, R218M, R218H, and R218P all gave reduced catalytic rates (Fig. 2B ▶) for formation of the keto-enol tautomer relative to wild-type HSA. For all three of the above HSA species, the peak A505nm value and initial rate of keto-enol tautomer formation were about 50% of that observed for wild-type HSA. Peak A505nm values were reached by about 10 h and were relatively constant until the end of the 26-h incubation, indicating an approximate steady state after 10 h, when the rates of 15-keto-PGB2 formation and keto-enol tautomer formation are approximately equal. The peak A505nm values for all three species were about half of the peak A505nm for wild-type HSA. Since R218P and R218H are fairly common naturally occurring HSA species, these results could be physiologically important; that is, prostaglandin metabolism could be significantly altered in patients with these genotypes. One study estimated a prevalence of 0.17% in the general population for familial dysalbuminemic hyperthyroxinemia (Arevalo 1991), the clinical condition resulting from plasma albumin with the R218H or R218P genotype. R257M and K199M displayed normalized rate constants of 0.15 and 0.51, respectively for keto-enol tautomer formation. It should be noted that all of the substitutions described above result in the loss of a specific basic residue in subdomain 2A, either arginine or lysine, and all substitutions significantly reduced the rate of keto-enol tautomer formation.
K195M and H242V showed only slightly increased rates over wild-type HSA for keto-enol tautomer formation, 1.07 and 1.17, respectively (Fig. 2B ▶). However, both species have peak A505nm values almost twice that of wild-type HSA. For wild-type HSA, the A505nm reaches a peak at about 8 h. After 16 h, the A505nm for wild-type HSA steadily decreases, indicating that the rate of 15-keto-PGB2 formation exceeds the rate of keto-enol tautomer formation after 16 h. For K195M and H242V, the A505nm increases until 16 h and decreases only slightly after 16 h. Such a result would be consistent with the following explanation. Although the initial rates of keto-enol tautomer formation for K195M and H242V are only slightly elevated over those of wild-type HSA, a decrease in the rate of 15-keto-PGB2 formation for K195M and H242V relative to the rate of 15-keto-PGB2 formation for wild-type HSA results in a much higher peak A505nm value for these two species.
F211V shows a decreased rate for keto-enol tautomer formation with a normalized rate of 0.46. The origin of this effect is unclear, but could be related to specific binding interactions between F211 and 15-keto-PGE2. R222M and W214L exhibit initial rates for keto-enol tautomer formation of 1.59 and 1.77, respectively. Both species reach peak A505nm values about 30% greater than the peak A505nm value for wild-type HSA. However, the A505nm values for R222M and W214L at 26 h are actually lower than those observed for wild-type HSA at 26 h, due to a more rapid drop in A505nm for R222M and W214L compared to wild-type HSA from 6 to 26 h. The above result can be explained as follows. Although the initial rate of keto-enol tautomer formation is greater for R222M and W214L than for wild-type HSA, the rate of formation of 15-keto-PGB2 for R222M and W214L is also greater than for wild-type HSA. Thus, as the concentration of the keto-enol tautomeric hybrid rises, increased 15-keto-PGB2 formation lowers the keto-enol tautomer concentration more rapidly for R222M and W214L than for wild-type HSA.
In order to reconcile our results with previous studies, which attempt to explain the effect of HSA on prostaglandin metabolism, it is necessary to examine these previous studies in some detail. The majority of previous work supports the idea that prostaglandins bound to HSA are exposed to an alkaline microenvironment with a pH greater than or equal to 10.0. In most previous work, reaction products obtained by incubating various prostaglandins at various pH values were compared to those obtained by incubating prostaglandins with wild-type HSA. Evidence from some of the most convincing studies follows. Two studies found that 13,14-dihydro-15-keto-PGE2 degraded in the presence of HSA to a unique bicyclo rearrangement product that can only be formed in buffers with a pH of approximately 10.0 or greater (Fitzpatrick et al. 1980; Granstrom et al. 1980). Another study found that albumin stabilizes PGI2, which rapidly decomposes in aqueous buffer at neutral pH (Cho and Allen 1978). PGI2 is stabilized in buffers with a pH of approximately 10.0 or greater, because alkaline conditions stabilize a labile vinyl ether group that is part of PGI2. For aqueous buffers, the pH-dependent decomposition of PGE1 and PGE2 has been well studied (Monkhouse et al. 1973; Thompson et al. 1973; Stehle and Oesterling 1977). The main products of decomposition result from dehydration and are A- or B-type prostaglandin. The rate of decomposition increases at pH values below 2.0 and above 7.4. Between pH 2.0 and 7.4, the rate of decomposition of PGE1 and PGE2 is slower than at pH 7.4. Below pH 2.0, conversion of PGA1 into PGB1 does not occur in aqueous buffer. However, in alkaline buffers, PGA1 and PGB1 are both formed from PGE1. Based on the rate at which PGA1 and PGB1 are formed from PGE1 in the presence of HSA in an aqueous buffer at pH 7.4, previous authors concluded that PGE1 and related prostaglandins bind to a site on HSA which has a local microenvironment with a pH of 10.0 or greater (Monkhouse et al. 1973; Thompson et al. 1973; Stehle and Oesterling 1977). In total, previous studies attribute the effects of subdomain 2A on prostaglandin metabolism to a general property of the binding site, namely, alkalinity, ignoring the complexity of the binding site and suggesting that the effect of HSA binding on prostaglandin metabolism is to some extent nonspecific. The large number of structurally dissimilar ligands which bind to subdomain 2A of HSA has contributed to the idea that HSA/ligand interactions are not due to detailed binding site structure and has led to many theories of ligand binding to HSA such as that described above which lack mechanistic specificity. Our results do not conflict with the above studies in that they suggest a base-catalyzed process for the conversion of 15-keto-PGE2 to 15-keto-PGB2. However, our data suggest that the process is more complex and specific than previously thought.
First, the catalytic conversion of HSA-bound 15-keto-PGE2 to 15-keto-PGB2 is a process involving two specific steps, the first step being the formation of 15-keto-PGA2, which is converted rapidly to its keto-enol tautomers, and the second step being the conversion of the keto-enol tautomers to 15-keto-PGB2. These processes shall hereafter be referred to as step 1 and step 2, respectively. The rate of each step appears to be altered independently by specific amino acid substitutions. For example, the mutants K195M and H242V display slight increases in the rate of step 1, but decreases in the rate of step 2. R222M and W214L display an increase in the rate of both step 1 and step 2.
Decreases in the rate of keto-enol tautomer formation observed for R218M, R218P, R218H, K199M, and R257M would be consistent with previous theories which hold that an alkaline microenvironment in subdomain 2A is responsible for the breakdown of 15-keto-PGE2 and related prostaglandins. However, such a theory is contradicted by other information. For example, the mutant F211V displays a decreased rate for step 1, but the alkalinity of subdomain 2A would not be altered by such a substitution. Likewise, R222M shows increased rates for steps 1 and 2, but such a substitution would be expected to increase the alkalinity of subdomain 2A. In addition, W214L shows increased rates for steps 1 and 2, but such a substitution would not be expected to change the alkalinity of subdomain 2A.
Our results suggest that R218, R257, and K199 could play an important role in catalyzing the conversion of 15-keto-PGE2 to 15-keto-PGA2 and its keto-enol tautomers. In our model, any of the above residues could be located in close proximity to carbon 10 on 15-keto-PGE2. Since the guanidino and amino groups on arginine and lysine, respectively, are strong bases, they could abstract a proton from carbon 10. Loss of the OH− group on the adjacent carbon atom (carbon 11) would result in a base-catalyzed dehydration reaction similar to that which occurs at high OH− concentrations. Thus, under alkaline conditions (pH 10), the reaction would be catalyzed by abstraction of a proton from carbon 10 by OH−, whereas for HSA-bound 15-keto-PGE2, the reaction would be catalyzed by basic amino acid residues located near carbon 10. The reduction in the rate of step 2, the conversion of the keto-enol tautomers to 15-keto-PGB2 observed for H242V and K195M, could be explained by the following mechanisms. K195 and/or H242 could abstract a proton from carbon 8. Alternatively, H242 could exert its effect on the rate of step 2 by modulating the pKa of K199. A previous study suggested that the pKa of K199 is decreased to 7.9 in the presence of H242, which acts as proton acceptor (Gerig and Reinheimer 1975; Carter and Ho 1994). The increased rates for steps 1 and 2 observed for R222M and W214L are more difficult to explain, but are likely to result from a tighter binding of 15-keto-PGE2 to the subdomain 2A binding site and/or conformational changes which result in a better fit between enzyme and substrates for optimal catalysis. Clearly, R222 is not likely to be a proton acceptor in the catalytic mechanisms described above. In the X-ray structure of unliganded HSA, R222 protrudes into the center of subdomain 2A and could potentially block the binding of 15-keto-PGE2 by steric hindrance. The reduction in the rate of catalysis observed for F211V could result from reduced binding and/or a fit between substrate and catalyst less optimal than that of wild-type HSA. In total, the breakdown of HSA-bound 15-keto-PGE2 appears quite sensitive to subdomain 2A mutations. The present study gives two examples of naturally occurring substitutions which could affect prostaglandin metabolism. Based on our findings, it appears possible that other as yet undiscovered naturally occurring subdomain 2A substitutions could alter HSA-mediated prostaglandin metabolism, potentially impacting cardiovascular mortality.
Recent work is demonstrating the importance of specific amino acid residues for certain HSA/ligand interactions (Petersen et al. 1996, 1997, 2000). The present study continues that trend by demonstrating the specificity and complexity of the interaction between HSA and the model prostaglandin 15-keto-PGE2. X-ray crystallographic studies which examine interactions between subdomain 2A mutants of HSA and model analogs of arachidonic acid metabolites will be needed to unravel the many complexities of the interactions between HSA and prostaglandins. We hope that our present findings provide motivation for this future work.
Materials and methods
Synthesis and purification of recombinant HSA
Introduction of mutations into the HSA coding region
Specific mutations were introduced into the HSA coding region in a plasmid vector containing the entire HSA coding region (pHiL-D2 HSA) using standard techniques as described (Petersen et al. 1996, 1997, 2000).
Expression of recombinant HSA
Each pHiL-D2 HSA expression cassette coding for a particular HSA mutant was introduced into the yeast species Pichia pastoris by electroporation. A yeast clone which contained the expression cassette stably integrated into the chromosomal DNA was isolated in each case.
Verification of the DNA sequence of HSA clones
The total genomic DNA from each Pichia pastoris clone used to produce a particular HSA species was isolated using standard techniques. The genomic DNA isolated from each clone was used as a template to amplify the entire HSA coding region by PCR. For each clone, the entire HSA coding region was sequenced using the dideoxy nucleic acid chain termination technique, and the translation product corresponding to this sequence was found to match a previously published HSA sequence at all amino acid positions except for the mutation introduced into a particular HSA mutant.
Purification of recombinant HSA
The secreted HSA was isolated from growth media as follows. The medium was brought to 50% saturation with ammonium sulfate at room temperature. The temperature was then lowered to 4°C, and the pH was lowered to 4.4, the isoelectric point of HSA. The precipitated protein was collected by centrifugation and resuspended in distilled water. Dialysis was carried out for 72 h against 100 volumes of phosphate-buffered saline (PBS), 137 mM NaCl, 2.7 mM KCl, 4.3 mM Na2HPO4, 1.4 mM KH2PO4, pH 7.4 with one change of buffer. The solution was loaded onto a column of Cibacron Blue immobilized on Sepharose 6B (Sigma, St. Louis, MO). After the column was washed with 10 bed volumes of PBS, HSA was eluted with 3 M NaCl. The eluent was dialyzed against PBS and passed over a column of Lipidex-1000 (Packard Instruments) to remove hydrophobic ligands possibly bound to HSA (Glatz and Veerkamp 1983). The resulting protein exhibited only one band on SDS-PAGE. Protein concentrations were determined by the BCA method, a modification of the Lowry procedure in which bichromic acid is substituted for tartrate.
Synthesis and purification of recombinant HSA fragments
We used a protocol which was a modification of a previously published technique to express and purify domains I, II, and III of HSA (Dockal et al. 1999). The specifics of our methodology follow.
Cloning of coding regions for domains I, II, and III
Using pHilD-2 HSA as the template, the following three sets of DNA oligonucleotides were used to amplify each HSA domain by PCR.
Domain I (amino acid positions 1–197)
5` DNA primer: 5` GTATCTCTCGAGAAAAGAGAGGCT GAAGCTGATGCACACAAGAGTGAGG 3`
3` DNA primer: 5` GCGGTGAGCGAATTCTTATCTCT GTTTGGCAGACGAAG 3`
Domain II (amino acid positions 189–385)
5` DNA primer: 5` GTATCTCTCGAGAAAAGAGAGGCT GAAGCTGGGAAGGCTTCGTCTGCCAAACAG 3`
3` DNA primer: 5` GCGGTGAGCGAATTCTTACTGAG GCTCTTCCACAAGAGG 3`
Domain III (amino acid positions 381–585)
5` DNA primer: 5` GTATCTCTCGAGAAAAGAGAGGCT GAAGCTGTGGAAGAGCCTCAGAATTTAATC 3`
3` DNA primer: 5` GCGGTGAGCGAATTCTTATAAGCCTA AGGCAGCTTGAC 3`
All amplified fragments were digested with the DNA restriction enzymes XhoI and EcoRI. It should be noted that the DNA fragment corresponding to domain III was only partially digested with XhoI because it contained an internal XhoI site. A DNA fragment containing full-length domain III was isolated from the partial digest with XhoI and used for EcoRI digestion and cloning. The yeast expression vector pPIC9, which contains the alpha mating factor secretion signal sequence, was also digested with XhoI and EcoRI. All fragments were ligated into pPIC9 in frame with the alpha mating factor secretion signal sequence, which was shown to be cleaved at the expected position, liberating the translation product of the cloned cDNA fragment for each of the domains.
Verification of DNA sequence of clones and protein expression and purification
The methods used to verify the DNA sequence of each yeast clone expressing a particular domain was identical to that used to analyze clones expressing full-length HSA.
Since all three HSA domains bound to Cibacron Blue Sepharose, the HSA domains were expressed and purified using methods identical to those used to purify full-length HSA.
Spectroscopic assay of 15-keto-prostaglandin E2 (15 keto-PGE2) breakdown
Background
As shown in Figure 1 ▶, 15-keto PGE2 is converted to 15-keto PGB2 through a keto-enol tautomer intermediate which has a peak absorbance at 505 nm (Fitzpatrick et al. 1984). That study verified that the breakdown of 15-keto-PGE2 to the keto-enol tautomers can be accurately monitored by measuring the absorbance at 505 nm of a solution containing 15-keto-PGE2 as a function of time (Fitzpatrick et al. 1984). By monitoring absorbance at 505 nm, it was also shown in the above study that albumin from different species catalyzed the breakdown of 15-keto-PGE2 to the keto-enol tautomer intermediate at different rates, presumably as a result of differences in the binding site structure. This previously validated assay system was used with minor modifications. The previously determined extinction coefficient of 35,000 at 505 nm (Fitzpatrick et al. 1984) for the keto-enol tautomers can be used in the following measurements to convert measured A505nm values to keto-enol tautomer concentrations.
General experimental parameters
One mg of 15-keto-PGE2 was dissolved in 200 μL of ethanol, and 10 μL containing 50 μg was aliquoted into 20 1.5-mL Eppendorf tubes. The ethanol was removed from each tube by vacuum drying. For each experiment ,the 50 μg dried prostaglandin in one tube was dissolved in 20 μL of PBS. Each assay contained the following 2 μL of dissolved prostaglandin (5 μg) and 98 μL of a particular HSA sample at a concentration of 5 mg/mL in PBS. The initial mole ratio of 15-keto-PGE2/HSA was 2:1 (140 μM 15-keto-PGE2/70 μM HSA). As a control for prostaglandin breakdown in the absence of HSA, assays were run containing 2 μL of dissolved prostaglandin (5 μg) and 98 μL of PBS (5 mg/mL). Additionally, a control was run using 5 mg/mL commercial bovine serum albumin (BSA), because a previous study had shown that BSA has a catalytic rate for the above process much lower than that of HSA. For each assay, the 100 μL solution was transferred to an ultramicro quartz spectrophotometer cuvette designed for measuring absorbance using sample volumes of 50 μL or greater (Sigma). The path length of the cuvette was 1 cm. For each albumin species, the blank consisted of a sample containing the same albumin species but lacking 15-keto-PGE2. For the control assay in which the breakdown of 15-keto-PGE2 was monitored in PBS in the absence of albumin, a solution of PBS lacking albumin and 15-keto-PGE2 was used as a blank. For all samples assayed, absorbance at 505 nm was determined at 1 h, 2 h, 4 h, 6 h, 8 h, 16 h, and 26 h after mixing together the assay components. Reactions were carried out at 25 °C in a constant temperature incubator. Samples were only exposed to light when withdrawn from the incubator for absorbance measurements.
Analysis of data
The calculation of an approximate relative rate constant for the formation of the keto-enol tautomers for each species from the absorbance at 505 nm after 1 h was as follows. The absorbance at 505 nm after 1 h determined for wild-type HSA was set equal to 1. The normalized rate constants for all other HSA species are equal to (A505nm at 1 h) / (A505nm at 1 h of wild-type HSA). All experiments were done three times, and the relative rate constants shown are the average of three determinations. To estimate the relative rate constant for the conversion of keto-enol tautomers to the final product, that is, 15-keto-PGB2, nonlinear regression was applied to the 26-h data using the computer program GraphPad Prism (GraphPad, San Diego, CA).
Assuming a two-step consecutive reaction model,
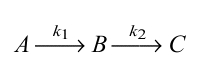 |
where A corresponds to 15-keto-PGE2, B corresponds to 15-keto-PGA2, which is monitored by observing the chromophore (enol tautomeric hybrid) formation, and C corresponds to 15-keto-PGB2, the final product, the following equation was used.
 |
Acknowledgments
This work was supported by a grant-in-aid from the American Heart Association, Hawaii Affiliate.
The publication costs of this article were defrayed in part by payment of page charges. This article must therefore be hereby marked "advertisement" in accordance with 18 USC section 1734 solely to indicate this fact.
Article and publication are at http://www.proteinscience.org/cgi/doi/10.1110/ps.28702.
References
- Arevalo, G. 1991. Prevalence of familial dysalbuminemic hyperthyroxinemia in serum samples received for thyroid testing. Clin. Chem. 37: 1430–1431. [PubMed] [Google Scholar]
- Campbell, W.B. and Halushka, P.V. 1996. Lipid-derived autoacids: Ecosanoids and platelet-activating factor. In Goodman and Gilman's the pharmacological basis of therapeutics, 9th ed. (eds. J.G. Hardman et al.), pp. 601–616. McGraw-Hill, New York, NY.
- Carter, D.C. and Ho, J.X. 1994. Structure of serum albumin. Adv. Protein Chem. 45: 153–201. [DOI] [PubMed] [Google Scholar]
- Cho, M. and Allen, M. 1978. Chemical stability of prostacyclin (PGI2) in aqueous solutions. Prostaglandins Other Lipid Mediat. 15: 943–954. [DOI] [PubMed] [Google Scholar]
- Curry, S., Mandelkow, H., Brick, P., and Franks, N.P. 1998. Crystal structure of human serum albumin complexed with fatty acid reveals an asymmetric distribution of binding sites. Nat. Struct. Biol. 5: 827–835. [DOI] [PubMed] [Google Scholar]
- Dockal, M., Carter D.C., and Ruker, F. 1999. The three recombinant domains of human serum albumin. Structural characterization and ligand binding properties. J. Biol. Chem. 274: 29303–29310. [DOI] [PubMed] [Google Scholar]
- Dockal, M., Chang, M., Carter, D.C., and Ruker, F. 2000. Five recombinant fragments of human serum albumin—Tools for the characterization of the warfarin binding site. Protein Sci. 9: 1455–1465. [DOI] [PMC free article] [PubMed] [Google Scholar]
- Fitzpatrick, F.A., Aguirre, F., Pike, J.E., and Lincoln, F.H. 1980. The stability of 13,14-dihydro-15-keto-PGE2. Prostaglandins Other Lipid Mediat. 19: 917–931. [DOI] [PubMed] [Google Scholar]
- Fitzpatrick, F.A., Liggett, W.F., and Wynalda, M.A. 1984. Albumin-eicosanoid interactions: A model system to determine their attributes and inhibition. J. Biol. Chem. 259: 2722–2727. [PubMed] [Google Scholar]
- Fitzpatrick, F.A., Morton, D.R., and Wynalda, M.A. 1981. Albumin stabilizes leukotriene A4. J. Biol. Chem. 257: 4680–4683. [PubMed] [Google Scholar]
- Fitzpatrick, F.A., and Wynalda, M.A. 1981. Albumin-lipid interactions: Prostaglandin stability as a probe for characterizing binding sites on vertebrate albumins. Biochem. 20: 6129–6134. [DOI] [PubMed] [Google Scholar]
- Folco, G., Granstrom, E. and Kindahl, H. 1977. Albumin stabilizes thromboxane A2. FEBS Lett. 82: 321–324. [DOI] [PubMed] [Google Scholar]
- Gerig, J.T. and Reinheimer, J.D. 1975. Modification of human serum albumin with trifluoromethyl-substituted aryl halides and sulfonates. J. Am. Chem. Soc. 97: 168–173. [DOI] [PubMed] [Google Scholar]
- Gillum, R.F. 2000. Assessment of serum albumin concentration as a risk factor for stroke and coronary disease in African Americans and whites. J. Natl. Med. Assoc. 92: 3–9. [PMC free article] [PubMed] [Google Scholar]
- Gillum, R.F. and Makuc, D.M. 1992. Serum albumin, coronary heart disease, and death. Am. Heart J. 123: 507–513. [DOI] [PubMed] [Google Scholar]
- Glatz, J.F.C. and Veerkamp, J.H. 1983. Removal of fatty acids from serum albumin by Lipidex 1000 chromatography. J. Biochem. Biophys. Methods 8: 57–61. [DOI] [PubMed] [Google Scholar]
- Goldwasser, P. and Feledman, J. 1997. Association of serum albumin and mortality risk. J Clin. Epidemiol. 50: 693–703. [DOI] [PubMed] [Google Scholar]
- Granstrom, E., Hamberg, M., Hansson, G., and Kindahl, H. 1980. Chemical instability of 15-keto-13,14-dihydro-PGE2: The reason for low assay reliability. Prostaglandins Other Lipid Mediat. 20: 933–957. [DOI] [PubMed] [Google Scholar]
- Gueriguian, J.L. 1976. Prostaglandin-macromolecule interactions. I. Noncavalent binding of prostaglandins A1, E1, F2, and E2 by human and bovine serum albumins. J. Pharmacol. Exp. Ther. 197: 391–401. [PubMed] [Google Scholar]
- He, X.M. and Carter, D.C. 1992. Atomic structure and chemistry of human serum albumin. Nature 358: 208–215. [DOI] [PubMed] [Google Scholar]
- Monkhouse, D., Van Campen, L. and Aguiar, A. 1973. Kinetics of dehydration and isomerization of prostaglandins E1 and E2. J. Pharm. Sci. 62: 576–580. [DOI] [PubMed] [Google Scholar]
- Petersen, C.E., Ha, C.E., Harohalli, K., Park, D., and Bhagavan, N.V. 1997. Mutagenesis studies of thyroxine binding to human serum albumin define important structural characteristics of subdomain 2A. Biochemistry 36: 7012–7017. [DOI] [PubMed] [Google Scholar]
- Petersen, C.E., Ha, C.E., Harohalli, K., Park, D.S., and Bhagavan, N.V. 2000. Familial dysalbuminemic hyperthyroxinemia may result in altered warfarin pharmacokinetics. Chem. Biol. Interact. 124: 161–172. [DOI] [PubMed] [Google Scholar]
- Petersen, C.E., Ha, C.E., Jameson, D.M., and Bhagavan, N.V.1996. Mutations in a specific human serum albumin thyroxine binding site define the structural basis of familial dysalbuminemic hyperthyroxinemia. J. Biol. Chem 271: 19110–19117. [DOI] [PubMed] [Google Scholar]
- Petitpas, I., Bhattacharya, A.A., Twine, S., East, M., and Curry, S. 2001. Crystal structure analysis of warfarin binding to human serum albumin: Anatomy of drug site I. J. Biol. Chem. 276: 22804–22809. [DOI] [PubMed] [Google Scholar]
- Raz, A. 1972. Interaction of prostaglandins with blood plasma proteins: Comparative binding of prostaglandins A2, F2 and E2 to human plasma proteins. Biochem. J. 130: 631–636. [DOI] [PMC free article] [PubMed] [Google Scholar]
- Remuzzi, G., Mecca, G., Marchesis, D., Livio, M., de Gaetano, G., Doanti, M.B., and Silver, M.J. 1979. Platelet hyperaggregability and the nephrotic syndrome. Thromb. Res. 16: 345–354. [DOI] [PubMed] [Google Scholar]
- Silver, M.J., Smith, J.B., Ingerman, C.M., and Kocsis, J.J. 1973. Arachidonic acid-induced human platelet aggregation and prostaglandin formation. Prostaglandins Other Lipid Mediat. 4: 863–875. [DOI] [PubMed] [Google Scholar]
- Stehle, R. and Oesterling, T. 1977. Stability of prostaglandin E1 and dinoprostone (prostaglandin E2) under strongly acidic and basic conditions. J Pharm. Sci. 66: 1590–1595. [DOI] [PubMed] [Google Scholar]
- Thompson, G., Collins, J., and Schmalzried, L. 1973. Total rate equation for decomposition of prostaglandin E2. J. Pharm. Sci. 62: 1738–1739. [DOI] [PubMed] [Google Scholar]
- Unger, W.G. 1972. Binding of prostaglandin to human serum albumin. J. Pharm. Pharm. Sci. 24: 470–477. [DOI] [PubMed] [Google Scholar]
- Watanabe, T., Narumiya, S., Shimizu, T., and Hayaishi, O. 1982. Characterization of the biosynthetic pathway of prostaglandin D2 in human platelet-rich plasma. J. Biol. Chem. 257: 14847–14853. [PubMed] [Google Scholar]
- Wynalda, N.A. and Fitzpatrick, F.A. 1980. Albumins stabilize prostaglandin I2. Prostaglandins Other Lipid Mediat. 20: 853–861. [DOI] [PubMed] [Google Scholar]