

Abstract
Based on previous studies of interleukin-1β (IL-1β) and both acidic and basic fibroblast growth factors (FGFs), it has been suggested that the folding of β-trefoil proteins is intrinsically slow and may occur via the formation of essential intermediates. Using optical and NMR-detected quenched-flow hydrogen/deuterium exchange methods, we have measured the folding kinetics of hisactophilin, another β-trefoil protein that has <10% sequence identity and unrelated function to IL-1β and FGFs. We find that hisactophilin can fold rapidly and with apparently two-state kinetics, except under the most stabilizing conditions investigated where there is evidence for formation of a folding intermediate. The hisactophilin intermediate has significant structural similarities to the IL-1β intermediate that has been observed experimentally and predicted theoretically using a simple, topology-based folding model; however, it appears to be different from the folding intermediate observed experimentally for acidic FGF. For hisactophilin and acidic FGF, intermediates are much less prominent during folding than for IL-1β. Considering the structures of the different β-trefoil proteins, it appears that differences in nonconserved loops and hydrophobic interactions may play an important role in differential stabilization of the intermediates for these proteins.
Keywords: Hisactophilin, β-trefoil, folding pathway, folding intermediate, hydrogen/deuterium exchange
Conservation of folding pathways among proteins with common topologies but diverse primary sequences is of great interest to the folding community (for review, see Gunasekaran et al. 2001). Based on experimental and theoretical studies, the topology of the folding transition state is usually conserved among proteins that adopt a common native fold; however, there can be significant shifts in the folding nucleus (for reviews, see Dinner et al. 2000; Grantcharova et al. 2001; Guerois and Serrano 2001; Oliveberg 2001). Currently, there is little high-resolution experimental data on the structures of folding intermediates for proteins with common native structures but diverse primary sequences (Gunasekaran et al. 2001). There is experimental evidence that folding intermediates may be conserved among homologous proteins, but the kinetic prominence and structural details of intermediates can vary markedly (Hollecker and Creighton 1983; Hooke et al. 1994; Nishimura et al. 2000; Gunasekaran et al. 2001).
The β-trefoil fold (Murzin et al. 1992) is an interesting test case for investigating properties of folding intermediates among proteins with the same fold but unrelated primary sequences and functions. According to Structural Classification of Proteins (Murzin et al. 1995), the β-trefoil fold has been observed in five protein superfamilies: cytokine, which includes interleukin-1β (IL-1β) and fibroblast growth factors (FGF); ricin B-like; agglutinin; Kunitz inhibitor; and actin-binding protein, hisactophilin. This single-domain, all-β structure consists of a triplet of β-hairpins packed against a six-stranded antiparallel β-barrel. In-depth kinetic folding measurements have been reported for three β-trefoil proteins to date: IL-1β (Craig et al. 1987, Varley et al. 1993; Heidary et al. 1997; Finke et al. 2000), acidic FGF (Samuel et al. 2000,2001), and basic FGF (Estape et al. 1998; Estape and Rinas 1999). There is <10%–15% sequence identity among hisactophilin, acidic and basic FGF and IL-1β; however, all the proteins tend to contain medium or large hydrophobic residues at 18 structurally conserved positions (Murzin et al. 1992). These hydrophobic residues are distributed through all 12 of the β-strands that comprise the β-trefoil fold, and they form a single, large hydrophobic core. The chain length for these proteins varies from 118 amino acids for hisactophilin to ∼154 amino acids for acidic and basic FGFs and 153 amino acids for IL-1β. The proteins with the longer chain lengths tend to have somewhat longer β-strands and considerably longer loops.
IL-1β and acidic and basic FGF all fold relatively slowly and with formation of kinetic intermediates. For IL-1β there is evidence that intermediate formation during folding is essential in that direct folding from the unfolded to the folded state is not observed (i.e., all protein molecules appear to fold via the intermediate [Heidary et al. 1997]). Quenched-flow H/D (hydrogen/deuterium) exchange experiments on IL-1β and acidic FGF revealed different patterns for protection of amides during folding; hence, the intermediates for these proteins appear to have quite different structures (Varley et al. 1993; Samuel et al. 2001). The structure of the experimentally observed intermediate for IL-1β is similar, however, to the structure of an intermediate predicted using a simple model based on native state topology (Clementi et al. 2000). We have undertaken in-depth characterization of the stability and folding of hisactophilin (Hammond et al. 1998, Liu et al. 2001; Houliston et al. 2002). In this paper, we report measurements of hisactophilin folding monitored by optical and quenched-flow H/D exchange methods. Important similarities and differences in the folding pathways of β-trefoil proteins are identified.
Results
Optical measurements of stability and folding kinetics
The thermodynamic stability of hisactophilin was measured by fluorescence- and CD-monitored urea denaturation curves in H2O at pH 5.7, H2O at pH 7.7, and D2O at pH 7.8 (Table 1). The denaturation curve data are consistent with a two-state equilibrium transition between the native and denatured states (Liu et al. 2001). The thermodynamic stability of hisactophilin increases from 2.3 kcal mol−1 at pH 5.7 in H2O, to 8.4 kcal mol−1 at pH 7.7 in H2O, and 10.8 kcal mol−1 at pH 7.8 in D2O.
Table 1.
Summary of equilibrium and kinetic parameters for hisactophilin
| Conditions | Probe | Method | ΔGuo (kcal mol−1 M−1) | m1 (kcal mol−1 M−1) | Cmid (M) | krefo (s−1) | mref (kcal mol−1 M−1) | kunfo (s−1) | munf,1 (kcal mol−1 M−1) | βTc |
| pH 5.7 | CD | Equilibriuma | 2.27 ± 0.11 | 2.29 ± 0.10 | 1.02 ± 0.01 | — | — | — | — | — |
| H2O | FL | Equilibriuma | 2.36 ± 0.19 | 2.28 ± 0.19 | 1.00 ± 0.03 | — | — | — | — | — |
| CD | Kineticb | 1.95 ± 0.23 | 2.17 ± 0.08 | 0.91 ± 0.06 | 6.95 ± 0.35 × 10⁻³ | 1.54 ± 0.07 | 2.44 ± 0.13 × 10⁻⁴ | 0.63 ± 0.01 | 0.71 | |
| FL | Kineticb | 1.86 ± 0.23 | 2.23 ± 0.09 | 0.84 ± 0.06 | 6.62 ± 0.31 × 10⁻³ | 1.61 ± 0.08 | 2.71 ± 0.13 × 10⁻⁴ | 0.62 ± 0.01 | 0.72 | |
| pH 7.7 | CD | Equilibriuma | 8.30 ± 0.23 | 2.23 ± 0.05 | 4.31 ± 0.02 | — | — | — | — | — |
| H2O | FL | Equilibriuma | 8.45 ± 0.23 | 2.24 ± 0.05 | 4.39 ± 0.02 | — | — | — | — | — |
| FLd | Kineticb | 8.91 ± 0.33 | 2.14 ± 0.06 | 4.41 ± 0.33 | 101 ± 10 | 1.52 ± 0.02 | 2.29 ± 0.86 × 10⁻⁵ | 0.62 ± 0.03 | 0.71 | |
| pH 7.8 | FL | Equilibriuma | 10.84 ± 0.29 | 2.47 ± 0.06 | 5.17 ± 0.02 | — | — | — | — | — |
| D2O | FL | Kineticb | 10.51 ± 0.28 | 2.14 ± 0.06 | 5.27 ± 0.33 | 340 ± 53 | 1.43 ± 0.04 | 5.01 ± 1.46 × 10⁻⁶ | 0.71 ± 0.02 | 0.67 |
Error estimates were obtained from the fitting program (Kaleidagraph).
a ΔGuo and m1 were obtained by fitting equilibrium denaturation data using equation 1 with m2 = 0.072.
b Observed unfolding and refolding rate constants vs. urea concentration were fit to equation 3 with munf,2 = 0.0473.
ΔGuH2O, m1, and Cmid were calculated from the fitted kinetic parameters using equation 4, m1 = mref + munf,1 and Cmid corresponding to ΔGu = 0.
c βT was calculated using equation 5.
d Rates measured by CD agree with rates measured by fluorescence at pH 7.7 in H2O; however, fitted kinetic parameters are not included for CD data due to lack of stopped-flow CD data at low denaturant concentrations, which caused very large errors in fitted values for krefo and mref.
Rates of hisactophilin unfolding and refolding were measured by fluorescence and CD under the same conditions as the urea denaturation curves (Fig. 1 ▶). At pH 5.7 in H2O, the folding kinetics fit the classical requirements for a two-state transition between the native and denatured states (Jackson and Fersht 1991): monoexponential kinetic traces, coincident unfolding and refolding rates measured by fluorescence and CD (Fig. 1A ▶), full expected amplitudes for kinetic traces (data not shown), and agreement between calculated ΔGuH2O values from equilibrium and kinetic data (Table 1). At pH 7.7 in H2O the results are also largely consistent with a two-state transition (Fig. 1B ▶; Table 1); however, there may be some rollover in the refolding rates at low urea concentrations, indicative of non-two-state behavior. At pH 7.8 in D2O, folding kinetics are unambiguously double exponential at low denaturant concentrations.
Fig. 1.
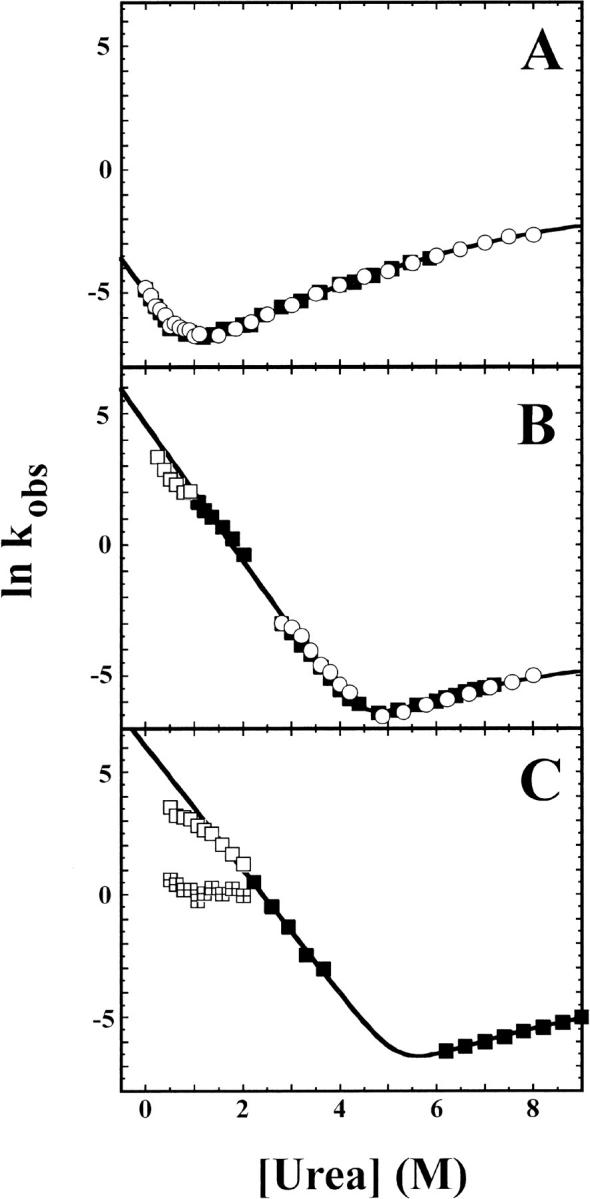
Natural logarithm of observed unfolding and refolding rate constants of hisactophilin. Rates measured by CD (open circles) and fluorescence (solid squares, open squares, and quartered squares) as a function of urea concentration for (A) pH 5.7 in H2O, (B) pH 7.7 in H2O, and (C) pH 7.8 in D2O. In all three cases the amplitudes of the kinetic traces correspond to the expected amplitudes based on equilibrium denaturation curves under identical conditions. Kinetics traces were well fit by a single-exponential function except for data below 2.0 M urea at pH 7.8 in D2O, which required fitting by a double-exponential function (open squares and quartered squares represent rates for the fast and slow phase, respectively, in panel C). For the double-exponential fits, the fast phase accounts for >90% of the fluorescence signal changes. The kinetic rate constants were fit by nonlinear least-squares regression to equation 3. The value of munf,2 was fixed to 0.0473, which is the average value for curvature of unfolding rates obtained from repeated experiments at pH 5.7. All kinetic data were included for fits at pH 5.7, but at higher pH only the rates under conditions where intermediate formation is insignificant are included (solid squares). Solid lines represent fits for CD data at pH 5.7 (open circles) and fluorescence data at pH 7.7 and 7.8 (solid squares). Values obtained for fitted parameters are summarized in Table 1.
The double-exponential kinetics may indicate formation of a folding intermediate or formation of transient aggregates (Silow and Oliveberg 1997; Silow et al. 1999) (note that hisactophilin does not contain any prolines, and so the slow phase cannot arise from proline isomerization). Aggregation tends to become more prominent at increased protein concentrations, and so folding kinetics were measured for hisactophilin for protein concentrations ranging from 0.065 to 2.0 mg mL−1 (i.e., concentrations that are both lower and higher than those used for fluorescence and quenched-flow H/D exchange experiments, respectively). The rates of the two kinetic phases were not affected by protein concentration over this range, and the amplitude of the slower phase appeared to actually decrease slightly at increased protein concentrations. Thus, the slow phase does not have the hallmark characteristics of a phase caused by protein aggregation, which tends to become more prominent at higher protein concentrations. In addition, double-exponential kinetics were observed for hisactophilin at higher pH and in the presence of Na2SO4 (i.e., higher stability solution conditions) but not at pH 6.7 (i.e., lower stability solution conditions; Liu et al. 2001; C. Liu, H.J. Wong, and E.M. Meiering, unpubl.); hence, double-exponential refolding kinetics are apparent only under conditions where hisactophilin has high stability. Thus, although transient aggregation cannot be ruled out, it appears likely that hisactophilin forms a folding intermediate under conditions of increased stability. The results for hisactophilin are similar to results obtained for other proteins, for which folding rates tend to decrease and follow two-state kinetics under destabilizing solution conditions, while intermediates tend to be observed under stabilizing conditions (Roder and Colon 1997). However, two-state folding kinetics have not been reported previously for other β-trefoil proteins under any solution conditions.
Quenched-flow H/D exchange measurements of folding kinetics
The specific structure of the folding intermediate for hisactophilin was investigated by quenched-flow H/D exchange experiments monitored by NMR at pH 7.8 in D2O and 1.28 M urea (Fig. 2 ▶). The time course for protection of amide protons was determined for 31 NH groups (Table 2) located throughout the structure of the protein (Fig. 4 ▶). There is no burst phase of protection of NHs for hisactophilin. The quenched-flow data require fitting by at least a double-exponential equation (Fig. 3A–C ▶). Protection rates of individual amides differ by up to ∼20-fold (Table 2). Since these rates are relatively uniform, data for various groups of amides in different parts of the structure were averaged to try to discern the sequence of folding events. This averaging decreases error estimates for fitted rates because the scatter in experimental points is decreased for the averaged data (Table 2).
Fig. 2.
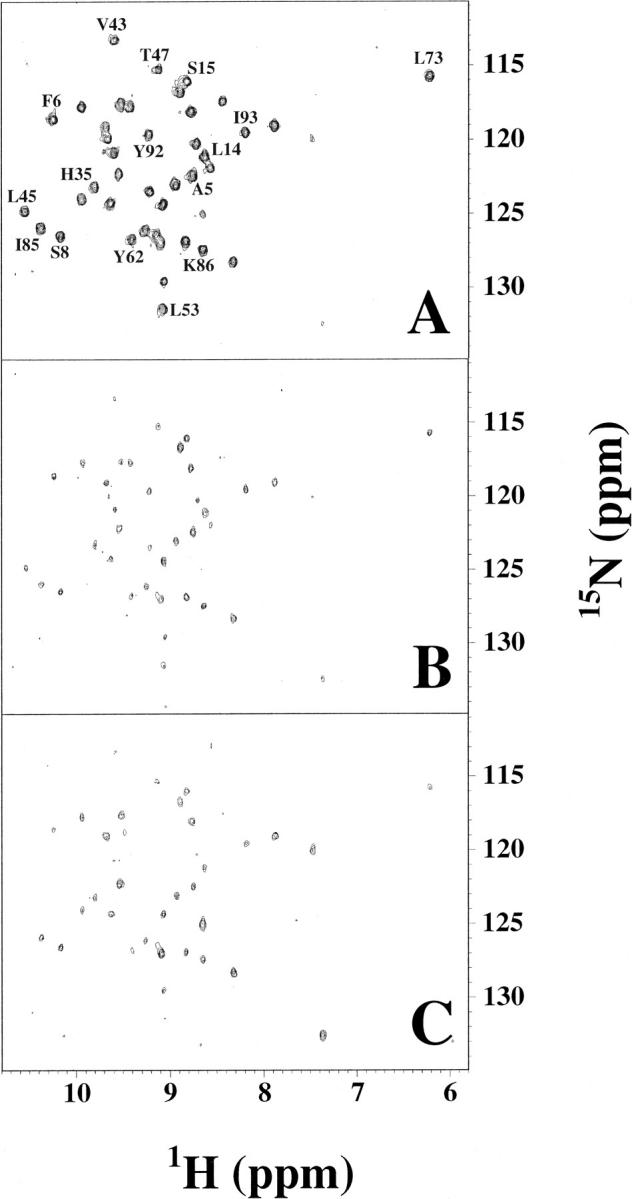
1H-15N HSQC spectra of quenched-flow refolded hisactophilin. Refolding times are (A) τref = 28.7 msec, (B) τref = 646 msec, and (C) τref = 5 sec. Selected peaks are labeled with single letter code and residue number. Intensities of 31 slowly exchanging amide protons could be measured reliably (listed in Table 2). The remaining slowly exchanging amides are either unassigned (1 peak), overlapped (2 peaks), or give very scattered data due to back exchange during sample preparation. The 31 monitored residues are distributed throughout the structure of hisactophilin (Fig. 4 ▶; Table 2).
Table 2.
Summary of quenched-flow refolding rates in D2O at pH 7.8, 1.28 M urea
| Residue | Structural element-trefoil | Fast amplitude | Fast rate(s−1) | Slow amplitude | Slow rate(s−1) |
| A5 | β1-1 | 53 ± 17 | 5.0 ± 2.8 | 40 ± 17 | 0.45 ± 0.27 |
| F6 | β1-1 | 48 ± 10 | 6.3 ± 2.4 | 46 ± 11 | 0.55 ± 0.19 |
| K7 | β1-1 | 43 ± 23 | 6.7 ± 5.2 | 51 ± 24 | 0.82 ± 0.52 |
| S8 | β1-1 | 48 ± 25 | 8.1 ± 6.7 | 45 ± 24 | 0.74 ± 0.63 |
| L14 | β2-1 | 19 ± 11 | 33.7 ± 42.2 | 70 ± 8 | 1.18 ± 0.37 |
| S15 | β2-1 | 30 ± 16 | 14.7 ± 14.4 | 62 ± 15 | 0.89 ± 0.43 |
| F34 | β4-2 | 51 ± 12 | 14.0 ± 6.5 | 38 ± 10 | 0.59 ± 0.34 |
| H35 | β4-2 | 50 ± 10 | 16.3 ± 6.3 | 40 ± 8 | 0.66 ± 0.30 |
| V43 | β5-2 | 50 ± 8 | 48.1 ± 19.6 | 42 ± 5 | 0.91 ± 0.35 |
| A44 | β5-2 | 66 ± 11 | 24.5 ± 9.4 | 35 ± 8 | 0.36 ± 0.22 |
| L45 | β5-2 | 70 ± 11 | 20.7 ± 6.8 | 28 ± 10 | 0.81 ± 0.65 |
| K46 | β5-2 | 55 ± 14 | 10.3 ± 3.9 | 38 ± 14 | 0.97 ± 0.58 |
| T47 | β5/6-turn-2 | 52 ± 9 | 31.3 ± 12.6 | 44 ± 7 | 0.90 ± 0.40 |
| L53 | β6-2 | 53 ± 9 | 47.4 ± 21.6 | 41 ± 6 | 0.81 ± 0.37 |
| S54 | β6-2 | 52 ± 5 | 17.9 ± 3.4 | 42 ± 5 | 0.96 ± 0.23 |
| I55 | β6-2 | 60 ± 13 | 12.8 ± 5.3 | 35 ± 11 | 0.55 ± 0.37 |
| Y62 | β7-2 | 41 ± 9 | 48.8 ± 25.4 | 51 ± 7 | 2.23 ± 0.70 |
| L63 | β7-2 | 68 ± 13 | 4.0 ± 1.9 | 17 ± 13 | 0.11 ± 0.19 |
| L73 | β7/8-loop-2 | 44 ± 8 | 33.2 ± 14.1 | 44 ± 6 | 0.76 ± 0.28 |
| D74 | β8 | 41 ± 6 | 42.5 ± 15.3 | 52 ± 4 | 0.88 ± 0.21 |
| V83 | β9-3 | 36 ± 13 | 12.0 ± 7.3 | 52 ± 12 | 0.88 ± 0.39 |
| S84 | β9-3 | 37 ± 10 | 11.7 ± 5.7 | 60 ± 9 | 0.60 ± 0.18 |
| I85 | β9-3 | 73 ± 5 | 2.3 ± 0.5 | 17 ± 6 | 0.02 ± 0.02 |
| K86 | β9-3 | 56 ± 11 | 9.3 ± 3.5 | 39 ± 10 | 0.49 ± 0.24 |
| G87 | β9/10-loop-3 | 8 ± 18 | 9.7 ± 3.4 | 82 ± 18 | 0.91 ± 0.33 |
| Y92 | β10-3 | 65 ± 19 | 5.1 ± 2.9 | 23 ± 19 | 0.35 ± 0.46 |
| I93 | β10-3 | 55 ± 7 | 14.8 ± 3.9 | 35 ± 6 | 0.48 ± 0.18 |
| S94 | β10-3 | 54 ± 14 | 9.0 ± 4.5 | 40 ± 13 | 0.49 ± 0.30 |
| A95 | β10-3 | 58 ± 20 | 4.7 ± 2.4 | 31 ± 21 | 0.67 ± 0.51 |
| F113 | β12-3 | 68 ± 11 | 4.2 ± 1.4 | 18 ± 11 | 0.24 ± 0.25 |
| E114 | β12-3 | 38 ± 6 | 21.9 ± 7.0 | 50 ± 5 | 0.93 ± 0.22 |
| Trefoil 1a | 41 ± 6 | 9.8 ± 2.2 | 50 ± 6 | 0.71 ± 0.14 | |
| Trefoil 2a | 51 ± 5 | 25.5 ± 5.0 | 42 ± 4 | 0.86 ± 0.19 | |
| Trefoil 3a | 44 ± 7 | 8.6 ± 2.4 | 45 ± 7 | 0.66 ± 0.17 | |
| Strands 4–8b | 51 ± 4 | 24.4 ± 4.4 | 42 ± 4 | 0.84 ± 0.17 | |
| Othersc | 43 ± 6 | 8.8 ± 2.1 | 47 ± 6 | 0.69 ± 0.15 | |
| Strands 6–10d | 42 ± 6 | 17.1 ± 4.8 | 49 ± 5 | 0.78 ± 0.19 | |
| Otherse | 46 ± 4 | 13.5 ± 2.0 | 45 ± 3 | 0.75 ± 0.11 | |
| Slowly protected in IL-1βf | 41 ± 4 | 9.0 ± 1.5 | 49 ± 4 | 0.74 ± 0.10 | |
| Short range H-bondingg | 46 ± 6 | 12.1 ± 2.8 | 45 ± 5 | 0.70 ± 0.16 | |
| Long range H-bondingh | 40 ± 5 | 14.5 ± 3.4 | 49 ± 5 | 0.82 ± 0.16 | |
| Fluorescence datai | 2.07 ± 0.01 | 3.58 ± 0.02 | 1.17 ± 0.01 | 0.46 ± 0.01 |
Rates and amplitudes for individual amides were obtained by fitting the HSQC amide proton peak intensities as a function of refolding time to a double-exponential rate equation with an offset, using nonlinear–least squares regression. For the amides with the slowest protection rates, there is also evidence for an additional slower phase with very small amplitude (∼5–10% of total), for which the rate is not well defined by the time points acquired. Error estimates for fitted parameters are from the fitting program (Kaleidagraph). Average rates and amplitudes for the different groups of amides listed at the bottom of the table were determined by calculating the average peak intensity for the amides in a given group at each refolding time point and then fitting the averaged intensities to a double-exponential. The following groups of amides were analyzed.
a The trefoil 1 group includes all amides in strands 1–4; trefoil 2 includes all amides in strands 5–8; trefoil 3 includes all amides in strands 9–12.
b Amides that form H-bonds within strands 4–8 (i.e., formation of structure analogous to that of the intermediate observed in folding simulation of IL-1β [Clementi et al. 2000]): H35, V43, A44, L45, K46, T47, L53, S54, I55, Y62, L63, L73, and D74 (Fig. 3C ▶).
c All remaining amides not included in preceding grouping.
d Amides that form H-bonds in strands 6–10 (i.e., formation of structure analogous to that of the intermediate observed by quenched-flow H/D exchange data for IL-1β [Varley et al. 1993]): L53, S54, Y62, L73, D74, S84, K86, G87, Y92, and S94 (Fig. 3B ▶).
e All amides corresponding to structural probes in IL-1β that are not included in preceding grouping: A5, F6, K7, S8, L14, S15, F34, H35, V43, A44, L45, K46, T47, I93, A95, F113, and E114.
f Amides protected by formation of strands 1–3 and 10–12 (i.e., corresponding to positions protected most slowly in quenched-flow H/D exchange experiments on IL-1β [Varley et al. 1993]): A5, F6, K7, S8, L14, S15, I93, A95, and E114 (Fig. 3C ▶).
g Amides that form H-bonds within β-hairpins between strands 2 and 3, 4 and 5, 6 and 7, 8 and 9, 9 and 10, and 10 and 11: S15, H35, A44, K46, S54, Y62, S84, I85, K86, G87, Y92, I93, S94, and A95 (Fig. 3A ▶).
h Amides that form long range hydrogen bonds between strands 1 and 4, 5 and 8, 9 and 12, and 1 and 12: A5, K7, F34, V43, D74, V83, F113, and E114 (Fig. 3A ▶).
i Kinetics of folding were measured by stopped-flow flourescence under identical conditions to those for the quenched-flow refolding experiments (i.e., 1.5 mg ml−1 15N-labeled hisactophilin in D2O at pH 7.8, 1.28 M urea. Kinetics measured using 0.25 mg mL−1 of protein (i.e., the same protein concentration used to obtain kinetic data in Fig. 1 ▶) gave the same results within experimental error as for higher protein concentration. The relative amplitude for the slow phase is somewhat higher for these measurements than for measurements with unlabeled protein; however, the differences are probably not significant given that experimental errors under these conditions are rather high because the two kinetic phases are not very well resolved.
Fig. 4.
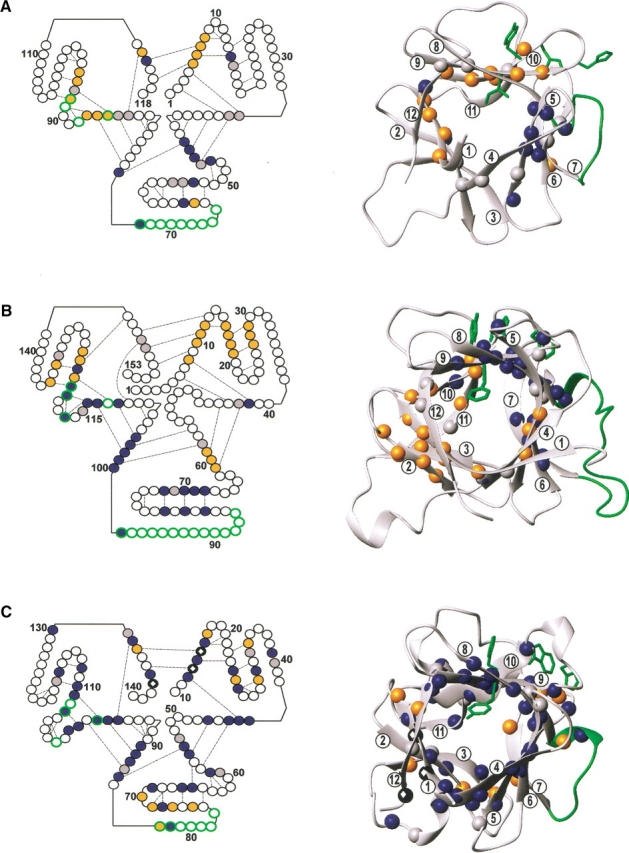
Structural location of amides analyzed by NMR-detected quenched flow H/D exchange for (A) hisactophilin, (B) IL-1β, and (C) acidic FGF, depicted in a schematic representation (left) and a ribbon representation (right). In the schematic, individual residues are represented as circles with various residue numbers shown for reference. Selected hydrogen bonds involving backbone NH groups are shown by dashed lines. The first trefoil unit (strands 1–4) is at upper right, the second trefoil (strands 5–8) is at bottom, and the third trefoil (strands 9–12) is at upper left. The ribbon diagrams were prepared using the program MOLMOL (Koradi et al. 1996) and PDB accession codes 1HCD (Habazettl et al. 1992), 2I1B (Priestle et al. 1989), and 2AFG (Blaber et al. 1996). For the ribbons, β-strands are labeled 1 through 12. Amides with the fastest, intermediate, or slowest rates of protection are colored blue, gray, and orange, respectively, in the schematic and ribbon representation. The criteria used for fast, intermediate, and slow rates are, respectively, as follows: (A) for hisactophilin, >20, 20–10, and <10 s−1; (B) for IL-1β, ∼1–0.5, ∼0.05–0.03, and ≪0.03 s−1; and (C) for acidic FGF, 1–0.3, 0.3–0.1, and <0.1 s−1. These criteria are similar to those used in the original publications of quenched-flow data for each protein. In addition, for acidic FGF, the three residues protected within the experimental dead time (rates >150 s−1) are represented by a solid circle with a white diamond inside. The sources for the protection rate constants are as follows: the fast rates in Table 2 for hisactophilin, data from Fig. 3 ▶ of Varley et al. (1993) for IL-1β, and data from Fig. 9 of Samuel et al. (2001) for acidic FGF (original data kindly provided by C. Yu and T.K.S. Kumar, Dept. of Chemistry, National Tsing Hua University, Taiwan). For hisactophilin, residues with smaller rate constants for the fast phase also tend to have smaller rate constants for the slow phase, but differences between residues are not as pronounced for the slow phase. However, for residues with the smallest rate constants for the fast phase, there is often evidence for a third, very small amplitude slower phase which is not resolved (Fig. 3 ▶); hence, coloring according to the fast rates reflects quite accurately the overall relative rate of protection of amides. In the schematic and ribbon, various hydrophobic regions in IL-1β, and corresponding residues in hisactophilin and acidic FGF, are shown in green. Residues 65–73 (HHLHGDHSL) and 77–83 (QTPNEEC) between strands 7 and 8 in hisactophilin and acidic FGF, respectively, correspond to the microdomain (residues 86-99) in IL-1β. The hydrophobic cluster between strands 9 and 10 in IL-1β (residues F112, F117, W120, and Y121) may also be present in acidic FGF (Y97, H102, W107, and F108) but not in hisactophilin (I85, H88, H91, and Y92).
Fig. 3.
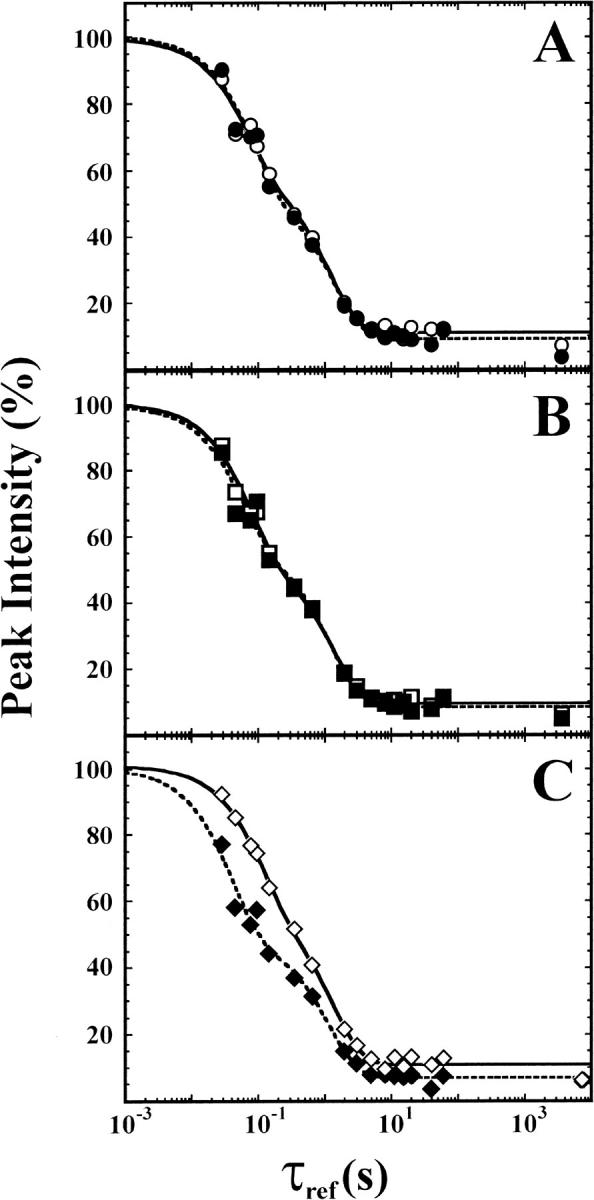
Protection data averaged for different groups of amides. (A) NHs protected by long range H-bonds (solid circles) vs. NHs protected by hairpins (open circles). (B) NHs in β-strands 6–10 corresponding to the most rapidly protected amides in IL-1β (solid squares) vs. NHs in the rest of the protein (open squares). (C) NHs in β-strands 4–8 (solid diamonds) vs. NHs corresponding to the slowest protected amides in IL-1β (open diamonds). On the whole, the data are well fit using a double-exponential decay; however, for the slowest protected amides (e.g., see panel C), there may be an additional unresolved small amplitude (∼5%–10 % of total amplitude) slower phase. Fitted rate constants and amplitudes, as well as lists of amides included in each grouping, are given in Table 2.
Somewhat surprisingly, there is no significant difference in rates for amides protected by hairpin formation, compared to amides protected by formation of long-range interactions (Fig. 3A ▶; Table 2). However, NHs protected by formation of strands 4–8 have on average the fastest protection rates, while NHs protected by formation of strands 1–3 and 10–12 have on average the slowest rates (Fig. 3C ▶; Table 2). Although the differences in averaged rates are not large, they are significant and are also evident from the inspection of rates for individual amides. Thus, hisactophilin appears to form a folding intermediate(s) in which strands 4–8 are structured.
Discussion
To the best of our knowledge, this is the first report of apparently two-state folding kinetics for a β-trefoil protein. It should be noted that, although the folding data for hisactophilin at pH 5.7 and 7.7 in H2O fit a two-state model, this does not prove the absence of intermediates (for reviews, see Roder and Colon 1997 ; Fersht 1999). For example, a high-energy intermediate may be populated, albeit at very low levels, even under destabilizing solution conditions at pH 5.7. In this case, the presence of the intermediate would be very difficult to detect from the kinetic data. It is generally accepted that folding data should be interpreted in terms of the simplest model that can account for all of the available data. Consequently, we will consider folding of hisactophilin to be effectively two-state at pH 5.7 and 7.7 in H2O and at least three-state at pH 7.8 in D2O. A similar switch from two-state to multistate kinetics has also been observed for other proteins as intermediates become stabilized and more highly populated with increasingly stabilizing solution conditions (Roder and Colon 1997).
It is noteworthy that the folding rate for hisactophilin at pH 5.7 in H2O is very slow, while at pH 7.7 in H2O it is increased >10,000-fold and is in the mid-range of rates observed for two-state folding proteins (Plaxco et al. 2000). Thus, folding of β-trefoil proteins is not necessarily very slow intrinsically, contrary to previous suggestions based on experiments on IL-1β (Varley et al. 1993), acidic FGF (Samuel et al. 2001) and basic FGF (Estape and Rinas 1999).
Experimental and predicted folding rates for β-trefoil proteins
The two-state folding rates for many proteins are strongly correlated with native state contact order, which is a measure of the average sequence separation between contacting residues in the native state (Plaxco et al. 2000). The contact order for β-trefoil proteins is generally quite low (∼0.11–0.18), that is, the average sequence separation is low, due to the many adjacent, short β-hairpins in the structure. Consequently, contact order predicts that these proteins should fold quite rapidly. Hisactophilin tends to have shorter loops and β-strands than the other β-trefoil proteins, and so it has the lowest contact order of 0.11, which corresponds to a very fast predicted folding rate of ∼10,000 s−1 (Plaxco et al. 2000). Under the most stabilizing conditions in which two-state kinetics appear to occur for hisactophilin (i.e., at pH 7.7 in H2O, the experimental folding rate is ∼100 s−1). This rate is considerably lower than the predicted rate, and the 50,000-fold reduced folding rate at pH 5.7 represents one of the largest reported outliers compared to the predicted rate (Plaxco et al. 2000). It has been pointed out that there are two cases where experimental folding rates can be slower than rates predicted by contact order: (1) under destabilizing solution conditions and (2) when intermediates are formed (Plaxco et al. 2000). Hisactophilin has relatively low stability at pH 5.7; hence, the first case probably applies under these conditions. Under more stabilizing conditions at pH 7.7 in H2O, perhaps some undetected intermediate formation is occurring, and so the second case may apply. With regard to the large discrepancy between the predicted and experimental rate at pH 5.7, it is worth noting that for proteins such as hisactophilin, which have native-like transition states (vide infra), folding rates may depend very strongly on solution conditions. Thus large deviations from contact order predicted rates are most likely to occur when folding rates are measured under destabilizing solution conditions.
β-trefoil proteins have nativelike transition states
A crude measure of transition structure is given by the average solvent exposure of the transition state, βT, which can be calculated from the denaturant dependencies of ΔGu and unfolding rates (Jackson 1998). The available βT values for β-trefoil protein are all quite high (∼0.71 for hisactophilin, Table 1; 0.69 for acidic FGF [Samuel et al. 2001]; 0.83 for basic FGF [Estape and Rinas 1999]; 0.92 for IL-1β [Chrunyk et al. 1993]), indicating that these proteins all have native-like transition states for folding. Similar βT values among structurally related proteins also have been observed for other folds (Gunasekaran et al. 2001). Note that it is not possible to determine from βT values whether the structure of the transition state is conserved; this requires high-resolution φ-value analysis (Fersht et al. 1992), which is not available for β-trefoil proteins. However, the structural details of folding intermediates can be compared using NMR-detected quenched-flow H/D exchange experiments (Roder et al. 1988; Udgaonkar and Baldwin 1988).
Similarities and differences in folding intermediates for β-trefoil proteins
Quenched-flow H/D exchange data are now available for three β-trefoil proteins: IL-1β (Varley et al. 1993; Heidary et al. 1997), acidic FGF (Samuel et al. 2001) and hisactophilin. The results obtained for these three proteins vary quite substantially (Fig. 4 ▶). For IL-1β, it was found that many amides in strands 6–10 and one amide in strand 4 were protected first, with rates of ∼1–0.5 s−1. This was followed by protection of a small group of additional amides with rates of ∼0.05–0.03 s−1 and finally by protection of the remaining amides, concentrated in strands 1–3 and 10–12, with rates much slower than 0.03 s−1. For acidic FGF, a few amides in strands 1 and 12 were protected within the dead time of the experiment (i.e., rates >150 s−1). Strands 1, 4, 9, and 10 were considered to fold first, with rates of ∼1–0.3 s−1, followed by formation of strands 5 and 11 and then formation of the remaining strands, with rates of ∼0.1 s−1. On the whole, the differences in time scale of protection between the strands in acidic FGF are relatively small, and all strands contain both relatively slowly and relatively rapidly protected amides. For hisactophilin, generally amides are protected in a two-exponential process, with rates of ∼20–10 s−1 and ∼1–0.2 s−1 for the fast and slow phases, respectively. Averaging of data for amides in different structural elements suggests that in hisactophilin strands 4–8 fold first, while strands 1–3 and 10–12 fold last.
Given that folding rates are likely to vary with protein stability and that the stability of IL-1β and acidic FGF were not reported for the exact conditions of the quench-flow experiments, comparison of absolute folding rates between the different proteins is difficult. However, the range of rates and the relative rates of protection of different elements of structure may be compared. On the whole, there is little or no burst phase of amide proton protection in the dead time of the experiment for these proteins. This suggests that formation of stable hydrogen bonds in this relatively large, all-β domain is inherently fairly slow. Note that slow formation of hydrogen bonds is not necessarily characteristic of large all-β proteins because slow protection of amides was observed for cellular retinoic acid binding protein I (Clark et al. 1997), but rapid protection was observed for fibronectin domain (Plaxco et al. 1996) and the C-terminal domain of the cell-surface receptor protein CD2 (Parker et al. 1997). The range of protection rates for different amides also varies substantially for different all-β proteins. In particular, the ranges in the protection rates for hisactophilin and acidic FGF appear to be considerably smaller than for IL-1β. Thus, a folding intermediate is much more prominent for IL-1β than for the other two proteins. This difference cannot be attributed to a higher stability of IL-1β (Makhatadze et al. 1994; Covalt et al. 2001) because hisactophilin is also highly stable under quenched-flow conditions (8.2 kcal mol−1, Table 1).
Common elements of structure do not appear to be uniformly conserved among intermediates for hisactophilin, IL-1β and acidic FGF; however, there are some pairwise similarities between the proteins. Strands 1–3 and 10–12 appear to form relatively slowly in both IL-1β and hisactophilin, while the central β-strands fold faster (Fig. 4 ▶; Table 2). There is a structural shift, though, from fast formation of strands 6–10 in IL-1β to strands 4–8 in hisactophilin. In contrast, for acidic FGF, strands 1 and 12 appear to dock first, while strands 3 and 7, for example, may form particularly late. In IL-1β and acidic FGF, strands 9 and 10 appear to fold early, but this is not observed in hisactophilin. Drawing the above comparisons together, it is clear that experimentally there are significant differences in the structures and in the kinetic prominence of the folding intermediates for the different β-trefoil proteins.
When attempting to rationalize commonalities and differences in folding of the β-trefoil proteins, it is useful to consider also predictions from folding simulations. The folding pathway of IL-1β has been simulated using a simple model based on native state topology (Clementi et al. 2000). The simulation predicted a folding intermediate in which strands 4–8 but not strands 9 and 10 have a native-like topology. The lack of formation of strands 9 and 10 in the simulation was attributed to underrepresentation of the strength of native interactions involving a cluster of aromatic residues (Fig. 4 ▶). Thus, the simulation results suggest that the topology for β-trefoil proteins may favor formation of a folding intermediate in which the central strands are structured.
It is becoming increasingly evident from studies on various proteins (for reviews, see Grantcharova et al. 2001; Guerois and Serrano 2001; Gunasekaran et al. 2001) that specific side-chain interactions can significantly modulate folding pathways. Consequently, it is important to consider what specific interactions may be influencing the folding of the β-trefoil proteins. Considering the experimental and theoretical data, as well as the structures of the β-trefoil proteins, it appears that differences in the folding intermediates may relate to differences in nonconserved hydrophobic clusters. The above-mentioned cluster of aromatic residues near strands 9 and 10 occurs in both IL-1β and acidic FGF but not in hisactophilin (Fig. 4 ▶). Early formation of strands 9 and 10, therefore, may be stabilized by hydrophobic interactions of this cluster in IL-1β and acidic FGF but not in hisactophilin. The folding intermediate for IL-1β may be further stabilized, and hence become particularly prominent in the folding kinetics, due to additional hydrophobic interactions involving the long loop, or microdomain, between strands 7 and 8 (Fig. 4 ▶; Chrunyk and Wetzel 1993; Finke et al. 2000). The microdomain contains various hydrophobic residues, which pack against each other and against strands 6 and 7 in native IL-1β (Priestle et al. 1989). Analogous hydrophobic interactions cannot be made by the corresponding loops in hisactophilin and acidic FGF, which are considerably shorter and more hydrophilic (Fig. 4 ▶). Computational and experimental studies of the folding of larger proteins have suggested that slow tracks of folding can arise due to the formation of misfolded intermediates containing stabilizing native and nonnative interactions of surface residues, which must be broken to reach the native state (for reviews, see Dinner and Karplus 1999; Dinner et al. 2000; Englander 2000). This suggests that formation of interactions of surface residues that inhibit folding may occur to a larger extent in IL-1β than in hisactophilin and acidic FGF.
In conclusion, the investigations of the folding of the β-trefoil proteins, hisactophilin, IL-1β, and acidic and basic FGF reveal that these proteins all form native-like transition states and folding intermediates. The detailed interactions and kinetic prominence of the folding intermediates vary considerably among the different proteins. Interactions involving nonconserved surface residues may play a significant role in modulating intermediate stability, and hence the observed folding rates, for the different β-trefoil proteins. These results provide important data for extending understanding of folding from two-state proteins to more complex systems. They also provide insight into the relationship between kinetic intermediates and structural fluctuations that occur in native proteins, which we have investigated for hisactophilin using native state exchange experiments (Houliston et al. 2002).
Materials and methods
Equilibrium and kinetic fluorescence and CD measurements
Equilibrium and kinetic measurements were made at 20°C using a Jasco J715 CD spectropolarimeter thermostatted with an Elfin ELDC5D4 Peltier cell or on a Spex Fluorolog-22 spectrofluorometer with a Neslab RTE-211 water bath. Hisactophilin contains no tryptophan; hence, fluorescence arises mainly from three partially buried tyrosine residues which can be monitored using excitation and emission wavelengths of 277 nm and 306 nm, respectively (Liu et al. 2001). The CD spectrum of hisactophilin is relatively weak because the protein does not contain any helical structure; denaturation is most readily monitored by CD at 227 nm, where the signal arises from both the structure of the peptide backbone and aromatic side chains (Liu et al. 2001).
Urea denaturation curves
Protein and buffers were prepared as described previously (Liu et al. 2001). Lyophilized hisactophilin was dissolved to a concentration of 2–3 mg mL−1 in 500 mM potassium phosphate buffer, 10 mM DTT, and 10 mM EDTA in either H2O or D2O and then aliquoted and diluted 10-fold using appropriate volumes of water and 10 M protonated or deuterated urea. Reported pH values are for pHread, uncorrected for isotope effect. Samples were equilibrated for at least 2 h at 20°C before making optical measurements.
Denaturation curve data were fit to a two-state transition between the native and denatured state using the binomial extrapolation method (Johnson and Fersht 1995; Filimonov et al. 1999) according to the equation:
 |
(1) |
where Y is the observed signal, YN is the signal of the native state, YU is the signal of the unfolded state in the absence of urea, SU is the denaturant dependence of the signal of the unfolded state, m1 and m2 are constants describing the denaturant dependence of the Gibbs free energy of unfolding, ΔGuo is the Gibbs free energy of unfolding in the absence of denaturant, R is the gas constant, and T is absolute temperature (Liu et al. 2001). m2 was fixed to 0.072 based on combined analysis of urea and thermal denaturation data (Liu et al. 2001). Data were fit using nonlinear least-squares fitting by the program Kaleidagraph (Synergy Software).
Optically monitored kinetics
Concentrated protein solutions were prepared by dissolving lyophilized protein at desired concentration in buffer/urea solutions. Kinetics were initiated by diluting the protein solution 6- to 10-fold using appropriate solutions. For rates slower than ∼0.01 s−1, reactions were initiated by manual mixing; faster rates were measured using an SFM4/Q (Molecular Kinetics) interfaced to the Fluorolog-22/Neslab water-bath system.
Raw kinetic data were fit to a single- or double-exponential equation using Biokine 2.10 software (Molecular Kinetics). The natural logarithm of the unfolding rate of hisactophilin at pH 5.7 versus urea concentration is not linear (Fig. 1A ▶). Similar results have been obtained for many other proteins (Matouschek et al. 1994; Viguera et al. 1994; Oliveberg et al. 1998), for which unfolding has been fit using a second-order polynomial. Hisactophilin unfolding rates, therefore, were fit using:
 |
(2) |
and complete kinetic data were fit using:
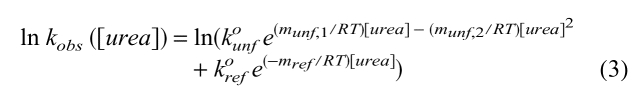 |
(3) |
where kunfo and krefo are the unfolding and refolding rate constants in the absence of denaturant, respectively. mref describes the linear denaturant dependence of the natural logarithm of refolding rate. munf,1 and munf,2 describe a quadratic denaturant dependence for the natural logarithm of unfolding rate. The nonlinearity is not apparent for the data at higher pH because unfolding rates cannot be acquired over a sufficiently large range of denaturant concentrations; however, data can be well fit using the value of munf,2 obtained at pH 5.7. ΔGuo was then calculated using
 |
(4) |
and the solvent exposure of the transition state, βT, was calculated using (Jackson 1998):
 |
(5) |
Quenched-flow H/D exchange monitored by NMR
Denatured perdeutero hisactophilin (8.0 mg mL−1 in 6.4 M urea-D4, 250 mM potassium phosphate buffer at pH 7.8, 5 mM DTT, 5 mM EDTA, D2O) was diluted fivefold with D2O, incubated for a series of set refolding times (τref), pH-pulsed using 5 volumes of 62.5 mM glycine/sodium glycinate in H2O (final pH was 9.52 for 29 ms), and pH-quenched with 4 volumes of 112.5 mM triethanolamine buffer in H2O (final pH was 7.7). The sample was immediately concentrated and exchanged by ultrafiltration into 50 mM triethanolamine buffer at pH 7.8 in D2O. Final sample volumes (0.5 mL) contained ∼5 mg mL−1 hisactophilin. NMR experiments were performed within 2 h after concentration. 1H-15N HSQC spectra were acquired as described previously (Hammond et al. 1998) using 64 t1 increments and processed using Felix 97.0 (Molecular Simulations, Inc). Spectra were normalized for protein concentration using the intensity of the resolved methyl peak for Ile 48 at −0.97 ppm in a 1D 1H spectrum.
Samples with folding times from 28.7 ms to 646 ms or 2 s to 60 s were prepared using the SFM4/Q instrument or manual mixing, respectively. For unfolded control samples, protein was manually diluted with D2O, followed by addition of labeling buffer and then heating to 70°C for 5 min. Solution was then cooled and diluted with quench buffer. Intensities of the peaks from unfolded control samples were used to normalize intensities for spectra of refolded samples. Fully refolded control samples were prepared by manual mixing, with a 2-h refolding time. Using a labeling buffer of pH 8.93 gave the same results as using pH 9.52, confirming sufficient intensity of labeling pulse. At pH 9.52 the average time constant for exchange for the amides monitored is ∼0.5 msec; therefore, protons are excluded from sites where exchange is retarded >60-fold.
Acknowledgments
We thank Molecular Kinetics, Inc. for generous technical assistance. This research was funded by the Natural Sciences and Engineering Research Council of Canada.
The publication costs of this article were defrayed in part by payment of page charges. This article must therefore be hereby marked "advertisement" in accordance with 18 USC section 1734 solely to indicate this fact.
Abbreviations
IL-1β, interleukin-1β
FGF, fibroblast growth factor
NHs, amide protons
H/D, hydrogen/deuterium
NMR, nuclear magnetic resonance
MS, mass spectrometry
CD, circular dichroism
Article and publication are at http://www.proteinscience.org/cgi/doi/10.1110/ps.31702.
References
- Blaber, M., DiSalvo, J., and Thomas, K.A. 1996. X-ray crystal structure of human acidic fibroblast growth factor. Biochemistry 35 2086–2094. [DOI] [PubMed] [Google Scholar]
- Chrunyk, B.A. and Wetzel, R. 1993. Breakdown in the relationship between thermal and thermodynamic stability in an interleukin-1b point mutant modified in a surface loop. Protein Eng. 6 733–738. [DOI] [PubMed] [Google Scholar]
- Chrunyk, B.A., Evans, J., Lillquist, J., Young, P., and Wetzel, R. 1993. Inclusion body formation and protein stability in sequence variants of interleukin-1β. J. Biol. Chem. 268 18053–18061. [PubMed] [Google Scholar]
- Clark, P.L., Liu, Z.P., Rizo, J., and Gierasch, L.M. 1997. Cavity formation before stable hydrogen bonding in the folding of a β-clam protein. Nat. Struct. Biol. 4 883–886. [DOI] [PubMed] [Google Scholar]
- Clementi, C., Jennings, P.A., and Onuchic, J.N. 2000. How native-state topology affects the folding of dihydrofolate reductase and interleukin-1β. Proc. Natl. Acad. Sci. 97 5871–5876. [DOI] [PMC free article] [PubMed] [Google Scholar]
- Covalt Jr., J.C., Roy, M., and Jennings, P.A. 2001. Core and surface mutations affect folding kinetics, stability and cooperativity in IL-1β: Does alteration in buried water play a role? J. Mol. Biol. 307 657–669. [DOI] [PubMed] [Google Scholar]
- Craig, S., Schmeissner, U., Wingfield, P., and Pain, R.H. 1987. Conformation, stability, and folding of interleukin-1β. Biochemistry 26 3570–3576. [DOI] [PubMed] [Google Scholar]
- Dinner, A.R. and Karplus, M. 1999. The thermodynamics and kinetics of protein folding: A lattice model analysis of multiple pathways with intermediates. J. Phys. Chem. B 103 7976–7994. [Google Scholar]
- Dinner, A.R., Sali, A., Smith, L.J., Dobson, C.M., and Karplus, M. 2000. Understanding protein folding via free-energy surfaces from theory and experiment. Trends Biochem. Sci. 25 331–339. [DOI] [PubMed] [Google Scholar]
- Englander, S.W. 2000. Protein folding intermediates and pathways studied by hydrogen exchange. Annu. Rev. Biophys. Biomol. Struct. 29 213–238. [DOI] [PubMed] [Google Scholar]
- Estape, D. and Rinas, U. 1999. Folding kinetics of the all-β-sheet protein human basic fibroblast growth factor, a structural homolog of interleukin-1β. J. Biol. Chem. 274 34083–34088. [DOI] [PubMed] [Google Scholar]
- Estape, D., van den Heuvel, J., and Rinas, U. 1998. Susceptibility towards intramolecular disulphide-bond formation affects conformational stability and folding of human basic fibroblast growth factor. Biochem. J. 335 343–349. [DOI] [PMC free article] [PubMed] [Google Scholar]
- Fersht, A.R. 1999. Structure and mechanism in protein science, 2nd ed. W.H. Freeman and Co., New York.
- Fersht, A.R., Matouschek, A., and Serrano, L. 1992. The folding of an enzyme. I. Theory of protein engineering analysis of stability and pathway of protein folding. J. Mol. Biol. 224 771–782. [DOI] [PubMed] [Google Scholar]
- Filimonov, V.V., Azuaga, A.I., Viguera, A.R., Serrano, L., and Mateo, P.L. 1999. A thermodynamic analysis of a family of small globular proteins: SH3 domains. Biophys. Chem. 77 195–208. [DOI] [PubMed] [Google Scholar]
- Finke, J.M., Roy, M., Zimm, B.H., and Jennings, P.A. 2000. Aggregation events occur prior to stable intermediate formation during refolding of interleukin-1β. Biochemistry 39 575–583. [DOI] [PubMed] [Google Scholar]
- Grantcharova, V., Alm, E.J., Baker, D., and Horwich, A.L. 2001. Mechanisms of protein folding. Curr. Opin. Struct. Biol. 11 70–82. [DOI] [PubMed] [Google Scholar]
- Guerois, R., and Serrano, L. 2001. Protein design based on folding models. Curr. Opin. Struct. Biol. 11 101–106. [DOI] [PubMed] [Google Scholar]
- Gunasekaran, K., Eyles, S.J., Hagler, A.T., and Gierasch, L.M. 2001. Keeping it in the family: Folding studies of related proteins. Curr. Opin. Struct. Biol. 11 83–93. [DOI] [PubMed] [Google Scholar]
- Habazettl, J., Gondol, D., Wiltscheck, R., Otlewski, J., Schleicher, M., and Holak, T.A. 1992. Structure of hisactophilin is similar to interleukin-1β and fibroblast growth factor. Nature 359 855–858. [DOI] [PubMed] [Google Scholar]
- Hammond, M.S., Houliston, R.S., and Meiering, E.M. 1998. Two-dimensional 1H and 15N NMR titration studies of hisactophilin. Biochem. Cell Biol. 76 294–301. [DOI] [PubMed] [Google Scholar]
- Heidary, D.K., Gross, L.A., Roy, M., and Jennings, P.A. 1997. Evidence for an obligatory intermediate in the folding of interleukin-1β. Nat. Struct. Biol. 4 725–731. [DOI] [PubMed] [Google Scholar]
- Hollecker, M. and Creighton, T.E. 1983. Evolutionary conservation and variation of protein folding pathways. Two protease inhibitor homologues from black mamba venom. J. Mol. Biol. 168 409–437. [DOI] [PubMed] [Google Scholar]
- Hooke, S.D., Radford, S.E., and Dobson, C.M. 1994. The refolding of human lysozyme: A comparison with the structurally homologous hen lysozyme. Biochemistry 33 5867–5876. [DOI] [PubMed] [Google Scholar]
- Houliston, R.S., Liu, C., Singh, L.M.R., and Meiering, E.M. 2002. pH- and urea-dependence of amide hydrogen/deuterium exchange rates in the β-trefoil protein, hisactophilin. Biochemistry (in press). [DOI] [PubMed]
- Jackson, S.E. 1998. How do small single-domain proteins fold? Fold. Des. 3 R81–R91. [DOI] [PubMed] [Google Scholar]
- Jackson, S.E. and Fersht, A.R. 1991. Folding of chymotrypsin inhibitor 2. 1. Evidence for a two-state. Biochemistry 30 10428–10435. [DOI] [PubMed] [Google Scholar]
- Johnson, C.M. and Fersht, A.R. 1995. Protein stability as a function of denaturant concentration: Thermal stability of barnase in the presence of urea. Biochemistry 34 6795–6804. [DOI] [PubMed] [Google Scholar]
- Koradi, R., Billeter, M., and Wuthrich, K. 1996. MOLMOL: A program for display and analysis of macromolecular structures. J. Mol. Graph. 14 51–55. [DOI] [PubMed] [Google Scholar]
- Liu, C., Chu, D., Wideman, R., Houliston, R.S., Wong, H.J., and Meiering, E.M. 2001. Thermodynamics of denaturation of hisactophilin, a β-trefoil protein. Biochemistry 40 3817–3827. [DOI] [PubMed] [Google Scholar]
- Makhatadze, G.I., Clore, G.M., Gronenborn, A.M., and Privalov, P.L. 1994. Thermodynamics of unfolding of the all β-sheet protein interleukin-1β. Biochemistry 33 9327–9332. [DOI] [PubMed] [Google Scholar]
- Matouschek, A., Matthews, J.M., Johnson, C.M., and Fersht, A.R. 1994. Extrapolation to water of kinetic and equilibrium data for the unfolding of barnase in urea solutions. Protein Eng. 7 1089–1095. [DOI] [PubMed] [Google Scholar]
- Murzin, A.G., Lesk, A.M., and Chothia, C. 1992. β-Trefoil fold. Patterns of structure and sequence in the Kunitz inhibitors interleukins-1β and 1α and fibroblast growth factors. J. Mol. Biol. 223 531–543. [DOI] [PubMed] [Google Scholar]
- Murzin, A.G., Brenner, S.E., Hubbard, T., and Chothia, C. 1995. SCOP: A structural classification of proteins database for the investigation of sequences and structures. J. Mol. Biol. 247 536–540. [DOI] [PubMed] [Google Scholar]
- Nishimura, C., Prytulla, S., Jane Dyson, H., and Wright, P.E. 2000. Conservation of folding pathways in evolutionarily distant globin sequences. Nat. Struct. Biol. 7 679–686. [DOI] [PubMed] [Google Scholar]
- Oliveberg, M. 2001. Characterisation of the transition states for protein folding: Towards a new level of mechanistic detail in protein engineering analysis. Curr. Opin. Struct. Biol. 11 94–100. [DOI] [PubMed] [Google Scholar]
- Oliveberg, M., Tan, Y.J., Silow, M., and Fersht, A.R. 1998. The changing nature of the protein folding transition state: Implications for the shape of the free-energy profile for folding. J. Mol. Biol. 277 933–943. [DOI] [PubMed] [Google Scholar]
- Parker, M.J., Dempsey, C.E., Lorch, M., and Clarke, A.R. 1997. Acquisition of native β-strand topology during the rapid collapse phase of protein folding. Biochemistry 36 13396–13405. [DOI] [PubMed] [Google Scholar]
- Plaxco, K.W., Spitzfaden, C., Campbell, I.D., and Dobson, C.M. 1996. Rapid refolding of a proline-rich all-β-sheet fibronectin type III module. Proc. Natl. Acad. Sci. 93 10703–10706. [DOI] [PMC free article] [PubMed] [Google Scholar]
- Plaxco, K.W., Simons, K.T., Ruczinski, I., and Baker, D. 2000. Topology, stability, sequence, and length: Defining the determinants of two-state protein folding kinetics. Biochemistry 39 11177–11183. [DOI] [PubMed] [Google Scholar]
- Priestle, J.P., Schar, H.P., and Grutter, M.G. 1989. Crystallographic refinement of interleukin-1β at 2.0 Å resolution. Proc. Natl. Acad. Sci. 86 9667–9671. [DOI] [PMC free article] [PubMed] [Google Scholar]
- Roder, H. and Colon, W. 1997. Kinetic role of early intermediates in protein folding. Curr. Opin. Struct. Biol. 7 15–28. [DOI] [PubMed] [Google Scholar]
- Roder, H., Elove, G.A., and Englander, S.W. 1988. Structural characterization of folding intermediates in cytochrome c by H-exchange labelling and proton NMR. Nature 335 700–704. [DOI] [PMC free article] [PubMed] [Google Scholar]
- Samuel, D., Kumar, T.K., Srimathi, T., Hsieh, H., and Yu, C. 2000. Identification and characterization of an equilibrium intermediate in the unfolding pathway of an all β-barrel protein. J. Biol. Chem. 275 34968–34975. [DOI] [PubMed] [Google Scholar]
- Samuel, D., Kumar, T.K., Balamurugan, K., Lin, W.Y., Chin, D.H., and Yu, C. 2001. Structural events during the refolding of an all β-sheet protein. J. Biol. Chem. 276 4134–4141. [DOI] [PubMed] [Google Scholar]
- Silow, M. and Oliveberg, M. 1997. Transient aggregates in protein folding are easily mistaken for folding intermediates. Proc. Natl. Acad. Sci. 94 6084–6086. [DOI] [PMC free article] [PubMed] [Google Scholar]
- Silow, M., Tan, Y.J., Fersht, A.R., and Oliveberg, M. 1999. Formation of short-lived protein aggregates directly from the coil in two-state folding. Biochemistry 38 13006–13012. [DOI] [PubMed] [Google Scholar]
- Udgaonkar, J.B. and Baldwin, R.L. 1988. NMR evidence for an early framework intermediate on the folding pathway of ribonuclease A. Nature 335 694–699. [DOI] [PubMed] [Google Scholar]
- Varley, P., Gronenborn, A.M., Christensen, H., Wingfield, P.T., Pain, R.H., and Clore, G.M. 1993. Kinetics of folding of the all-β sheet protein interleukin-1β. Science 260 1110–1113. [DOI] [PubMed] [Google Scholar]
- Viguera, A.R., Martinez, J.C., Filimonov, V.V., Mateo, P.L., and Serrano, L. 1994. Thermodynamic and kinetic analysis of the SH3 domain of spectrin shows a two-state folding transition. Biochemistry 33 2142–2150. [DOI] [PubMed] [Google Scholar]