Abstract
The binding interactions of small molecules with carbonic anhydrase II were used as model systems to compare the reaction constants determined from surface- and solution-based biophysical methods. Interaction data were collected for two arylsulfonamide compounds, 4-carboxybenzenesulfonamide (CBS) and 5-dimethyl-amino-1-naphthalene-sulfonamide (DNSA), binding to the enzyme using surface plasmon resonance, isothermal titration calorimetry, and stopped-flow fluorescence. We demonstrate that when the surface plasmon resonance biosensor experiments are performed with care, the equilibrium, thermodynamic, and kinetic constants determined from this surface-based technique match those acquired in solution. These results validate the use of biosensor technology to collect reliable data on small molecules binding to immobilized macromolecular targets. Binding kinetics were shown to provide more detailed information about complex formation than equilibrium constants alone. For example, although carbonic anhydrase II bound DNSA with twofold higher affinity than CBS, kinetic analysis revealed that CBS had a fourfold slower dissociation rate. Analysis of the binding and transition state thermodynamics also revealed significant differences in the enthalpy and entropy of complex formation. The lack of labeling requirements, high information content, and high throughput of surface plasmon resonance biosensors will make this technology an important tool for characterizing the interactions of small molecules with enzymes and receptors.
Keywords: Isothermal titration calorimetry, kinetics, optical biosensor, stopped-flow fluorescence, surface plasmon resonance, thermodynamics
Surface plasmon resonance (SPR)-based biosensors, such as Biacore, are commonly employed to determine binding constants for macromolecular interactions (Myszka 1999a; Rich and Myszka 2000). Recent improvements in experimental design (Myszka 2000) and data processing (Morton and Myszka 1998) make it now possible to routinely study the direct binding of small molecules (<500 Daltons) to macromolecular targets using Biacore technology (Markgren et al. 1998; Kampranis et al. 1999; Hämäläinen et al. 2000; Karlsson et al. 2000). This is expanding the role of the biosensor in drug discovery, but also has rekindled the debate regarding the reliability of binding constants determined from surface-based measurements. Biosensor-based reaction constants may not match those obtained from solution-based methods due to a variety of potential artifacts (Myszka 1997). For example, tethering a reactant to a surface could restrict its rotational freedom and diffusional properties, altering the reaction thermodynamics and binding kinetics. Biosensors also require that the reactant in solution be transported to and from the reaction surface in a rapid and uniform manner; otherwise, concentration gradients at the surface could affect the apparent rate constants (Myszka et al. 1998).
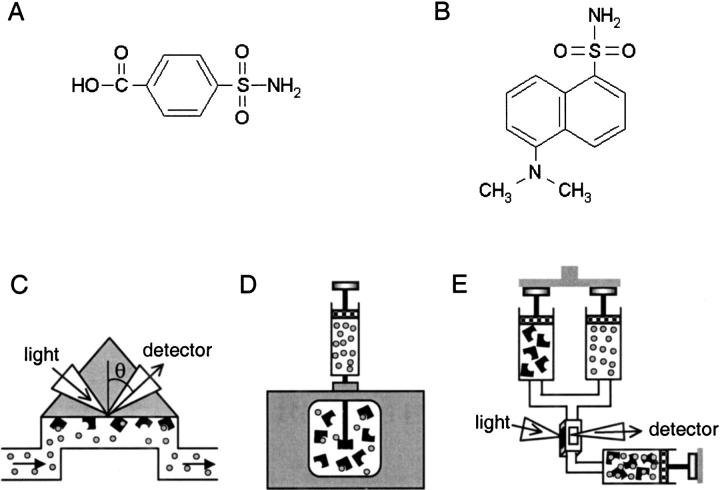
With the goal of evaluating how well SPR measurements match those performed in solution, we compared the binding equilibrium constants, thermodynamics, and kinetics for a small-molecule system measured on Biacore with two solution-based biophysical methods: isothermal titration calorimetry (ITC) and stopped-flow fluorescence (SFF). We focused our investigation on the binding of the enzyme carbonic anhydrase isozyme II (CA II, EC 4.2.1.1) (Chegwidden and Carter 2000) with two arylsulfonamide compounds, 4-carboxybenzenesulfonamide (CBS) and the fluorescent 5-dimethyl-amino-1-naphthalenesulfonamide, commonly known as dansylamide (DNSA) (Fig. 1A,B ▶).
Fig. 1.
Structures of the two arylsulfonamides and schematics of the three biophysical techniques used in this analysis. The interactions of either (A) 4-carboxybenzenesulfonamide (CBS) or (B) dansylamide (DNSA), with carbonic anhydrase II (CA II), were analyzed by (C) surface plasmon resonance (SPR), (D) isothermal titration calorimetry (ITC), and (E) stopped-flow fluorescence (SFF). In each assay, the compounds are denoted as circles and the protein is indicated as a black shape. In the ITC study of the CA II/DNSA interaction, however, the orientation of the assay was reversed to accommodate the low aqueous solubility of DNSA.
In the SPR analysis, kinetic and thermodynamic data were collected for the small molecules injected over CA II immobilized onto the biosensor surface (Fig. 1C ▶). ITC was employed to directly measure the complete thermodynamic profiles for the CA II/inhibitor interactions in solution (Fig. 1D ▶), and SFF was used to resolve the reaction kinetics for soluble CA II binding to DNSA (Fig. 1E ▶).
The data from our comparative study revealed that the binding constants determined from the biosensor were equivalent to those determined using solution-based methods. Our results demonstrate that, when properly applied, the biosensor is a reliable method for characterizing the kinetics and thermodynamics of binding interactions.
Results
SPR binding responses for CBS and DNSA over CA II surfaces
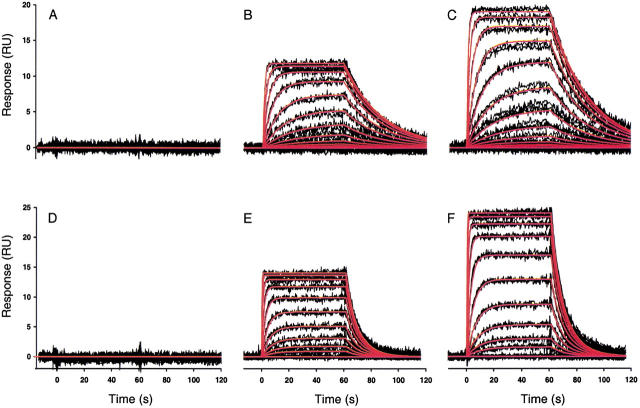
Measuring binding reactions using SPR biosensors requires that one of the binding partners be immobilized onto a surface. In the current study, the CA II protein was immobilized onto the dextran layer of a CM5 biosensor chip using amine coupling. Two CA II surfaces were prepared at different densities to test the effect of surface capacity on the binding responses. The highest density of active CA II protein was achieved at pH 5.0, which is approximately one unit below its isoelectric point of 5.9. The remaining two flow cells were left nonderivatized. One of these served as a reference surface to correct for bulk refractive index changes, while the other was used to show that neither compound bound nonspecifically to the dextran matrix. Samples containing either CBS (12 nM to 25 μM) or DNSA (20 nM to 10 μM) were randomized and injected in triplicate for 1 min each across the four flow cells. A flow rate of 100 μL/min was used to minimize mass transport limitations. Typical sensorgrams collected for the CA II/CBS and CA II/DNSA interactions are shown in Figure 2 ▶.
Fig. 2.
High-resolution kinetic analysis of the binding of CBS and DNSA to CA II surfaces using a Biacore 2000 biosensor. Black lines show biosensor data collected at 25°C for triplicate injections of CBS (12 nM to 25 μM) (A–C) and DNSA (20 nM to 10 μM) (D–F), across a nonderivatized surface (A and D) and two surfaces derivatized with different densities of CA II, 2400 RU (B and E) and 4600 RU (C and F). Sulfonamide concentrations were prepared by twofold serial dilutions in PBS buffer at pH 7.4. Red lines indicate the global fits obtained for both systems. CBS binding data were fit to a 1:1 interaction model, A + B = AB, whereas DNSA binding data were fit to a mass transport model, A0 = A, A + B = AB, due to its faster association rate.
The binding responses obtained for both the CBS and DNSA interactions with CA II surfaces revealed a complete binding cycle, because an equilibrium plateau was attained during the association phase with a return to baseline during the dissociation phase. Therefore, there was no need to regenerate the biosensor surface between sample injections for either compound. Binding responses were dependent on the surface density of the immobilized enzyme and on the injected analyte concentration, as expected for a second-order binding reaction. The superimposable binding responses from triplicate injections demonstrated the Biacore binding assay was very reproducible even though the compounds have low molecular masses. No binding was observed for either compound to the surface having no CA II protein immobilized (Fig. 2A,D ▶), demonstrating nonspecific binding was not an issue.
SPR kinetic analysis of the CA II/CBS interaction
The response data for the binding of CBS to both surface densities of CA II were fit simultaneously to a simple 1:1 interaction model, constraining the kinetic rate constants to a single value (Fig. 2B,C ▶). Local Rmax values were floated for each surface. Global fitting results in a more robust evaluation of the shared parameter values, which should be independent of the concentration of the analyte and the surface density of the immobilized ligand. The statistical behavior of the parameter estimates is also improved (Morton and Myszka 1998). A simple 1:1 interaction model provided an excellent fit to the data, as shown by the overlay of the simulated binding responses (red lines in Fig. 2B,C ▶) with the experimental data (black lines in Fig. 2B,C ▶).
A total of 14 data sets were collected for the CA II/CBS interaction by replicating the CBS concentration series, typically 40 nM to 20 μM, six times across 11 different CA II surfaces, which ranged in density from 2000 to 8400 RU, and were distributed over five different sensor chips. The mean kinetic rate constants describing the CA II/CBS interaction were calculated to be ka = 4.8 ± 0.2 × 10⁴ M−1s−1 and kd = 0.0365 ± 0.0006 s−1, which yielded an equilibrium dissociation constant of KD = 760 ± 30 nM at 25°C. These parameters are tabulated in Table 1.
Table 1.
Kinetic and thermodynamic constants determined for CA II/sulfonamide interactions using SPR, ITC, and SFF
| Analysis method | Sulfonamide compound | T (°C) | Expa | ka (M−1s−1) | kd (s−1) | KD (nM) | ΔG° (kcal/mol) | ΔH° (kcal/mol) | ΔS° [cal/(mol K)] |
| SPR | CBS | 25 | 6 | (4.8 ± 0.2) × 104 | 0.0365 ± 0.0006 | 760 ± 30 | −8.3 ± 0.3 | −11.6 ± 0.4 | −11 ± 1 |
| ITC | CBS | 25 | 5 | — | — | 730 ± 20 | −8.4 ± 0.2 | −11.9 ± 0.4 | −12 ± 1 |
| SPR | DNSA | 25 | 8 | (3.9 ± 0.5) × 105 | 0.13 ± 0.01 | 340 ± 40 | −8.8 ± 0.9 | −5.7 ± 0.4 | 11 ± 1 |
| ITC | DNSA | 25 | 2 | — | — | 360 ± 40 | −8.8 ± 0.9 | −4.8 ± 0.4 | 13 ± 1 |
| SFF | DNSA | 25 | 4 | (3.8 ± 0.9) × 105 | 0.16 ± 0.03 | 420 ± 100 | — | — | — |
| SPR | DNSA | 5 | 8 | (1.3 ± 0.2) × 105 | 0.023 ± 0.003 | 180 ± 20 | — | — | — |
| SFF | DNSA | 5 | 4 | (1.4 ± 0.2) × 105 | 0.022 ± 0.005 | 160 ± 40 | — | — | — |
a Number of times the interaction analysis was replicated.
All reported errors were obtained from the standard deviation of the experimental replicates.
SPR kinetic analysis of the CA II/DNSA interaction
A high-resolution binding analysis of DNSA (typically 2 nM to 5 μM) injected in triplicate across immobilized CA II was replicated eight times over eight protein surfaces (1500–8420 RU) prepared in pairs on four different sensor chips. Due to the faster association rate for the formation of the CA II/DNSA complex, a mass transport step was added to the reaction model (A0 = A, A + B = AB) (Fig. 2E,F ▶). The mass transport coefficient (kt), which describes the first step in the reaction, had a mean value of 2.65 ± 0.6 × 10⁷ RU M−1s−1. This is very similar to the predicted transport coefficient of 2.16 × 10⁷ RU M−1s−1 based on the molecular weight of the analyte, flow rate, and flow cell configuration (Myszka et al. 1998). The mean kinetic rate constants describing the CA II/DNSA interaction were calculated to be ka = 3.9 ± 0.5 × 10⁵ M−1s−1 and kd = 0.13 ± 0.01 s−1, which yielded a KD = 340 ± 40 nM at 25°C (see Table 1). It is interesting to note that although CA II binds to DNSA with higher affinity than CBS, the DNSA actually forms a kinetically weaker complex, as shown by a faster dissocation rate.
ITC thermodynamic analysis of CA II interactions with CBS and DNSA
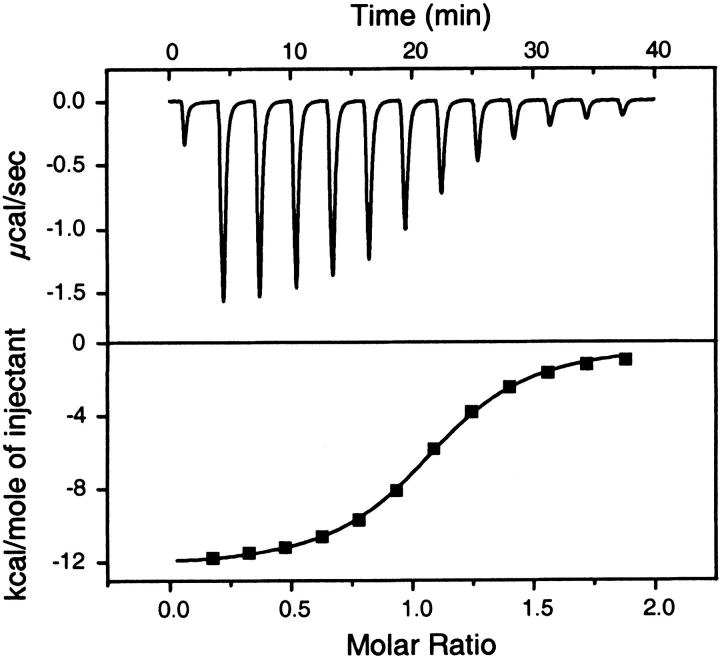
Interactions of CA II with both sulfonamides were assayed by isothermal titration calorimetry to determine solution-based equilibrium constants. ITC directly measures changes in heat that occur during complex formation. A typical calorimetric analysis of CBS binding to CA II is shown in Figure 3 ▶. Similar data were collected for the CA II/DNSA interaction; however, the orientation of the assay was reversed to account for low aqueous solubility of DNSA (data not shown). Importantly, all buffer and stock solutions were identical to those used in the biosensor assays (see Materials and Methods).
Fig. 3.
ITC data for the CA II/CBS interaction. The upper panel shows the rate of heat released as a function of time from 10-μL injections of 400 μM CBS titrated into a cell containing 20 μM CA II, measured at 25°C. The lower panel shows the integrated areas under the respective peaks in the top panel plotted against the molar ratio of CBS titrated into CA II. The calculated best-fit binding isotherm is shown in the lower panel.
The interactions of CA II with both sulfonamides were exothermic, releasing heat during complex formation. At a constant temperature of 25°C, the ITC assay was replicated five times for CBS and twice for DNSA, yielding equilibrium dissociation constants of KD = 730 ± 20 nM and KD = 360 ± 40 nM, respectively (Table 1). Within experimental error, these affinity values are identical to the values determined by SPR. The binding stoichiometries were calculated to be 0.97 ± 0.09 to 1 for CBS and 0.87 ± 0.08 to 1 for DNSA, indicating that each sulfonamide populated a single site per enzyme molecule, which was also consistent with the mechanism predicted by SPR analysis.
Although both compounds had favorable binding enthalpies, their values were significantly different, with ΔH = −11.9 ± 0.4 kcal/mol and −4.8 ± 0.4 kcal/mol for CBS and DNSA, respectively. The two sulfonamides bound with opposite changes in entropy (ΔS = −12 ± 1 and 13 ± 1 cal/mol K for CBS and DNSA, respectively), which led to similar overall changes in Gibbs free energy of −8.4 ± 0.2 kcal/mol and −8.8 ± 0.9 kcal/mol for CBS and DNSA, respectively.
Temperature dependence of CA II interactions with CBS and DNSA as determined by SPR
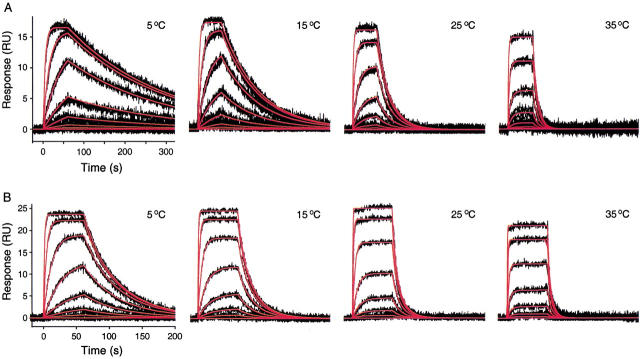
The ability to monitor binding reactions from 4 to 40°C using Biacore makes it possible to collect temperature-dependent binding constants on the biosensor (Roos et al. 1998; Myszka 2000). To compare surface-based thermodynamic parameters with the values determined in solution using titration calorimetery, binding data for the CA II/sulfonamide interactions were collected at 5, 15, 25, and 35°C on the biosensor, as shown in Figure 4 ▶. Excellent fits were obtained when the responses from each CA II reaction were fit to 1:1 binding models to extract temperature-dependent rate constants. A total of six replicate temperature-dependent data sets were collected for CBS. Similarly, a total of eight replicate data sets were collected for DNSA.
Fig. 4.
Temperature dependence of the biosensor binding response for CA II/compound interactions. (A) The black lines represent the biosensor responses obtained for a concentration series of CBS (40 nM to 10 μM) injected in triplicate across a CA II surface (4300 RU) at 5, 15, 25, and 35°C (see Materials and Methods). The red lines represent global fits to a simple bimolecular interaction model (A + B = AB). (B) The black lines represent duplicate injections of DNSA (7 nM to 5 μM) across a CA II surface (4200 RU) at 5, 15, 25, and 35°C. The red lines show the fits to a mass transport model (A0 = A, A + B = AB).
SPR analysis revealed that the affinity of both the CA II/CBS and CA II/DNSA interactions weakened as the temperature was increased from 5 to 35°C. The mean equilibrium dissociation constant (KD) for CBS binding increased almost eightfold, from 200 ± 30 nM to 1500 ± 200 nM over this temperature range, while the KD for DNSA increased only threefold, from 180 ± 20 to 490 ± 90 nM. In both cases, the temperature dependence of the KD was due to a larger increase in the dissociation rate constant (kd) than the association rate (ka). For CBS, the mean kd increased 23-fold from 0.0038 ± 0.0005 to 0.0871 ± 0.006 s−1 from 5 to 35°C, and for DNSA binding the kd increased 13-fold from 0.023 ± 0.003 to 0.30 ± 0.05 s−1. The effect of temperature on the association rate constants (ka) was less marked. For CBS, the mean ka increased threefold from 1.9 ± 0.1 × 10⁴ to 5.7 ± 0.4 × 10⁴ M−1s−1, and for DNSA it increased fivefold, from 1.3 ± 0.2 × 10⁵ to 6.0 ± 0.1 × 10⁵ M−1s−1.
van't Hoff analysis of SPR data
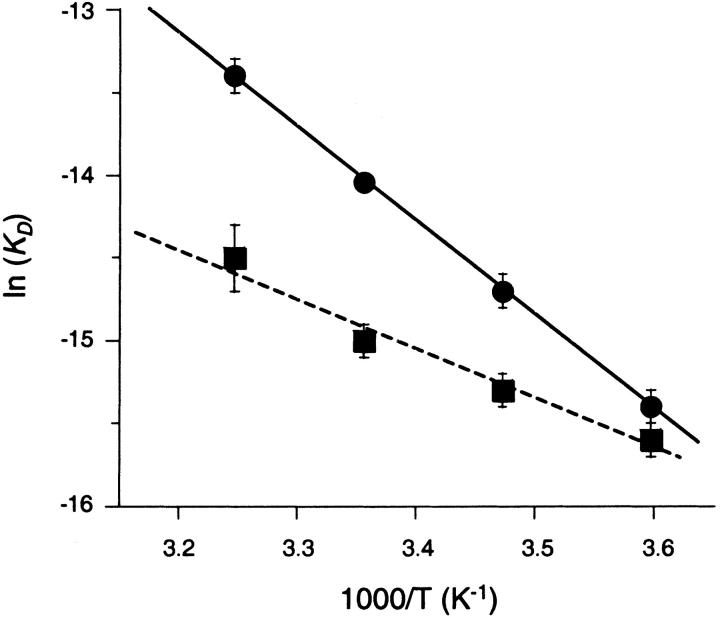
The equilibrium constants determined from the temperature-dependent SPR analyses were used to determine van't Hoff enthalpies by plotting ln(KD) versus 1/T. As shown in Figure 5 ▶, the van't Hoff plots are linear for both CBS and DNSA, which is consistent with an invariant binding mechanism across the temperature range studied. As shown in Table 1, the van't Hoff enthalpies and entropies determined for both compounds from SPR analysis were very similar to the thermodynamic constants measured by ITC.
Fig. 5.
van't Hoff plots for the CA II/CBS and CA II/DNSA interactions, determined from biosensor analysis. Circles and squares indicate data points for CBS and DNSA, respectively. The solid line shows a linear fit of three replicate CBS data sets, which yielded ΔH = −11.6 ± 0.4 kcal•mol−1, ΔS = −11 ± 1 cal mol−1 K−1, and a correlation coefficient of 0.9875 (1 indicates a perfect fit). The dashed line indicates a linear fit of 10 replicate DNSA data sets, which yielded ΔH = −5.7 ± 0.4 kcal mol−1 and ΔS = 11 ± 1 cal mol−1 K−1, and a correlation coefficient of 0.8863.
Stopped-flow kinetic analysis of the CA II/DNSA interaction
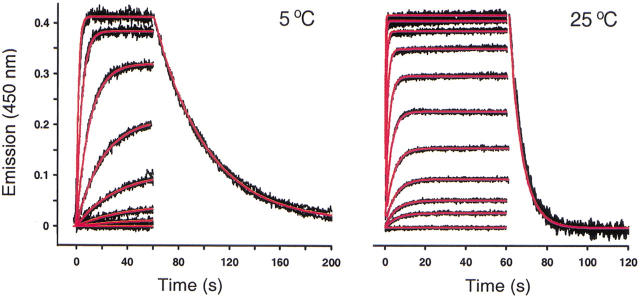
Having demonstrated that the binding thermodynamics from the biosensor matched the solution-based ITC measurements, we next determined how the reaction kinetics obtained from the biosensor compared to a purely solution-based kinetic assay. In this case, we choose to focus on the interaction of CA II with DNSA. DNSA undergoes a blue shift and a 10-fold increase in emission upon binding to CA II, making it ideal for measuring the binding kinetics in solution using stopped-flow fluorescence. Figure 6 ▶ shows a kinetic analysis of the CA II/DNSA interaction at two different temperatures, 5 and 25°C. Quadruplicate reactions for each DNSA concentration yielded superimposable traces, demonstrating that the association SFF measurements were reproducible. Because the displacement assay requires a separate experiment, only a single DNSA concentration was monitored to collect dissociation data at both temperatures. The association and dissociation data were fit simultaneously to a simple 1:1 interaction model. The rate constants determined from the SFF study (ka5°C = 1.4 ± 0.2 × 10⁵ M−1s−1, kd5°C = 0.022 ± 0.005 s−1; ka25°C = 3.8 ± 0.9 × 10⁵ M−1s−1, kd25°C = 0.16 ± 0.03 s−1) were similar to the rate constants determined by SPR at these temperatures (Table 1). Demonstrating the rate constants obtained by SPR agreed well with those measured in solution confirms the dependability of the SPR data. Because the kinetic rate constants from SPR are temperature dependent, these data can be used to characterize the transition states involved in the CA II/sulfonamide interactions for both compounds.
Fig. 6.
Kinetic analysis of the CA II/DNSA interaction as measured by SFF. The black lines represent four independent fluorescence traces generated for the interaction between CA II and DNSA at 5 and 25°C. In the association study, the final concentrations achieved by rapidly mixing the reactants were 5 nM CA II and (5°C) 60 nM to 5 μM DNSA and (25°C) 39 nM to 20 μM DNSA. A dissociation curve for the highest DNSA concentration was determined in a separate experiment, and is shown for each data set. Global fits to a single-site interaction model are shown in red.
Transition states analysis of SPR data
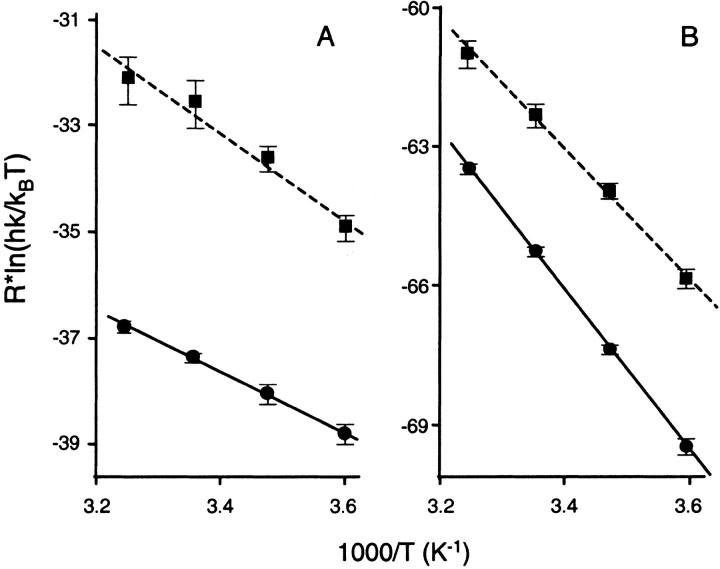
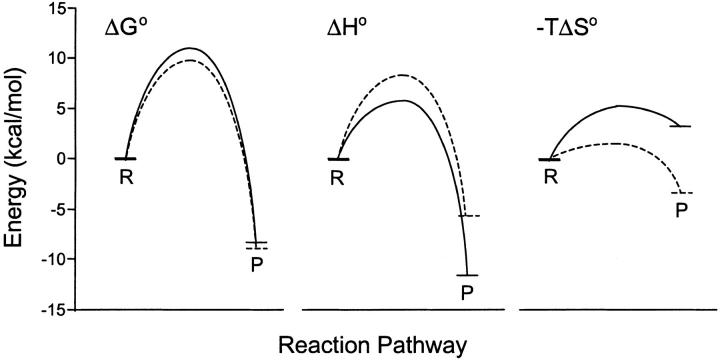
Applying transition state theory to the SPR rate constants yields the Eyring plots shown in Figure 7 ▶. The plots are linear, which is consistent with ΔH† and ΔS† for both reactions exhibiting no temperature dependence across the range studied (5–35°C). The activation parameters obtained for the binding of CA II to the two sulfonamides are summarized in Table 2. The reaction coordinates tracing the lowest energy continuous pathway between reactants and product on the potential energy surface for CBS and DNSA are shown in Figure 8 ▶. The species of maximum energy is defined by the transition state. Although the free energy path for both compounds is similar, the enthalpic and entropic terms for the transition state and the product are different, demonstrating unique thermodynamic parameters drive complex formation for CBS and DNSA with CA II.
Fig. 7.
Eyring plots for CA II/CBS and CA II/DNSA interactions in terms of (A) ka and (B) kd, determined from biosensor analyses. Circles and squares indicate data points for CBS and DNSA respectively. Solid and dashed lines denote the fits to the CBS and DNSA data, respectively.
Table 2.
Theoretical activation parameters determined for the CA II/sulfonamide interactionsa
| Activation parameter | CA II/CBS (n = 3) | CA II/DNSA (n = 8) |
| ΔG†a (kcal/mol) | 11.0 ± 0.3 | 9.7 ± 0.5 |
| ΔG†d (kcal/mol) | 19.4 ± 0.3 | 18.7 ± 0.4 |
| ΔH†a (kcal/mol) | 5.7 ± 0.3 | 8.2 ± 0.5 |
| ΔH†d (kcal/mol) | 17.3 ± 0.3 | 13.9 ± 0.4 |
| ΔS†a [cal/(mol K)] | −18 ± 1 | −5 ± 2 |
| ΔS†d [cal/(mol K)] | −7 ± 1 | −16 ± 1 |
a Parameters were derived from Eyring plots using the kinetic rate constants determined by SPR and were calculated with statistical Gaussian standard errors for n replicates. The Gibbs free energy of activation at 25°C (298 K) was derived from the relationship ΔG = ΔH − TΔS.
Fig. 8.
Free energy profiles for CA II interactions. Plots show ΔG°, ΔH°, and −TΔS° for CA II interactions with CBS (solid curves) and DNSA (dashed curves), derived from the van't Hoff and Eyring analysis. Reactant and product states are indicated by R and P, respectively.
Discussion
We chose carbonic anhydrase II as a model system to compare binding constants determined from the surface-based SPR biosensor with solution-phase titration calorimetry and stopped-flow fluorescence because the enzyme is commercially available, well characterized, and forms a simple 1:1 complex with arylsulfonamide compounds. The immobilization of CA II within the biosensor flow cells was straightforward and easily adjusted to create surfaces of different densities. By carefully matching the sample and buffer preparations for the three technologies, we minimized potential artifacts that could contaminate the obtained binding parameters. The results of our side-by-side comparison of SPR with ITC and SFF confirm the viability of surface-based biosensors to yield equilibrium, thermodynamic, and kinetic constants comparable to those obtained from solution-based technologies.
The fact that biosensors require the immobilization of one of the binding partners onto a surface has brought about speculation that the immobilization would perturb the binding constants. In these studies, the agreement between the solution- and surface-based interaction parameters likely stems from the fact that the protein was tethered to a noncrosslinked dextran layer instead of to a solid surface. The dextran layer, commonly employed in Biacore analysis, retains much of the rotational entropic properties of the immobilized macromolecule, along with providing some degree of diffusional freedom (Karlsson et al. 1994). The flow cell system used in Biacore is also essential for rapid delivery of a constant supply of analyte during the association phase, and for rapid washout of the surface during the dissociation phase. This helps to minimize or eliminate concentration gradients at the surface that would otherwise alter the apparent binding reactions.
By no means do we imply that all rate constants determined from biosensors will match those obtained from solution-based methods. To appropriately compare biosensor data with data from solution-based assays, it is critical that biosensor experiments be conducted with care to avoid potential artifacts such as mass transport, nonspecific binding, and avidity effects that could alter the apparent binding constants (Myszka 1997; Morton and Myszka 1998). Applying robust data processing methods is important for improving the quality of the binding data (Myszka 1999b). Additionally, employing global fitting techniques helps ensure that appropriate models are used to interpret the reaction constants (Morton et al. 1995).
We also stress that although the SPR data were collected and fit simultaneously from multiple capacity surfaces, this was done to demonstrate the exceptional quality of the binding data available from the biosensor. Although fitting data from multiple capacity surfaces provides more information about binding reactions, it is not a requirement to extract accurate binding constants for a given interaction. In most cases, enough binding information is available from a single surface.
Determining the kinetics of the CA II/sulfonamide interactions yielded information that was unavailable solely from equilibrium data. For example, CA II was found to have a higher affinity for DNSA than for CBS (340 nM versus 760 nM at 25°C), but analysis of the rate constants showed that the CA II/CBS complex was kinetically more stable, having a fourfold slower dissociation rate (Table 1). The reaction and transition-state thermodynamics also showed that although the overall Gibbs free energy for complex formation was similar between the two compounds, the entropic and enthalpic contributions were significantly different. This detailed kinetic and thermodynamic information will help in characterizing how drug candidates interact with their macromolecular targets.
The examples of small-molecule biosensor analysis provided by these carbonic anhydrase inhibitors do not represent the limits of rate constants available from the biosensor. With carefully designed experiments, association and dissociation rates in the ranges of 1 × 10³ to 1 × 10⁷ M−1s−1 and 1 to 1 × 10⁻⁶ s−1, respectively, are possible (Myszka 1997). Even these ranges may be expanded, depending on the system. Also, the ability to monitor small analytes binding to even larger immobilized targets is possible. With current biosensor technology, monitoring interactions between analytes and immobilized targets differing in molecular mass on the order of 1000-fold should be feasible.
Biosensor analysis affords several advantages over other biophysical techniques, including its high information content, real-time monitoring, and high sensitivity, as well as the use of label-free reactants and low sample consumption. The ability to collect reliable equilibrium, kinetic, and thermodynamic information for small molecules from a single platform will expand the role biosensors play in life science research and the pharmaceutical industry.
Materials and methods
Materials and apparatus
Carbonic anhydrase isozyme II (MW = 30 kD) from bovine erythrocytes, 4-carboxybenzenesulfonamide (MW = 201.20 Daltons), and dansylamide (MW = 250.30 Daltons) were purchased from Sigma. SPR analyses were conducted using a Biacore 2000 SPR biosensor (Biacore AB). Research-grade CM5 sensor chips and coupling reagents (N-ethyl-N`-dimethylaminopropylcarbodiimide, EDC; N-hydroxysuccinimide, NHS; and 1 M ethanolamine HCl, pH 8.5) were purchased from Biacore AB. Calorimetric titrations were performed using an Omega MSC-ITC (MicroCal, Inc.). Stopped-flow kinetic studies were performed using a KinTex SF-2001 (KinTek Corporation).
Surface plasmon resonance
Immobilization of CA II
Prior to use, biosensor chips were docked into the instrument and preconditioned in water at 100 μL/min by applying two consecutive 20-μL pulses of 50 mM NaOH, then 10 mM HCl, and finally 0.1% SDS. CA II surfaces were prepared by standard coupling via exposed primary amines on CA II (Johnsson et al. 1991). Immobilizations were conducted at 25°C in PBS running buffer (20 mM sodium phosphate, 150 mM sodium chloride, pH 7.4), flowed at a rate of 10 μL/min. Flow cells were activated for 7 min by injecting a 70-μL mixture of 50 mM NHS:200 mM EDC. To prepare a high-capacity surface, 100 μL of a 0.1-mg/mL solution of CA II was injected for 10 min, followed by a 70-μL injection of ethanolamine to block any remaining surface-activated groups. Typical immobilization levels ranged from 6000 to 8000 RU. Lower CA II surface densities were achieved by injecting a diluted CA II acetate solution (0.03 mg/mL) for 5 min. Nonderivatized flow cells served as reference surfaces.
High-resolution CA II/sulfonamide interaction studies
Interaction analyses of CBS and DNSA binding to CA II surfaces in a high-resolution mode were performed at 25°C. Prior to each binding study, the instrument was primed three times with PBS, which served as the running buffer. All assays were run at a flow rate of 100 μL/min and a data collection rate of 2.5 Hz. Both the CBS and DNSA binding assays were repeated 10–20 times on newly immobilized CA II surfaces.
For the CBS study, a 2.0-mM stock CBS solution was prepared directly in running buffer from which twofold serial dilutions were made, typically spanning 40 nM to 20 μM. CBS was tested for binding simultaneously to CA II immobilized at two different surface densities. Each CBS concentration was dispensed into triplicate aliquots, randomized in the sample block, and injected across the four flow cells for 1 min using the KINJECT command. To monitor the dissociation of the CBS/CA II complex, running buffer was made to flow over the surface for 3 min, after which the IFC (integrated fluidic cartridge) was washed using the EXTRACLEAN command. Five or more samples of PBS running buffer alone were injected at the start of the analysis to ensure the instrument was fully equilibrated and additional blanks were injected after every fifth sample injection for double referencing.
Unlike CBS, which was readily soluble in PBS, DNSA required initial dissolution in methanol. Methanol stocks of 2.0 mM DNSA were diluted to 10 μM, from which twofold serial dilutions were prepared, typically 5 μM to 2 nM. The DNSA assay was conducted similarly to that described above for CBS.
Temperature-dependent CA II/sulfonamide interaction studies
Temperature-dependent studies of CA II/CBS and DNSA interactions were conducted at 5, 15, 25, and 35°C. For each compound, the entire temperature range was analyzed in a single experiment using an automated method. All samples were prepared as threefold serial dilutions in running buffer. CBS (40 nM to 10 μM) and DNSA (7 nM to 5 μM) were injected in triplicate for 1 min at a flow rate of 100 μL/min. A blank injection was included between each concentration series. The entire experiment was replicated for each compound, using different chips and newly immobilized CA II surfaces.
Determining kinetic and thermodynamic parameters
All sensorgrams were processed using a double-referencing method (Myszka 2000). First, the responses from the reference surface were subtracted from the binding responses collected over the reaction surfaces to correct for bulk refractive index changes. Second, the response from an average of the blank injections was subtracted to remove any systematic artifacts observed between the reaction and reference flow cells. Corrected response data were then fit in CLAMP, a data analysis program designed to interpret the binding kinetics of interactions recorded on biosensors by combining numerical integration and nonlinear global curve fitting routines (Morton and Myszka 1998). A global analysis of the CBS/CA II interaction was obtained by fitting the kinetic response data from differing-capacity CA II surfaces simultaneously to a simple reversible bimolecular interaction model (A + B = AB), assuming one set of rate constants yet allowing each surface its own maximum capacity. Having resolved the kinetic rate constants, the equilibrium dissociation constant KD was determined by the quotient kd/ka.
Because a fast association rate constant was observed for the formation of the CA II/DNSA complex, DNSA binding responses were fit using the model, A0 = A, A + B = AB, to correct for the potential mass transport limitations imposed on this interaction (Myszka et al. 1998). This model accounts for the diffusion of the soluble analyte within the flow cell to the sensor surface and the reversible interaction with its immobilized binding partner. For consistency between the SPR and SFF analyses, the refractive index of each sensorgram was floated during the fitting routine for the DNSA binding data.
Thermodynamic and transition state analysis
van't Hoff analysis was performed by substituting KD = 1/KA and ΔG = ΔH−TΔS into the van't Hoff equation, ΔG = −RT ln(KA), yielding ln(KD) = ΔH/(RT)−ΔS/R, which is of the linear form y = a + bx. Plotting y = ln(KD) versus x = 1/T gives a = −ΔS/R and b = ΔH/R, where R is the universal gas constant, 1.987 cal/(mol K).
Transition state analysis was carried out using the statistical mechanical Eyring equation, k = (kBT/h)exp(ΔS†/R)exp(−ΔH†/RT), which gives the specific reaction rate (k = ka or kd) for a chemical reaction in terms of the enthalpy and entropy of activation (ΔH† and ΔS†, respectively) and the temperature (in Kelvin). Recasting the Eyring equation into the linear form of y = a + bx, plotting y = Rln(hk/kBT) versus x = l/T, and applying the universal gas constant, Planck's constant (h = 1.584 × 10⁻³⁴ cal sec), and the Boltzmann constant (kB = 3.30 × 10⁻²⁴ cal K) yields a = ΔS† and b = −ΔH†.
van't Hoff and Eyring plots were constructed in TableCurve 2D Windows v2.00 (Jandel Scientific, AISN software), fitting replicate data sets to a robust straight line of the form y = a + bx using a Gaussian standard error.
Isothermal titration calorimetry
CA II/sulfonamide interaction studies
CA II was extensively dialyzed against PBS buffer at pH 7.4, the identical buffer in which CBS and DNSA were solubilized for the SPR assays. All solutions were degassed prior to use. Titrations were carried out using 10-μL injections applied 4 min apart. An initial injection of 2 μL was made before each titration to ensure that the titrant concentration was at its loading value. For the CBS binding assay, the concentration of sulfonamide in the syringe was 20 times the concentration of enzyme in the cell: 400 μM CBS was titrated into 20 μM CA II protein. The orientation of the titration was reversed for DNSA binding assays due to the low solubility of DNSA in the aqueous reaction buffer. In this case, 200 μM CA II protein was titrated into 10 μM DNSA, equivalent to a 20:1 molar ratio of enzyme:inhibitor. All titration data were collected at 25°C and replicated to determine the experimental standard deviations for each parameter.
Extracting thermodynamic parameters from ITC data
Binding isotherms were fit by nonlinear regression using the single-site model provided by Origin software (MicroCal, Inc.). The stoichiometry of the interaction (N), equilibrium association constant (KA), and change in enthalpy (ΔH) were floated during the fitting of all titration data. Equilibrium dissociation constants (KD) were calculated as the reciprocal of KA.
Stopped-flow fluorescence
High-resolution CA II/DNSA interaction studies
The reaction kinetics of CA II with the fluorescent probe DNSA in PBS at 25°C were measured by monitoring the change in the fluorescence of DNSA as it was bound to and released from the active site of CA II. In PBS, the absorption and emission maxima of unbound DNSA are 340 and 578 nm, respectively. When bound to CA II, the emission of DNSA increases in intensity and undergoes a blueshift to a maximum at 450 nM. This emission maximum is sufficiently remote from the chosen excitation wavelength of DNSA to prevent significant interference from Raman and Rayleigh scattering. Using an excitation wavelength of 340 nm through 4 nm-wide slits, emission was collected with a pass filter set at a cut-on wavelength of 450 ± 5 nm.
A methanol stock solution of 2.0 mM DNSA was diluted to 10 μM in PBS, from which all serial dilutions were made. To directly measure the association rate constant, the two reactants were mixed to yield final concentrations of 5 nM CA II and 39 nM to 20 μM DNSA, prepared by twofold serial dilutions. Analysis of each concentration was replicated four times.
Experiments to measure the dissociation rate constant were performed by mixing 10 μM DNSA prebound to 10 nM CA II with 2 mM CBS, a nonfluorescent competitive inhibitor of the CA II/DNSA interaction. Upon mixing, the final concentrations of these species were halved. The decrease in fluorescence was recorded as the DNSA bound to CA II was replaced with CBS. Dissociation studies were replicated three times.
Temperature-dependent CA II/DNSA interaction studies
To observe the effect of temperature on the rate constants, the CA II/DNSA interaction was also monitored at 5°C. In this case, the two reactants were mixed to yield final concentrations of 5 nM CA II and 60 nM to 5 μM DNSA, prepared by threefold serial dilutions. The analysis of each concentration was replicated three times.
Determining kinetic parameters from SFF data
To approximate pseudofirst-order reaction conditions, DNSA was always at least eightfold in molar excess of CA II. Normalized fluorescence data, with the initial point of each trace set to t = 0 sec, were globally fit in CLAMP to a simple bimolecular interaction model, A + B = AB.
Acknowledgments
This study was funded, in part, by the U.S. Department of Defense DARPA (F30602-00-2-0609).
The publication costs of this article were defrayed in part by payment of page charges. This article must therefore be hereby marked "advertisement" in accordance with 18 USC section 1734 solely to indicate this fact.
Abbreviations
CA II, carbonic anhydrase II
CBS, 4-carboxybenzenesulfonamide
DNSA, dansylamide
ITC, isothermal titration calorimetry
PBS, phosphate-buffered saline
SFF, stopped-flow fluorescence
SPR, surface plasmon resonance
Article and publication are at http://www.proteinscience.org/cgi/doi/10.1110/ps.4330102.
References
- Chegwidden, W.R. and Carter, N.D. 2000. Introduction to the carbonic anhydrases. In The carbonic anhydrases: New horizons (eds. W.R. Chegwidden, N.D. Carter, and Y.H. Edwards), pp. 13–28. Birkhauser Verlag, Basel.
- Hämäläinen, M.D., Markgren, P.-O., Schaal, W., Karlén, A., Classon, B., Vrang, L., Samuelsson, B., Hallberg, A., and Danielson, U.H. 2000. Characterization of a set of HIV-1 protease inhibitors using binding kinetics data from a biosensor-based screen. J. Biomol. Screen. 5 353–360. [DOI] [PubMed] [Google Scholar]
- Johnsson, B., Löfås, S., and Lindquist, G. 1991. Immobilization of proteins to a carboxymethyldextran-modified gold surface for biospecific interaction analysis in surface plasmon resonance sensors. Anal. Biochem. 198 268–277. [DOI] [PubMed] [Google Scholar]
- Kampranis, S.C., Gormley, N.A., Tranter, R., Orphanides, G., and Maxwell, A. 1999. Probing the binding of coumarins and cyclothialidines to DNA gyrase. Biochemisty 38 1967–1976. [DOI] [PubMed] [Google Scholar]
- Karlsson, R., Kullman-Magnusson, M., Hämäläinen, M.D., Remaeus, A., Andersson, K., Borg, P., Gyzander, E., and Deinum, J. 2000. Biosensor analysis of drug–target interactions: Direct and competitive binding assays for investigation of interactions between thrombin and thrombin inhibitors. Anal. Biochem. 278 1–13. [DOI] [PubMed] [Google Scholar]
- Karlsson, R., Roos, H., Fägerstam, L., and Persson, B. 1994. Kinetic and concentration analysis using BIA technology. Methods 6 99–110. [Google Scholar]
- Markgren, P.-O., Hämäläinen, M., and Danielson, U. 1998. Screening of compounds interacting with HIV-1 proteinase using optical biosensor technology. Anal. Biochem. 265 340–350. [DOI] [PubMed] [Google Scholar]
- Morton, T.A. and Myszka, D.G. 1998. Kinetic analysis of macromolecular interactions using surface plasmon resonance biosensors. Methods Enzymol. 295 268–294. [DOI] [PubMed] [Google Scholar]
- Morton, T.A., Myszka, D.G., and Chaiken, I.M. 1995. Interpreting complex binding kinetics from optical biosensors: A comparison of analysis by linearization, the integrated rate equation, and numerical integration. Anal. Biochem. 227 176–185. [DOI] [PubMed] [Google Scholar]
- Myszka, D.G. 1997. Kinetic analysis of macromolecular interactions using surface plasmon resonance biosensors. Curr. Opin. Biotechnol. 8 50–57. [DOI] [PubMed] [Google Scholar]
- ———. 1999a. Survey of the 1998 optical biosensor literature. J. Mol. Recognit. 12 390–408. [DOI] [PubMed] [Google Scholar]
- ———. 1999b. Improving biosensor analysis. J. Mol. Recognit. 12 279–284. [DOI] [PubMed] [Google Scholar]
- ———. 2000. Kinetic, equilibrium, and thermodynamic analysis of macromolecular interactions with Biacore. Methods Enzymol. 323 325–340. [DOI] [PubMed] [Google Scholar]
- Myszka, D.G., He, X., Dembo, M., Morton, T.A., and Goldstein, B. 1998. Extending the range of rate constants available from Biacore: Interpreting mass transport-influenced binding data. Biophys. J. 75 583–594. [DOI] [PMC free article] [PubMed] [Google Scholar]
- Rich, R.L. and Myszka, D.G. 2000. Survey of the 1999 surface plasmon resonance biosensor literature. J. Mol. Recognit. 13 388–407. [DOI] [PubMed] [Google Scholar]
- Roos, H., Karlsson, R., Nilshans, H., and Persson, A. 1998. Thermodynamic analysis of protein interactions with biosensor technology. J. Mol. Recognit. 11 204–210. [DOI] [PubMed] [Google Scholar]


