

Abstract
Many seemingly unrelated neurodegenerative disorders, such as amyloid and prion diseases, are associated with propagating fibrils whose structures are dramatically different from the native states of the corresponding monomers. This observation, along with the experimental demonstration that any protein can aggregate to form either fibrils or amorphous structures (inclusion bodies) under appropriate external conditions, suggest that there must be general principles that govern aggregation mechanisms. To probe generic aspects of prion-like behavior we use the model of Harrison, Chan, Prusiner, and Cohen. In this model, aggregation of a structure, that is conformationally distinct from the native state of the monomer, occurs by three parallel routes. Kinetic partitioning, which leads to parallel assembly pathways, occurs early in the aggregation process. In all pathways transient unfolding precedes polymerization and self-propagation. Chain polymerization is consistent with templated assembly, with the dimer being the minimal nucleus. The kinetic effciency of Rn−1 + G → Rn (R is the aggregation prone state and G is either U, the unfolded state, or N, the native state of the monomer) is increased when polymerization occurs in the presence of a "seed" (a dimer). These results support the seeded nucleated-polymerization model of fibril formation in amyloid peptides. To probe generic aspects of aggregation in two-state proteins, we use lattice models with side chains. The phase diagram in the (T,C) plane (T is the temperature and C is the polypeptide concentration) reveals a bewildering array of "phases" or structures. Explicit computations for dimers show that there are at least six phases including ordered structures and amorphous aggregates. In the ordered region of the phase diagram there are three distinct structures. We find ordered dimers (OD) in which each monomer is in the folded state and the interaction between the monomers occurs via a well-defined interface. In the domain-swapped structures a certain fraction of intrachain contacts are replaced by interchain contacts. In the parallel dimers the interface is stabilized by favorable intermolecular hydrophobic interactions. The kinetics of folding to OD shows that aggregation proceeds directly from U in a dynamically cooperative manner without populating partially structured intermediates. These results support the experimental observation that ordered aggregation in the two-state folders U1A and CI2 takes place from U. The contrasting aggregation processes in the two models suggest that there are several distinct mechanisms for polymerization that depend not only on the polypeptide sequence but also on external conditions (such as C, T, pH, and salt concentration).
Keywords: Protein aggregation, prions, amyloids, phase diagram, Monte Carlo simulations
Protein aggregation (Mitraki and King 1989; Sipe 1992; DeYoung et al. 1993; Jaenicke 1995; Wetzel 1996; Fink 1998), resulting in the formation of propagating oligomers, plays a key role in the cause of a number of seemingly unrelated diseases (Cohen and Prusiner 1998). Neurodegenerative diseases (scrapie, Kuru, CJD, FFI, and BSE), which are associated with the abnormal isoform of prion proteins, are among the most well-known examples (Prusiner 1998). In the disease-causing prions, there is a post-translational conformational change from the predominantly α-helical state in the normal isoform of prion protein to a β-sheet conformation in PrPSc, which is the aggregated state of the pathogenic scrapie form (Jarrett and Lansbury 1993; Prusiner 1998). Similarly, the oligomeric form of Aβ-peptides (implicated in Alzheimer's disease) has a predominantly β-sheet architecture even though, in its monomeric form, it is a random coil over a wide range of external conditions (Kelly 1996; Harper and Lansbury 1997). Neither the mechanism of the conformational change nor the propagation leading to oligomers are fully understood at the molecular level.
Although the study of the aggregated form of disease-causing proteins has been the object of intense study, only recently has it been appreciated that almost any protein can form aggregates under appropriate conditions (Booth et al. 1997). More surprisingly, Dobson et al. (Chiti et al. 1999; Jimenez et al. 1999) found that even the structures of the aggregates of "normal" proteins (formed under nonphysiological conditions) are similar to the fibrils that are implicated in the neurodegenerative diseases. These findings suggest that there may be generic mechanisms by which aggregation takes place. Because there are a number of distinct folding mechanisms of monomeric proteins, it is likely that, at the molecular level, there may also be several distinct scenarios for protein aggregation.
A goal of this paper is to explore the generic mechanism by which oligomerization of proteins takes place using lattice models. An obvious variable, besides the polypeptide sequence, that controls aggregation is protein concentration, C. Interactions between the polypeptide chains become important if C exceeds the overlap concentration C* ⋍ N/V, where λ is a constant, N is approximately the number of residues in the polypeptide chain, and V is the volume associated with one polypeptide chain. If electrostatic interactions are important, V can exceed 4/3; πR3g, where Rg is the radius of gyration of the polypeptide chain (see Materials and Methods). Besides C, other factors can also influence aggregation. The equilibrium between the unfolded (U) and the native (N) states of a monomeric protein, which folds in a single step, depends on the sequence of the polypeptide chain as well as on the external conditions (pH, temperature, and salt concentration). The response of U and N to external conditions can be different (e.g., denaturants can stabilize U, whereas N is destabilized). Such opposing tendencies as well as sequence-dependent variations of folding of the monomer make the study of protein aggregation difficult.
Our goal is to decipher general scenarios for protein association using lattice models. We consider two different models. The first one, introduced recently by Harrison, Chan, Prusiner, and Cohen (HCPC) (Harrison et al. 2001), is used to probe a number of aspects of self-propagation that involves conformational change from a compact state in the monomer to an extended "β-sheet" conformation in the oligomer phase. This model was designed to be a toy model for probing prion-like behavior. Aggregation and chain propagation in this system occur from a conformation other than U or N. This is in accord with the popular proposal that aggregation in amyloid forming peptides and proteins takes place by populating (at least transiently) partially folded intermediates (Kelly 1996).
In contrast to the previous examples in which oligomer assembly is accompanied by a large conformational transition, several studies (Silow and Oliveberg 1997; Silow et al. 1999) suggest that proteins, which fold by two-state kinetics at infinite dilution (C → 0), can undergo reversible aggregation directly from the U state. To decipher the general principles that govern aggregation in these two-state proteins, we use three-dimensional lattice models with side chains (LMSC). Using LMSC and temperature (T) and C as variables, we address the following questions: What are the "phases" in the (T,C) plane? How does the assembly into some of these states occur starting from U?
Because of the simplicity of the models used, only general questions about principles can be addressed. Nevertheless, we show that questions of experimental interest, such as the role of partially folded intermediates in facilitating aggregation, can be addressed using simple models. The present work, which expands on previous studies of aggregation using ON AND OFF-lattice models (Broglia et al. 1998; Gupta et al. 1998; Istrail et al. 1999; Giugliarelli et al. 2000; Smith and Hall 2001), provides a framework for obtaining insights into the scenarios for oligomerization.
Results
Monomeric properties of a self-propagating two-dimensional sequence
To study the properties of proteins that exhibit prion-like behavior we study, in detail, the HCPC model (Harrison et al. 2001). A few of the characteristics of a self-propagating model are: (a) besides the native state of the monomer, which is preferentially populated at temperatures below TF, there be alternate states that can polymerize. The native conformation of the monomer need not be unique. Many amyloid forming peptides, including the Aβ-peptides, appear to be random coils under most conditions. On the other hand, few mammalian prion proteins, in their normal isoform, form relatively long-lived structures that have been determined by NMR (Riek et al. 1996), which suggests that they have a relatively unique structure. From a computational perspective it is convenient to devise a sequence with a unique monomer native state. (b) Such a sequence should aggregate, perhaps in an ordered manner, upon interactions with other proteins. (c) To mimic amyloid-like behavior they should undergo, upon association, conformational change as well.
The most remarkable aspect of the HCPC model (see Materials and Methods) is that, using a simple two-dimensional lattice model with four kinds of beads, they obtained a sequence (Fig. 1a ▶) that propagates upon interaction with other monomers. In the process, the chain undergoes a large conformational change from a compact native state to an extended "β-sheet"-like conformation. The energy spectrum of the 16-mer (Fig. 1b ▶) and the thermodynamics of the monomer can be computed using exact enumeration of all possible conformations. The collapse transition temperature Tθ, and the folding temperature TF, determined by the standard methods (Camacho and Thirumalai 1993), are 1.90 and 1.10, respectively. We measure temperature in units of ɛ (see Materials and Methods). Because of the clear separation between Tθ and TF we expect that, under typical folding conditions (T ≈ TF), fluctuations could populate partially folded intermediates that could make this sequence susceptible to aggregation. The folding time τF at T = TF, which is computed from the distribution of first passage times (Camacho and Thirumalai 1993), is 8 × 10⁶ MCS, while at TH = 1.41 (mildly denaturing condition) it is τF/4.
Fig. 1.

Conformations of the HCPC model sequence (AHHABPBHHBHHABHH), which consists of 16 beads made from a four-letter alphabet adapted from Harrison et al. (2001). The first residue is numbered. (a) The native state of the compact monomer. (b) Energy spectrum of the 16-mer sequence. The self-propagating R conformation is one of the 44 folds of the sixth excited state. (c) The "minimal" propagating unit R2 that forms whenever two monomers are in the R state. The R2 conformation is stabilized by eight interface contacts. Its energy is −87 (−43.5 per chain). (d) An alternative conformation of the dimer that has the same energy as R2. One of the chains is in the native conformation of the monomer. (e) The structure of R3, which shows the way self-propagation occurs in this model. Its energy is −147 (−49 per chain). (f) Structure of the domain-swapped trimer R3DS. Although this structure can self-propagate, it does not do so for lack of stability. The domain-swapped structure in this model has "dangling ends" (indicated by arrows) that decrease its stability.
Aggregation involves parallel routes: Evidence from dimerization kinetics
We probed the kinetics of R2 (Fig. 1c ▶) formation by constraining the distance between the centers of mass, Rcm, of the two chains to be at a concentration-dependent distance (see Materials and Methods). At short enough values of Rcm, which correspond to large C, the monomers can interact so that the reaction
 |
(1) |
becomes possible. We enforce the constraint in such a way that the two monomers have enough area so that they can reach the native state. A shortcoming of this sequence is that the native state of the dimer is twofold degenerate (the other lowest energy conformation of the dimer is shown in Fig. 1d ▶) so that the maximum fraction of the propagatable form, R2 (Fig. 1c ▶), even at extremely low temperatures, is only 0.5 (Harrison et al. 2001). At temperatures where computations can be easily performed the fraction of molecules in the R2 state is quite small (Harrison et al. 2001). To probe the role of the effect of denaturation on R2 formation we studied the kinetics of dimerization at T = TH and T = TF.
We equilibrated the chains at an elevated temperature (T = 10.0) for about 5 × 10⁶ Monte Carlo steps (MCS). After equilibration we let T = TH, and the dynamics of 100 trajectories was followed until R2 is reached for the first time. The dimer appears in all trajectories. From the distribution of the first passage times, one can compute PuR2 (t), the fraction of molecules that have not reached the R2 state. The time for forming R2, which is obtained from the double exponential decay of PuR2 (t), is about 2 × 10⁷ MCS (2.5 τF).
By following the dynamics of the individual trajectories, we find that there are three routes to the R2 state (Fig. 2a ▶). In pathway I (Fig. 2a ▶), through which the maximum flow to R2 occurs at T = TH, the monomers initially fold to their native states on a time scale that is approximately τF. Subsequent assembly, involving the major conformational change, requires near-global unfolding of both chains (see below). For this pathway, unfolding of the chains and subsequent aggregation is the rate-limiting step (Fig. 2a ▶). In pathway II (Fig. 2a ▶), one of the chains folds rapidly to the native conformation, whereas the other remains unfolded. The time for R2 formation in this pathway requires global unfolding of only one of the chains, which is followed by assembly. Consequently, the mean time for dimerization in pathway II is less than that in pathway I. In pathway III, both chains interconvert among the ensemble of unfolded conformations until the dimer is formed. In this pathway (Fig. 2a ▶) conformational changes and assembly occur nearly simultaneously. From the distribution of first passage time we find that the shortest time to reach the dimer is in pathway III in which R2 is reached directly from the ensemble of denatured states ŨA and ŨB.
Fig. 2.

(a) Three parallel routes leading to the dimer R2 starting from an ensemble of denatured states. The symbols ŨA and ŨB denote collapsed denatured states of chains A and B, respectively. In pathway I both chains fold to the native conformation and subsequently dimerize, whereas in pathway II only one of the chains folds. In both these pathways dimerization is preceded by substantial unfolding of the folded chains. Kinetically, the most assembly occurs when R2 is formed directly from ŨA and ŨB. The time for forming ŨA from U, namely τD, is much less than τF, that is, τT/τF ≫ 1. The flux of molecules φi (i = 1, 2, and 3) through the pathways depends on temperature. At T = TF the values are φ1 = 36% (58%), φ2 = 40% (23%), φ3 = 24% (19%), where the numbers in parenthesis are for T = TH. Also, at T = TF the average conversion times are τCI ∼ 30 τF, while τCIII ⋍ 2 τF and at T = TH τCI ∼ 10 τF and τCIII ⋍F, where τF is the monomeric folding time. (b) The two pathways in the templated assembly (TA) of Rn−1 + U → Rn (n ≥ 3). Because N has to unfold prior to assembly, the conversion time along pathway I is greater than along pathway II. Just as in (a), the amplitudes of the fast and slow pathways depend on T . At T = TH, they are 75% (for I) and 25% (for II). The average conversion time for pathway I is ∼100 τF, while for II it is τCII ∼ τF.
To probe the kinetics of dimerization at T = TF we ran 250 trajectories. Each trajectory was followed for a maximum of 109 MCS. Within this period, many trajectories (96%) reach the R2 state. From PuR2(t), which can be fit with a sum of two exponentials, the mean time needed to reach R2 at TF is found to be about an order of magnitude larger than at TH. A detailed analysis of the trajectories shows that there are three pathways to dimerization just as at T = TH. The amplitudes of the three pathways are different (see caption to Fig. 2a ▶). The rate-determining step in pathway I involves near-global unfolding of the chains, which requires large structural fluctuations. Because such fluctuations are less frequent at lower temperatures the dimerization time is increased. In 9 of the 250 simulated trajectories the dimer is not reached in 109 MCS. The native state for both chains is found in eight of these trajectories, that is, they follow pathway I to R2. This suggests that stabilization of the native state of each chain compared to the pool of non-native conformations may be effective in preventing the conformational change and assembly associated with prion diseases. The inverse link between the enhanced stability of the native conformation and the tendency to aggregate has been noted earlier in lattice model simulations (Harrison et al. 1999).
The partitioning of the pool of initial population of molecules into three distinct routes with drastically different oligomerization times is reminiscent of the kinetic partitioning mechanism (KPM) for monomeric folding of lysozyme (Guo and Thirumalai 1995; Kiefhaber 1995; Matagne et al. 1997). A generalization of KPM to describe amyloidogenesis kinetics has been proposed recently (Massi and Straub 2001). The present computations lend support to the notion that oligomerization kinetics involves parallel routes to aggregation.
Templated polymerization
A number of years ago Griffith (1967) proposed that an autocatalytic polymerization of proteins can occur provided "suitable components are available," that is, growth of the oligomers by propagation is possible if a template already exists. In the templated assembly (TA) model the propagating conformation of the monomer is presumed to be different from the native state (Griffith 1967). The propagating state R in the HCPC model is the sixth "excited state" of the chain (Fig. 1b ▶). There are 43 other conformations with the same energy as R. Upon forming the template, recruitment of additional monomers (TA) becomes possible, whereas spontaneous aggregation of many monomers is less likely. The propagation of the R2 dimer has already been addressed by HCPC. These authors showed that it is kinetically easier to add a third monomer to a preformed dimer (Harrison et al. 2001). The reaction N + R2 → R3 occurs much more rapidly than spontaneous formation of R3 starting from three monomers in their native states. Thus, the presence of the template autocatalytically enables propagation of the oligomers. Assuming that the template exists, the propagation of the R2 for this model protein seems possible.
We consider two models for TA. In the first, referred to as directed TA (DTA), the polypeptide chain is only allowed to move to the right of the template, which breaks the translational symmetry. This might physically correspond to assembly when a minimal template unit (say a dimer) is immobilized on a glass plate. This appears to be the situation considered by HCPC. The other case corresponds to assembly in solution, namely, TA. This is more akin to seeded nucleated polymerization (Harper and Lansbury 1997) provided that the dimer is the "nucleus" (see below).
To explore TA for the model protein we undertook a series of simulations (at T = TH) to study the reaction
 |
(2) |
n = 3–7. Our goal is to follow the pathways in the TA of higher order oligomers starting from the U state. We started the simulations of n chains ([n−1] of them being immobilized in the template Rn−1 and the nth chain being free to move) with the monomer initially unfolded, because this leads to the most efficient assembly, as the results of the dimerization indicate. Moreover, from the detailed pathways in the formation of R2 starting from N, we established that global unfolding of the chain occurs prior to assembly.
In all cases we find that the addition of the nth monomer to an already existing template of Rn−1 occurs by two major pathways (Fig. 2b ▶). Addition occurs most rapidly when the monomer in the U state is added to the template. In this situation, growth of the oligomer and conformational change occur nearly simultaneously. For this sequence, in the DTA, the amplitude of this kinetically efficient pathway (II) is smaller than that of the major pathway (I) (Fig. 2b ▶). In the latter case, the unfolded monomer initially folds. Subsequent growth and TA can occur only upon global unfolding of the chain, which explains the slower kinetics along this pathway (see below). In the DTA simulations, we restricted the motion of the chains such that each chain was allowed to move only in the half space where it is placed initially and by forcing the free chain to move only to the right side of the template. The time scales in the DTA for R2 + U → R3 are comparable to those of Harrison et al. (2001). The restriction placed on the motion of the chains breaks the symmetry of the space and, in essence, produces an entropy barrier for assembly. To probe TA directly, we allowed the chains to move freely in space. This is appropriate for examining propagation of oligomers in solution. For the dimer formation, we ran 122 trajectories at T = TH until R2 is first reached. The average folding time is ∼3 τF (compared to ∼10 τF in the DTA). The three pathways found above (Fig. 2a ▶) are present here also, but with two important changes: (1) the dominant route is UA + UB → ŨA + ÑB → R2, which is pathway II in Figure 2a ▶; and (2) the average conversion time of the UA + UB → ÑA + ÑB → R2 pathway is shorter than in the DTA simulations. For the R2 + U → R3 reaction we ran 100 trajectories at T = TH until R3 is reached. The free chain is restricted in its motion only by the constraint between its center of mass and the center of mass of the dimer (Materials and Methods). The average assembly time is ∼10 τF (compared to 100 τF in DTA). The two pathways found before (Fig. 2b ▶) are still present with only minor changes in the amplitudes. However, there is a drastic change in the average assembly time for R2 +U → R2 + N → R3. It goes from ∼100 τF (DTA) to ∼10 τF (TA).
From the DTA and TA simulations it is clear that the conformational change from N → R can occur efficiently only if a template is already present. However, the present simulations cannot distinguish between TA and the nucleated-polymerization (NP) model (Harper and Lansbury 1997). According to the NP model, the formation of the critical nucleus is the rate-determining step. This is usually discerned by the observation of a lag phase in polymer growth. Such a lag phase is not observed in the TA. Because in this model the nucleus is a dimer, TA and NP appear to be superficially similar. To distinguish between the two, simulations at a fixed seed concentration (a dimer in this case) but varying monomer concentration should be carried out. The growth rate would be independent of C in the TA model but would increase as Cα (α unknown) in the NP model. Although not conclusive, the near constancy of the conversion time for Rn−1 + U → Rn (n ≥ 5) seems to suggest that self-propagation in the HCPC model is consistent with TA.
Minimum size of the propagating oligomer
It is important to determine the minimal number of chains in the template that leads to fast assembly, that is, the size of the "nucleus." To determine this, we followed 150 trajectories for the reaction R + N → R2 (that is, one chain is fixed in the R conformation while the other one is free to move around it starting from its native state conformation) at T = TH. The average folding time, obtained from the one-exponential fit of the fraction Pu(t) of molecules that does not dimerize, is 3.2 × 10⁷ MCS, which is almost identical to the conversion time obtained by HCPC for the reaction N + N → R2. By comparison, the average conversion time for R2 + N → R3 is one order of magnitude smaller than that for N + N + N → R3 (Harrison et al. 2001). Therefore, for the HCPC model sequence we infer that the minimal number of chains in the template that promotes fast TA is 2.
Transient unfolding precedes assembly
For the model proteins the propagatable species, namely the R conformation (Fig. 1c ▶), is a high energy state. For the monomer the ratio fR = fN =e−ΔE/kBT = 0.007 at T = TH, where ΔE = ER − EN, and fR and fN are the occupation fractions of the R and N states, respectively. This shows that the R state is not significantly populated at the simulation temperature. Nevertheless, the R state has to be populated at least transiently for polymerization to occur. To monitor the dynamics of formation of the R state, we computed for each trajectory
 |
(3) |
where ri(1) and ri(2) are the coordinates of the beads at the dimer interface for chains (1) and (2), respectively, and the sum is over only the native interface contacts. Similarly, we also calculated Nnnint, in which the non-native interface contacts are monitored. The dynamics of Nnint monitor the interface contact formation. In the R2 state Nint = 8 (Fig. 1c ▶), which can only result if both the monomers are in the R state with precise interchain registry. To establish that the dimer is R2, one also needs to compute the number of non-native contacts at the interface, Nnnint.
The correct interface is formed only when Nnnint = 0 and Nnint = 8. The time evolution of these two quantities along a trajectory from each of the three pathways shown in Figure 2a ▶ can be found in Figures 3, 4, and 5 ▶ ▶ ▶. These graphs show that in the kinetically efficient pathway III (Fig. 5 ▶) there is always a certain number of native interface contacts present. This is not the case in pathways I and II (Figs. 3,4 ▶ ▶) where native interface contacts are formed, then are broken and reformed until the R2 interface is finally reached. In pathway I there are instances (even late in the trajectory) where there are zero native interface contacts and a substantial number of Nnnint. To form R2, structural rearrangements that lead to Nnnint = 0 and Nnint = 8 are required. This is possible only in the presence of substantial chain unfolding.
Fig. 3.

Time evolution of the number of native and non-native contacts (eq. 3) at the interface between two chains along a trajectory that reaches R2 through pathway I (Fig. 2a ▶) at T = TH = 1.41. Only late in the conversion process (t≈7 × 10⁷ MCS) all native interface contacts form and Nnnint → 0. The vanishing of Nnnint requires substantial unfolding.
Fig. 4.

Same as Figure 3 ▶ except it is for a trajectory following pathway II (Fig. 2a ▶). Just as in Figure 3 ▶, there is a substantial number of Nnnint until the assembly process is complete. The native interface contacts form only late in the conversion process, suggesting that R2 formation may involve formation of a "nucleus" of native interface contacts.
Fig. 5.

Dynamics of Nnint and Nnnint for a trajectory that reaches R2 directly from compact denatured states (Fig. 2a ▶). The dynamics is qualitatively different from those in Figures 3 and 4 ▶ ▶. Relatively early in the assembly process nearly 50% of Nnint are formed. There are fluctuations around this value along the trajectory. Interestingly, for the major portion of the trajectory, Nnnint is less than in pathways I and II. Because native interface contacts dominate in this pathway, in this case the conversion time almost coincides with τF, which is the monomer folding time.
The domain-swapped dimer R2DS does not propagate
The HCPC model sequence, intended to mimic prion-like behavior, has been shown to have a conformation (R2) that propagates easily (Harrison et al. 2001). There are several different strains in prions (Bessen et al. 1995; Collinge et al. 1996; Telling et al. 1996; Safar et al. 1998), which are attributed to distinct conformations of the propagating monomer. In light of this finding, it would be interesting to investigate whether the HCPC sequence possesses any other propagatable conformations. It has been suggested that the strains correspond to different packing arrangements in the scrapie form obtained when polymerization occurs from varying initial conformations (Bessen et al. 1995). Domain swapping (DS), originally discovered by Eisenberg (Bennett et al. 1995) in the crystal structure of the diphteria toxin dimer, has recently been found to be an efficient oligomerization mechanism in a number of fibril-forming proteins (Liu et al. 2001; Janowski et al. 2001). Thus, we focused our attention on the efficacy of propagation of R2DS. The R2DS conformation with energy −86 (that is, one unit higher than R2) is found transiently in many trajectories when monitoring the formation of R2 at TH. We found that R2DS is not stable under most (T,C) conditions. On the other hand, in the (T,C) range examined (T = TF and T = TH with Rcm = 3.50 and 4.50), R3 is stable. Therefore, one might expect that the R3DS (Fig. 1f ▶) state could also be stable at T = TH, and propagation can occur in this domain-swapped mode with R2DS serving as a template. To probe this, we studied the propagation of R2DS to R3DSusing two strategies: (1) we started two chains in the R2DS conformation and the third in its native state. We allowed all chains to move with the constraint that the mean distance between them be fixed and T = TH; (2) templated assembly: we fixed two of the chains in the R2DS conformation while the third chain was free to move around the center of mass of the template. The assembly kinetics was monitored by initial equilibration at a high temperature followed by a quench to TH.
The R3DS conformation was not found in 2.7 × 10⁸ MCS when all chains were allowed to move. The two chains that are initially in the R2DS conformation evolve rapidly from it, and they fold into their native state (Fig. 1a ▶). The third chain, which starts in the native state, reaches the RDS state, but there is no instance when all three chains are in the RDS state simultaneously. This result is not necessarily surprising in light of the fact that even the formation of the R3 conformation from three free chains takes much longer than through TA.
In the simulations of TA for propagation by the domain-swapped mode, we ran three trajectories for 3.4 × 10⁸ MCS at T = TH, which is nearly an order of magnitude longer than the time needed to form R3 (Fig. 2b ▶). The R3DS conformation is not found in any of these trajectories. In all trajectories, the free chain passes through the RDS state relatively early in the assembly process and through its native state at a later time. None of the native (R3DS) interface contacts are found. These results suggest that the R2DS conformation does not propagate for this sequence. It would be interesting to find the combination of sequence and external conditions for which both Rn and RnDS form.
Lattice models with side chains: Phase diagram
To obtain the phase diagram of a generic two-state folder we use the cubic lattice model with side chains (LMSC) for the sequence given in Figure 6a ▶. Previous studies (Klimov and Thirumalai 1998; Klimov and Thirumalai 2001) have established that this sequence folds by two-state kinetics, and the folding thermodynamics is cooperative. Thus, at T ≈ Tθ ≈ TF, aggregation prone states are not populated. However, at high values of C, interactions between chains are possible. This may lead to oligomerization of the various species.
Fig. 6.
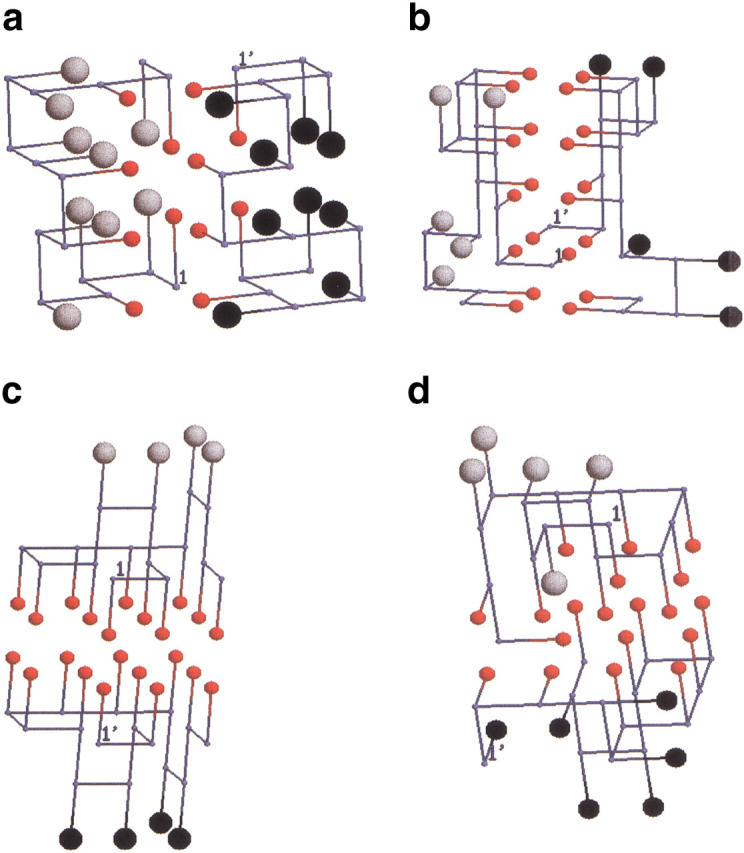
Distinct conformations of ordered dimers found in lattice models with side chains. They are in region IV of the phase diagram (see Fig. 7 ▶). The monomer sequence of the 15-mer is WVVEKWHYYVANNAV. The residues that form contacts at the interface between the chains are represented by medium-sized red spheres, while the backbone beads are given as small gray circles. (a) The structure of the ordered dimer (OD). In the OD each chain is in the folded state of the monomer. The dimer is stabilized by eight interface contacts, which gives it a total energy of −33.4. (b) Domain-swapped (DS) dimer in which certain number of intrachain side chain–side chain (sc–sc) contacts are replaced by interchain sc–sc contacts. Because this involves interpenetration of chains, the transition from DS to either OD or PD involves overcoming a substantial free energy barrier. (c) In the PD conformation the hydrophobic side chains from one chain line up in parallel to the side chains of the other chain. This kind of structure may be similar to a dimer of Aβ peptide fragments (Aβ16–22) in which two chains can form parallel or antiparallel β-sheets that are stabilized by favorable intermolecular hydrophobic interactions and possible salt bridges. (d) An example of another ordered structure, the variant dimer (VD) that forms when topologically forbidden interactions (see Materials and Methods) for a monomer (a connected chain) are allowed for interacting chains. The VD may be an artifact of the lattice models.
For this model two-state protein a generic phase diagram can be conjectured based on physical arguments. At relatively high T and low C the chains are noninteracting random-coil-like, perhaps with flickering residual structure. At low T (T ≤ TF ≈ Tθ) and low C independently folded conformations should be populated. These are the most stable states at infinite dilution. As in CI2, the transition between the two states takes place by nucleation collapse or a condensation mechanism (Fersht 1997; Klimov and Thirumalai 2001). As the concentration is increased, beyond a typical overlap value C* (see Materials and Methods), interactions between chains enable aggregation. At T ≥ TF the oligomers are made of fluctuating unfolded monomers. Because of the interactions, the conformations of these unfolded monomers are different from noninteracting random coils. Such species, which may be thought of as the analog of the molten globule for monomeric proteins, may be precursors to fibril formation in amyloidogenic proteins. At T ≤ TF we expect an ordered oligomer with many favorable interface contacts that stabilize it with respect to independently folded monomers. As the concentration is increased still further, it is possible to get amorphous or disordered oligomers that do not order for long times, that is, they exhibit "glassy" behavior. The structures of these disordered complexes are expected to be different at high and low temperature. Thus, based on physical considerations alone, we expect a rather rich phase diagram in the (T,C) plane even for a protein that, at infinite dilution, folds by two-state kinetics.
We obtained the phase diagram numerically by computing the lowest free-energy structures for a two-chain system (see Materials and Methods). The results, along with the theoretical predictions, are displayed in Figure 7 ▶. The six ≫"phases" predicted above are also found in our simulations thus confirming the richness of the predicted phase behavior of interacting two-state folders. However, numerical simulations show unexpected structures in the ordered phase of oligomers (region IV of Fig. 7 ▶). In the "ordered oligomers" area of the phase diagram, we also found an analog of a domain-swapped (DS) dimer (Fig. 6b ▶) that was not anticipated based on the theoretical considerations given above. An appropriate "order parameter" that distinguishes DS from the ordered dimer (OD; Fig. 6a ▶) is the fraction of native interchain contacts, χint (eq. 10). The value of χint for the DS dimer is 0.7, signifying that its interface is very different from that of the OD, for which χint = 0. In the DS (Fig. 6b ▶) there are side-chain to side-chain interface contacts out of which 12 (86%) are among the 20 side-chain to side-chain contacts that are present in the native state of the monomer. As expected (Bennett et al. 1995), the energy of the DS dimer is higher than that of the OD.
Fig. 7.

Phase diagram in the (T,C) plane for a generic two-state folder. A rich set of phases, including ordered oligomers and amorphous structures, is predicted. The solid lines separating the phases are drawn to guide the eye. The symbols indicate the structures obtained by energy minimization for a dimer (whose monomeric sequence is given in Fig. 6 ▶) (see Materials and Methods for details). The dashed line, separating regions V and VI, is meant to indicate that there are distinct amorphous structures. These can be distinguished by morphology as well as kinetics. There are substructures in the ordered region (see text). The boundaries between them (OD, PD, DS) are difficult to compute numerically.
Domain swapping, which has been proposed as an efficient oligomerization mechanism (Janowski et al. 2001; Liu et al. 2001), leads to a set of ordered aggregates. In our model protein we find that domain swapping occurs at T ≈ TF, where large conformational fluctuations are possible. Because fluctuations of the native state resulting in partially folded or globally unfolded states facilitate aggregation, it is logical to suggest that in some proteins domain swapping might be a mechanism for fibrillization. In the examples studied by Eisenberg et al. (Bennett et al. 1995), domain swapping involves the replacement of a portion of the tertiary structure of a protein by an identical piece from a second chain. This occurs if the native protein structure possesses a part at the beginning/end of the sequence that is stabilized only by local contacts. The native-state conformation of sequence A does not have this characteristic, and therefore, in the LMSC model domain swapping occurs only when all interchain contacts are identical to the native intrachain contacts. In our model, the majority of these contacts are formed between beads located in the middle of the chain. This special structure leads to a "dead-end" DS dimer in the LMSC.
The contiguous presence of a series of hydrophobic side chains in the model sequence (see caption to Fig. 6 ▶) also presents the possibility of forming dimers in which the interacting residues between the two chains are parallel to each other. The resulting (PD) dimer (Fig. 6c ▶), whose ground-state energy is slightly lower than that of the DS structure, shows an interface that is stabilized by strong contacts between the hydrophobic moieties. PD can form in naturally occuring sequences such as Aβ peptides that are unstructured as monomers. They form parallel and antiparallel β-sheets that are stabilized by interchain contacts between the hydrophobic patch (LVFFA) as well as complimentary electrostatic interactions (Balbach et al. 2000). The PD we observe may be thought of as an analog of the dimer of Aβ peptides. The formation of a stable PD requires sequences in which there are many contiguous hydrophobic residues.
If topologically forbidden contacts (see Materials and Methods) are allowed to form, then additional low-energy conformations such as the variant dimer VD (Fig. 6d ▶), which has an energy of −33.4, can form. The monomers in the VD state are compact and highly ordered. For reasons explained in Materials and Methods, we believe that the VD conformation is an artifact of lattice models.
Dimerization kinetics: Dependence on T and C
The aggregation kinetics in the nonpropagating LMSC model protein should be qualitatively different from the two-dimensional prion-like behavior found in the HCPC model. In the HCPC model the formation of the R2 state either from U or N requires conformational change to the R state in each chain prior to assembly. In contrast, the formation of OD in the LMSC model requires that both chains fold to the native conformation with precise relative orientation so that the native interface may be created. Because large conformational changes do not occur at the (T,C) values that we have examined, it is likely that higher order oligmoers do not form for this sequence.
The most popular hypothesis for protein aggregation (London et al. 1974; Speed et al. 1995; Fink 1998) is that, in the folding process or due to fluctuations, partially folded intermediates are populated. These structures, which typically have some exposed hydrophobic residues, can aggregate. The morphology of such aggregates could be either ordered (amyloid fibrils) or amorphous (inclusion bodies). The hallmark of this hypothesis is that the formation of an aggregation-prone intermediate is a prerequisite for polymerization. Experiments on a number of proteins under a wide range of conditions support this model (Fink 1998).
Recently, Silow et al. (1999) have shown that aggregates, presumably ordered ones, can form in CI2. It is well known that this small single-domain protein folds by two-state kinetics when C → 0. Silow et al. (1999) asserted that CI2 aggregation takes place directly from U because there are no intermediates that form under a wide range of conditions. If oligomerization takes place directly from U, this should be reflected in the dynamic cooperativity of the aggregation kinetics. To provide a picture of the assembly process, we simulated the dimerization kinetics for the three-dimensional sequence which, like CI2, folds kinetically in a single step with a τF = 2 × 10⁶ MCS at T = TF (0.26) (Klimov and Thirumalai 1998).
Because very long times are required to probe aggregation kinetics in LMSC we have not performed as exhaustive simulations as for the HCPC model. Typically, we generated between 10–50 trajectories for a time period ranging from (50–500) τF, from which meaningful conclusions can be drawn. Although we have explored the dimerization kinetics for a range of (T,C) values, here we focus on conditions under which the ordered dimer (OD) forms (Fig. 7 ▶). The OD (Fig. 6a ▶), which has an energy of −33.4, consists of the two chains in their native conformation (each with energy −14.5 and side chain [sc] side chain contacts) with a well-defined interface made of eight sc–sc contacts. To monitor the formation of the OD, we followed the time evolution of χs and χint (eqs. 8 and 10 in Materials and Methods). The transition to OD occurs when both χs and χint ≈ 0 for a particular trajectory. Among the 40 trajectories of maximum duration of at most 4 × 10⁸ MCS (that is, 200 τF), only 65% reach the OD. In the remaining trajectories either one or both chains fold. There are also trajectories when neither chain folds. Thus, the pathways to the OD are similar to those in Figure 2a ▶ except the time scales in the LMSC are extremely long. Among the remaining trajectories, 15% reach the DS dimer and 20% reach the PD conformation. A high degree of order is present in the PD conformation where each chain has 18 sc–sc intrachain contacts (out of which 15 are native). A characteristic of all these three types of conformations (OD, DS, and PD) is that each chain has a total (intra- and interchain) of 28 or 29 sc–sc contacts.
Although the yield of OD during the above-mentioned duration is only 65%, the analysis of the trajectories that reach the OD reveals that there are at least two pathways in the assembly of the oligomer: (1) the two chains fold simultaneously, and the OD is found immediately afterwards (that is, the folded chains have proper relative orientation leading to the formation of the native interface); (2) there is a considerable difference between the times when each of the two chains first reaches its native state and between the time the slowest chain folds and the formation of the OD. The first pathway is the minor one (35%), with an average assembly time of ∼34 τF, while the second pathway corresponds to an average conversion time of ∼100 τF.
The time evolution of χs and χint at T = 0.24 (i.e., <TF) (Fig. 8a,b ▶) shows that there is dynamic cooperativity in the formation of OD. At t ≈ 3 × 10⁷ MCS both χs and χint ≈ 0, indicating the formation of the OD. Thus, the formation of the folded monomer as well as the proper native interface occurs simultaneously. Although there are fluctuations in the OD after its formation, they are relatively small. The OD is stable under these conditions of (T,C). Our computations support the finding by Silow et al. (1999) that aggregation can proceed directly from U without the need to populate partially folded intermediates.
Fig. 8.
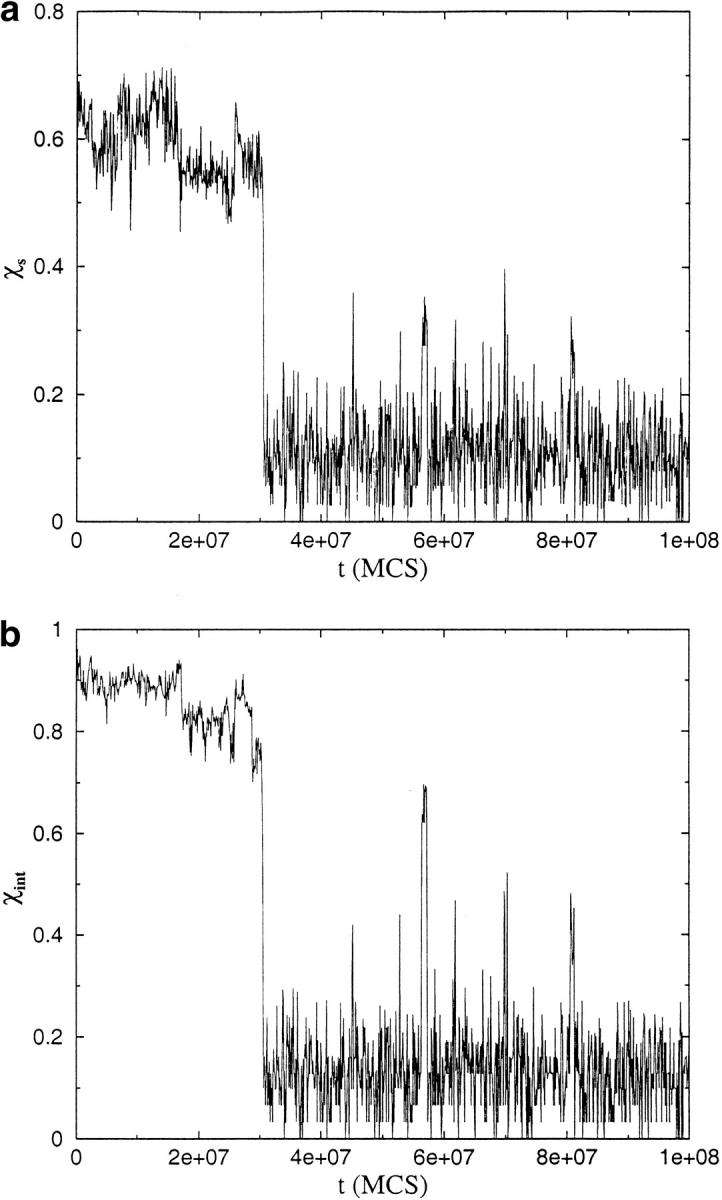
Dynamics of dimerization in a trajectory monitoring the formation of the ordered dimer OD starting from U at T = 0.24 (TF = 0.26 for the monomer). The value of C corresponds to Rcm =4.50 (eq. 6). The folding time for the monomer is 2 × 10⁶ MCS. (a) Plot of the time dependence of χs (eqs. 8 and 9) that monitors the formation of a single chain in the conformation that it takes in the oligomer. In the OD, the individual chains fold to N, the native monomeric state. At t ≈ 15 τF, the order parameter χs ≈ 0 in a dynamically cooperative manner. This shows that the chain folds to N. (b) Time dependence of χint (eq. 10) that probes the formation of the native interface between the chains. As in (a) χint ≈ 0 occurs at t ≈ 15 τF, which shows that the formation of all native intra- and interchain contacts occurs cooperatively. Both plots show that there are fluctuations within the basin of attraction corresponding to OD.
Discussion
Prion-like features
An interesting feature of the HCPC model is that it captures some general aspects of prion-like behavior. The propagation of the R mode, involving large conformational fluctuations from U or the N state, leads to "β-sheet"-like oligomers. The two-dimensional HCPC model shows that transient population of the R state is required for nucleation and growth. Because of the larger number of routes (smaller entropic barrier) to the R state from U than from N, the assembly of oligomers is more likely to occur from U than from the N state. This supports the observation that conversion to amyloid formation is more likely in denaturing conditions.
In the oligomerization process, especially in the three-dimensional model with side chains, we found several distinct structures for the dimer. The three basins of attraction correspond to OD, DS, and PD. The simulations show that the interbasins transitions do not occur on the long time scale of the simulations, suggesting that these structures are separated by fairly substantial barriers. We also found that kinetic partitioning into these structures occurs very early in the assembly process, and depends on the initial conditions. Although a direct comparison to prion strains using these toy models is a stretch, finding that distinct conformers assemble on distinct time scales with vastly different structures is not inconsistent with the explanation of scrapie strains. A similar suggestion has been made before using lattice models (Harrison et al. 1999). Bessen et al. (1995) have suggested, based on biochemical studies of hyper and drowsy strains in mink, that different strains reflect distinct ways in which the altered conformation of normal PrPC packs. If the time for nucleating a particular structure is shorter than for transitions between various conformers, then the growth of the polymer will depend on the structure of the crystal seed. In our model systems the OD, despite having the lowest free energy, will not be formed if conditions favor the formation of an alternative packing (PD or DS), that is, if the initial partitioning leads to DS or PD.
Generic aspects of protein aggregation
One of the most significant findings in this work is the richness of the phase diagram even in simple toy models. For both models there are a number of structures that form depending on the (T,C) values. The simulations also show that aggregability critically depends on the sequence. For the HCPC sequence the most likely structure of the polymer, Rn, resembles β-sheet architecture. Although RnDS is, in principle, possible, it appears to be kinetically and thermodynamically unstable for this sequence. A bewildering number of "phases" are possible in the lattice model with side chains. There are six phases in all (Fig. 7 ▶). More remarkably, in region IV (ordered oligomers in Fig. 7 ▶) there are additional structures that emerge. The amazing array of structures can be experimentally probed in the (D,C) plane where D is the concentration of denaturants.
The present study and the one by Harrison et al. (2001) show that the phase diagram depends on the precise sequence. A single-point mutation in the HCPC sequence can result in nonpropagating oligomers (Harrison et al. 2001). This remarkable observation can be rationalized in terms of the stability of the monomeric native state or the topology of N. Similarly, the emergence of PD in the LMSC, which is reminiscent of the Aβ dimer, is related to the presence of a large number of contiguous hydrophobic residues. For example, we find that for another sequence (HWFIGYQRWFRKEWM) in the LMSC model the oligomeric structures are different. In particular, this sequence, which has the same native state as in Figure 6a ▶, undergoes a conformational change upon dimerization that is similar to that seen in HCPC and amyloid forming peptides (R.I. Dima and D. Thirumalai, unpubl.).
Aggregation mechanisms
The two models provide contrasting mechanisms for oligomerization kinetics. In the HCPC model, dimerization and subsequent growth occur only when a high-energy intermediate is transiently populated. For this case, the growth of the polymer is facilitated by the presence of a template made of the minimal dimer propagating unit. Although a complete test of nucleation polymerization including the presence of lag time has not been demonstrated, our calculations show that growth of the polymer occurs if a dimer "seed" is already present. This is in conformity with the current model for fibril formation in amyloids and prions (Harper and Lansbury 1997). Our computations also support the notion that aggregation occurs from intermediates.
On the other hand, the LMSC model sequence, which is a two-state folder, dimerizes directly from U. The formation of OD is dynamically cooperative. This finding supports the experiments on U1A and CI2 (Silow et al. 1999) in which ordered aggregates form from U rather than from partially structured intermediates. Our calculations and a growing body of experimental work show that many scenarios for protein aggregation are possible. Besides the patterns of hydrophobic-hydrophilic residues in the sequence (West et al. 1999), external conditions (pH, protein concentration, denaturants, presence of a seed, and temperature) can alter the aggregation mechanism.
Folding and aggregation: Evolutionary implications
It is clear that oligomers (ordered or amorphous) can form, depending on the (T,C) values. Because aggregation can take place directly from U, just as seen in CI2 (Silow et al. 1999), the relationship between aggregability and folding depends not only on the sequence, but also on the external conditions. Designing sequences that avoid aggregation over a broad range of external conditions might require optimizing the folding rates such that they are considerably longer than the equivalent pseudo first-order rates for oligomerization. We also find that fluctuations in the native conformation can result in aggregation and, therefore, a designed sequence must also satisfy certain stability requirements. Thus, natural sequences may have evolved to simultaneously optimize both folding rates and stability for a range of (T,C) values. The two requirements might not be simultaneously satisfied for certain folds, and therefore, the evolved sequences could be a compromise. These arguments emphasize the need for considering aggregation in conjunction with folding (Smith and Hall 2001) to decipher the mechanisms by which a monomeric protein reaches the native state.
Materials and methods
Two-dimensional propagatable model
To study the self-propagation that mimics prion-like behavior we use a two-dimensional lattice model that is constructed from four kinds of monomers H, P, A, and B (Harrison et al. 2001). Monomers H and P represent hydrophobic and polar residues, while A and B mimick the behavior of oppositely charged amino acids. This is a generalization of the familiar HP model (Dill et al. 1995). The energy of a conformation, which is specified by the coordinates ri (i =1, 2, 3 . . . N), is
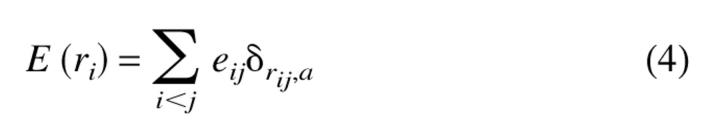 |
(4) |
where rij = |ri − rj| and α is the lattice spacing. The contact energies are eH,H = −4ɛ, eH,P = −2ɛ, eH,A = −1ɛ, eH,B = −1ɛ, eP,P = −3ɛ, eP,A = −2ɛ, eP,B = −2ɛ, eA,A = 0ɛ, eA,B = −5ɛ, eB,B = 0ɛ, with ɛ > 0. Following Harrison et al., we chose the sequence in Figure 1 ▶ for probing the dynamics of self-assembly and propagation. Exact enumeration of all conformations of the 16-mer chain allows us to calculate exactly the thermodynamic characteristics of the monomer.
Three-dimensional lattice models with side chains (LMSC)
To compute the generic phase diagram and oligomerization kinetics of two-state proteins we consider a more realistic representation of the polypeptide chain. In the LMSC model each aminoacid residue is represented as two beads: one corresponding to the α-carbon, and the other to the center of mass of the side chain (Bromberg and Dill 1994; Klimov and Thirumalai 1998). The α-carbon beads, representing the backbone, are connected, and the side chain beads are connected by a covalent linkage to one backbone bead. The energy of a conformation is given by
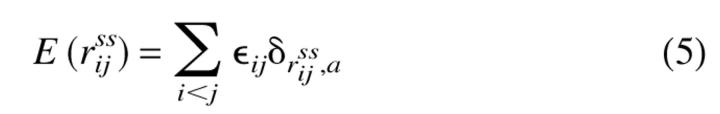 |
(5) |
that is, whenever two side chain (ss) beads are near neighbors on a lattice there is a contact interaction energy that depends on the identity of the beads. The interaction matrix elements ɛij are taken from Table III of Kolinski, Godzik, and Skolnick (KGS) (Kolinski et al. 1993). For this three-dimensional model enumeration of all the conformations even for N = 15 is not possible. The thermodynamic properties for the sequence, labeled A in Klimov and Thirumalai (1998), are calculated using multiple histogram methods.
Mimicking the effects of concentration of the polypeptide chain
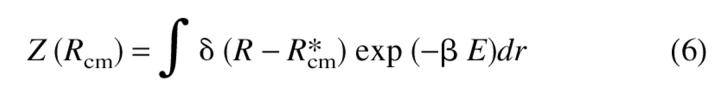
Protein aggregation occurs only when two polypeptide chains interact. To obtain accurate phase diagrams and the kinetics of association, multichain simulations are needed. Because such simulations are computationally intensive we devise a simple protocol to ensure that two chains interact. To describe our method it is useful to recall that whenever the protein concentration C exceeds the overlap concentration C* ⋍ N/Rg3 (Rg is the radius of the polypeptide chain), there is protein–protein interaction. This estimate for C* assumes that the interaction between proteins is short ranged. If electrostatic interactions play a role, then Rg should be replaced by Rgapp, where Rgapp (>Rg) is the range over which the electrostatic potential is significant. For C < C*, the solution is dilute enough so that one can only observe monomeric folding. For a given value of C the mean distance between the centers of mass of two chains is R*cm ⋍ C−1/3. Thus, the effect of concentration can be approximately mimicked by considering the restricted partition function
 |
(6) |
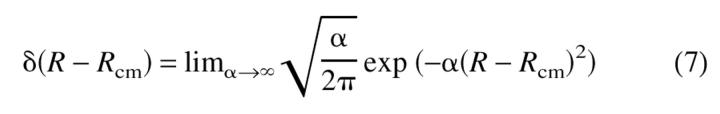
In the partition function for the two-chain system, Z(R), the distance between the centers of mass of the chains is pinned at a distance that depends on the concentration. In equation 6, E is the total energy of the two chains, dr involves integration over the coordinates of the two chains, and β = 1/kBT. For Rcm/Rg ≫ 1, the chains are noninteracting, while for Rcm ∼Rg chain association is possible. This way of incorporating the effect of C in the simulations allows us to obtain the qualitative features of the phase diagram in the (T,C) plane. In the simulations, the Δ function constraint is replaced by
 |
(7) |
Notice that according to equation 7 the fluctuations in R are of the order  –, which need not be an integer. In practice, to probe dimer formation in the 2D case, we let Rcm = 3.50, which is large enough to allow each chain to fold independently to its monomeric native state. This value also allows for interaction between chains so that dimerization can occur. Typically, α = 1.0. In the case of the TA calculations, Rcm is the distance between the centers of mass of the template and of the free monomer. A direct way of including concentration effects in simulations is to have many chains in a box, as has been done by Gupta et al. (1998) in their two-dimensional HP lattice model (Dill et al. 1995). For a similar model Istrail et al. (1999) probed aggregation by allowing two independently folding chains to collide. By measuring the energies in the kinetics simulations for aggregation, they compute the probability of dimer formation. In the simulations of HCPC (Harrison et al. 2001), the chains are forced to interact by recentering them periodically. This is achieved by having a center of mass translation every 106 MCS. Because of forced interactions, molecular crowding effects are mimicked. Our method of involving the concentration effects may be viewed as a mean-field limit of simulation in a periodic box. The effect of other chains at finite concentration is to force any two chains to move within Rcm ≈ C−1/3.
Probes of aggregation kinetics
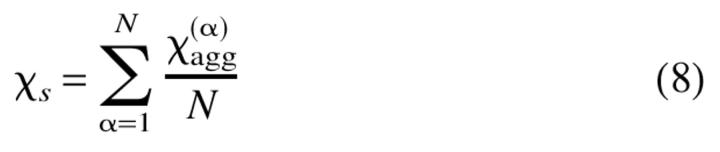
To characterize the evolution of the ensemble of chains towards its ground state conformation, we defined two-order parameters analogous to the overlap function for a monomeric protein (Camacho and Thirumalai 1993), χs and χint, given by:
 |
(8) |
where N is the total number of chains in the ensemble and
 |
(9) |
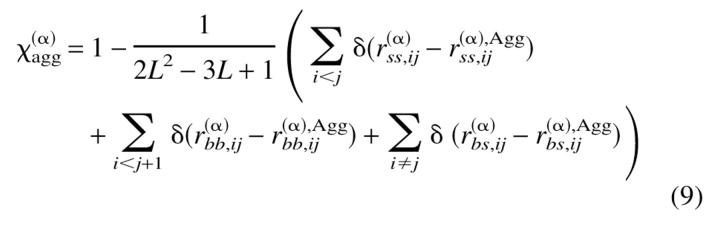
where α = 1, . . . , N is the chain number and
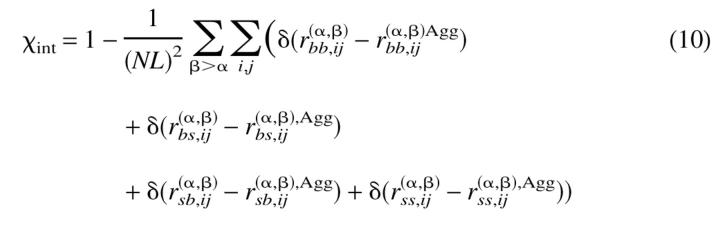 |
(10) |
In the above expressions, L is the length of each chain (15 beads in our case) while r(α)bb;ij, r(α)ss;ij, and r(α)bs;ij refer to the distance between the backbone beads, between side beads, and between backbone and side beads of chain α. Agg refers to the ground-state conformation of the ensemble of two chains. r(α,β)bb;ij, r(α,β)ss;ij, r(α,β)bs;ij, and r(α,β)sb;ij refer to the distance between the backbone beads i and j from any two chains α and β, between the side beads from two chains, between the backbone beads of chain α and side beads of chain β, and between the side beads of chains α and β. Therefore, χs = 0 implies that the chains are in their corresponding conformations from the ground state of the oligomer, while χint = 0 if the interface between the chains coincides with the native state of the oligomer. Both χs and χint are order parameters that determine the extent to which a given dimer conformation resembles its native state. In particular, χs is a measure of the degree of similarity between the conformation of the monomers and their structures in the native state of the dimer. The order parameter χint is a measure of how similar the interface between the monomers in an arbitrary conformation is to the one in the native dimeric state.
Move sets in Monte Carlo simulations
For the 2D lattice simulations, we used the standard moves: corner flip, ends rotation, and crankshaft rotation with equal probability (Harrison et al. 2001). The rotation of the chain ends consists in rotating one or more beads at the end of the chain. The probability to rotate a number of beads was selected to decay exponentially with increasing number of beads.
For the 3D simulations we used a model with side chains and, therefore, we introduced a new move that consists of the rotation of the side chain around its backbone bead. Additional moves were the corner flip and ends rotation of the backbone beads, but each of them was followed by a rotation of the side chains connected to the moved backbone beads. The probabilities were 0.50 for just the side chain rotation, 0.33 for the corner flip, and 0.17 for the ends rotation. To mimic large-scale motions that can occur during the aggregation of real proteins, we introduced an overall rotation of a chain around its center of mass every 107 MCS and a translation (with one lattice spacing) of one chain with respect to the other chain every 5 × 10⁶ MCS.
The standard Metropolis criterion (Metropolis et al. 1953) was used to accept or reject the motions. In all our calculations we set the Boltzmann constant to 1. Unless otherwise indicated in the text, each folding simulation starts at a high temperature (usually ∼10× the desired temperature). The chains are equilibrated at high temperatures. Then they are suddenly quenched to the desired temperature and the starting conformation is the last conformation reached at the high temperature. The time to fold the chains into the native conformation of the ensemble (at the corresponding [T,C]) is called conversion time. As in any standard MC procedure, all attempted moves contribute equally to the conversion time regardless of whether they succeed or fail.
Computation of the phase diagrams
A topological restriction in lattice models is that, in the monomer, contacts between odd or even numbered nonbonded beads are forbidden. For example, all contacts on a cubic lattice are between beads 2j and (2l + 1). However, these disallowed contacts can occur in the oligomeric state. Because they do not occur normally in the monomer we prevent their formation in the dimer as well by letting ɛαβ2j,2l = 0 and ɛ αβ2j + 1,2l + 1= 0, where α and β refer to the chains. This prevents the formation of "unusual" dimer structures that are artifacts of the lattice representation of the polypeptide chain. For completeness, we verified that such structures, which are dead ends on the simulation time scale, do form when the topologically forbidden contacts are allowed. In real proteins there are no obvious topological restrictions.
To obtain the phase diagram in the (T,C) plane, we determined the minimum free energy conformations of the two-chain system. The free energy is obtained by maximizing the restricted partition function Z(Rcm) (eq. 6). The structures in the various basins of attraction for a given (T,C) represent the free energy minima. The low-temperature conformations are searched by linearly decreasing the temperature as Ti = Ti−1 − ΔT, where ΔT = 0.10. For each value of (T,C) multiple (between 5–10) trajectories are generated to ensure that the low-energy conformations are truly equilibrium structures. We also ran trajectories at constant temperature (T = 0.24), but linearly decreasing the distance Rcm (that is, increasing the concentration). We started from a large Rcm (small concentration) and α = 1.0 with heating at T = 0.50. Then we quenched the system to T = 0.24 and we ran 1 × 10⁸ MCS at each Rcm(i + 1) = Rcm(i) − 1 (using the last conformation from Rcm(i) as starting conformation for Rcm(i + 1).
Acknowledgments
We are grateful to D.K. Klimov for several insightful comments and for pointing out the role of topologically disallowed contacts in lattice models of aggregation. This work was supported in part by a grant from the National Institutes of Health through grant IR01 NS41356-01.
The publication costs of this article were defrayed in part by payment of page charges. This article must therefore be hereby marked "advertisement" in accordance with 18 USC section 1734 solely to indicate this fact.
Article and publication are at http://www.proteinscience.org/cgi/doi/10.1110/ps.4220102.
References
- Balbach, J.J., Ishii, Y., Antzntkin, O.N., Leapman, R.D., Rizzo, N.W., Dyda, F., Reed, J., and Tycko, R. 2000. Amyloid fibril formation by Aβ16–22, a seven-residue fragment of the Alzhemier's β-Amyloid peptide, and structural characterization by solid state NMR. Biochemistry 34 13748–13759. [DOI] [PubMed] [Google Scholar]
- Bennett, M.J., Schlunegger, P.M., and Eisenberg D. 1995. 3D domain swapping: A mechanism for oligomer assembly. Protein Sci. 4 2455–2468. [DOI] [PMC free article] [PubMed] [Google Scholar]
- Bessen, R.A., Kocisko, D.A., Raymond, G.J., Nandan, S., Lansbury, P.T., and Caughey, B. 1995. Non-genetic propagation of strain-specific properties of scrapie prion protein. Nature 375 698–700. [DOI] [PubMed] [Google Scholar]
- Booth, D.R., Sunde, M., Belotti, V., Robinson, C.V., Hutchinson, W., Fraser, P.E., Hawkins, P.W., Dobson, C.M., Raiford, S.E., and Blake, C.C. 1997. Instability, unfolding and aggregation of human lysozyme variants underlying amyloid fibrilogenesis. Nature 385 787–793. [DOI] [PubMed] [Google Scholar]
- Broglia, R.A., Tiana, G., Pasquali, S., Roman, H.E., and Vigezzi, E. 1998. Folding and aggregation of designed proteins. Proc. Natl. Acad. Sci. 95 12930–12933. [DOI] [PMC free article] [PubMed] [Google Scholar]
- Bromberg, S. and Dill, K.A. 1994. Sidechain entropy and packing in proteins. Protein Sci. 3 997–1009. [DOI] [PMC free article] [PubMed] [Google Scholar]
- Camacho, C. and Thirumalai, D. 1993. Kinetics and thermodynamics of folding in model proteins. Proc. Natl. Acad. Sci. 90 6369–6372. [DOI] [PMC free article] [PubMed] [Google Scholar]
- Chiti, F., Webster, P., Taddei, N., Clark, A., and Dobson, C.M. 1999. Designing conditions for in vitro formation of amyloid protofilaments and fibrils. Proc. Natl. Acad. Sci. 96 3590–3594. [DOI] [PMC free article] [PubMed] [Google Scholar]
- Cohen, F.E. and Prusiner, S.B. 1998. Pathological conformations of prion proteins. Annu. Rev. Biochem. 67 793–819. [DOI] [PubMed] [Google Scholar]
- Collinge, J., Sidle, K.C., Meads, J., Ironside, J., and Hill, A.F. 1996. Molecular analysis of prion strain variation and the etiology of new variant CJD. Nature 383 685–690. [DOI] [PubMed] [Google Scholar]
- DeYoung, L.R., Fink, A.L., and Dill, K.A. 1993. Aggregation of globular proteins. Acc. Chem. Res. 26 614–620. [Google Scholar]
- Dill, K.A., Bomberg, S., Yue, K.Z., Fiebig, K.M., Yee, D.P., Thomas, P.D., and Chan, H.S. 1995. Principles of protein-folding—A perspective from simple exact models. Protein Sci. 4 561–602. [DOI] [PMC free article] [PubMed] [Google Scholar]
- Fersht, A.R. 1997. Nucleation mechanism of protein folding. Curr. Opin. Struct. Biol. 7 10–14. [DOI] [PubMed] [Google Scholar]
- Fink, A.L. 1998. Protein aggregation: Folding aggregates, inclusion bodies and amyloid. Fold. Design 3 R9–R23. [DOI] [PubMed] [Google Scholar]
- Giugliarelli, G., Micheletti, C., Banavar, J.R., and Maritan, A. 2000. Compactness, aggregation, and the prionlike behavior of protein: A lattice model study. J. Chem. Phys. 113 5072–5077. [Google Scholar]
- Griffith, J.S. 1967. Self-replication and scrapie. Nature 215 1043–1044. [DOI] [PubMed] [Google Scholar]
- Guo, Z. and Thirumalai, D. 1995. Kinetics of protein folding: Nucleation mechanism, time scales, and pathwyas. Biopolymers 36 83–102. [Google Scholar]
- Gupta, P., Hall, C.K., and Voegler, A.C. 1998. Effect of denaturant and protein concentrations upon protein refolding and aggregation: A simple lattice model. Protein Sci. 7 2642–2652. [DOI] [PMC free article] [PubMed] [Google Scholar]
- Harper, J.D. and Lansbury Jr., P.T. 1997. Models of amyloid seeding in Alzhemier's disease and scrapie: Mechanistic truths and physiological consequences of time-dependent stability of amyloid proteins. Annu. Rev. Biochem. 66 385–407. [DOI] [PubMed] [Google Scholar]
- Harrison, P.M., Chan, H.S., Prusiner, S.B., and Cohen, F.E. 1999. Thermodynamics of model prions and its implications for the problem of prion protein folding. J. Mol. Biol. 286 593–606. [DOI] [PubMed] [Google Scholar]
- ———. 2001. Conformational propagation with prion-like characteristics in a simple model of protein folding. Protein Sci. 10 819–835. [DOI] [PMC free article] [PubMed] [Google Scholar]
- Istrail, S., Schwartz, R., and King, J. 1999. Lattice simulations of protein aggregation. J. Comp. Biol. 6 143–162. [DOI] [PubMed] [Google Scholar]
- Jaenicke, R. 1995. Folding and association versus misfolding and aggregation of proteins. Philos. Trans. R. Soc. Lond. B 348 97–105. [DOI] [PubMed] [Google Scholar]
- Janowski, R., Kozak, M., Jankowska, E., Grzonka, Z., Grubb, A., Abrahamson, M., and Jaskolski, M. 2001. Human cystatin C, an amyloidogenic protein, dimerizes through three-dimensional domain swapping. Nat. Struct. Biol. 8 316–320. [DOI] [PubMed] [Google Scholar]
- Jarrett, J.T. and Lansbury, P.T. 1993. Seeding one dimensional crystallization of amyloid: A pathogenic mechanism of Alzheimer's disease and scrapie? Cell 73 1055–1058. [DOI] [PubMed] [Google Scholar]
- Jimenez, J.L., Guijaro, J.L., Orlova, E., Zurdo, J., and Dobson, C.M. 1999. Cryo-electron microscopy structure of an SH3 amyloid fibril and model of the molecular packing. EMBO J. 18 815–821. [DOI] [PMC free article] [PubMed] [Google Scholar]
- Kelly, J.W. 1996. Alternative conformations of amyloidogenic proteins govern their behavior. Curr. Opin. Struct. Biol. 6 11–17. [DOI] [PubMed] [Google Scholar]
- Kiefhaber, T. 1995. Kinetic traps in lysozyme folding. Proc. Natl. Acad. Sci. 92 9029–9033. [DOI] [PMC free article] [PubMed] [Google Scholar]
- Klimov, D.K. and Thirumalai, D. 1998. Cooperativity in protein folding: From lattice models with sidechains to real proteins. Fold. Design 3 127–139. [DOI] [PubMed] [Google Scholar]
- ———. 2001. Multiple protein folding nuclei and the transition state ensemble in two-state proteins. Proteins Struct. Funct. Genet. 43 465–475. [DOI] [PubMed] [Google Scholar]
- Kolinski, A., Godzik, A., and Skolnick, J. 1993. A general method for the prediction of the three dimensional structure and folding pathway of globular proteins: Application to designed helical proteins. J. Chem. Phys. 98 7420–7433. [Google Scholar]
- Liu, Y., Gotte, G., Libonati, M., and Eisenberg, D. 2001. A domain-swapped RNase A dimer with implications for amyloid formation. Nat. Struct. Biol. 8 211–214. [DOI] [PubMed] [Google Scholar]
- London, J., Su, C., and Goldberg, M.E. 1974. Renaturation of Escherichia coli tryptophanase after exposure to 8M urea. Evidence for the existence of nucleation centers. Eur. J. Biochem. 47 409–415. [DOI] [PubMed] [Google Scholar]
- Massi, F. and Straub, J.E. 2001. Energy landscape theory for Alzheimer's amyloid β-peptide fibril elongation. Proteins Struct. Funct. Genet. 42 217–229. [DOI] [PubMed] [Google Scholar]
- Matagne, A., Radford, S.E., and Dobson, C.M. 1997. Fast and slow tracks in the lysozyme folding: Insight into the role of domains in the folding process. J. Mol. Biol. 267 1068–1074. [DOI] [PubMed] [Google Scholar]
- Metropolis, N., Rosenbluth, A.W., Rosenbluth, M.N., Teller, A., and Teller, E. 1953. Monte-Carlo method. J. Chem. Phys. 21 1087–1092. [Google Scholar]
- Mitraki, A. and King, J. 1989. Protein folding intermediates and inclusion body formation. Biotechnology (NY) 7 690–697. [Google Scholar]
- Prusiner, S.B. 1998. Prions. Proc. Natl. Acad. Sci. 95 13363–13383. [DOI] [PMC free article] [PubMed] [Google Scholar]
- Riek, R., Hornemann, S., Wider, G., Billeter, M., Glockshuber, R., and Wuthrich, K. 1996. NMR structure of the mouse prion protein domain PrP(121–231). Nature 382 180–182. [DOI] [PubMed] [Google Scholar]
- Safar, J., Wille, H., Itri, V., Groth, D., Serban, H., Torchia, M., Cohen, F.E., and Prusiner, S.B. 1998. Eight prion strains have PrP Sc molecules with different conformations. Nat. Med. 4 1157–1165. [DOI] [PubMed] [Google Scholar]
- Silow, M. and Oliveberg, M. 1997. Transient aggregates in protein folding are easily mistaken for folding intermediates. Proc. Natl. Acad. Sci. 94 6084–6086. [DOI] [PMC free article] [PubMed] [Google Scholar]
- Silow, M., Tan, Y.J., Fersht, A.R., and Oliveberg, M. 1999. Formation of short-lived protein aggregates directly from coil in two-state folding. Biochemistry 38 13006–13012. [DOI] [PubMed] [Google Scholar]
- Sipe, J.D. 1992. Amyloidosis. Annu. Rev. Biochem. 61 947–975. [DOI] [PubMed] [Google Scholar]
- Smith, A.V. and Hall, C.K. 2001. Protein refolding versus aggregation: Computer simulations on an intermediate-resolution protein model. J. Mol. Biol. 312 187–202. [DOI] [PubMed] [Google Scholar]
- Speed, M.A., Wang, D.I., and King, J. 1995. Multimeric intermediates in the pathway to the aggregated inclusion body state for P22 tailspike polypeptide chains. Protein Sci. 4 900–908. [DOI] [PMC free article] [PubMed] [Google Scholar]
- Telling, G.C., Parchi, P., DeArmond, S.J., Cortelli, P., Montagna, P., Gabizon, R., Mastrianni, J., Lugaresi, E., Gambetti, P., and Prusiner, S.B. 1996. Evidence for the conformation of the pathologic isoform of the prion protein enciphering and propagating prion diversity. Science 274 2079–2082. [DOI] [PubMed] [Google Scholar]
- West, M.W., Wang, W., Patterson, J., Mancias, J.D., Beasley, J.R., and Hecht, M.H. 1999. De novo amyloid proteins from designed combinatorial libraries. Proc. Natl. Acad. Sci. 96 11211–11216. [DOI] [PMC free article] [PubMed] [Google Scholar]
- Wetzel, R. 1996. For protein misassembly it's like the "I" decade. Cell 86 699–702. [DOI] [PubMed] [Google Scholar]