

Abstract
The temperature dependence of the enantioselectivity of Candida antarctica lipase B for 3-hexanol, 2-butanol, 3-methyl-2-butanol, 3,3-dimethyl-2-butanol, and 1-bromo-2-butanol revealed that the differential activation entropy, ΔR−SΔS‡, was as significant as the differential activation enthalpy, ΔR−SΔH‡, to the enantiomeric ratio, E. 1-Bromo-2-butanol, with isosteric substituents, displayed the largest ΔR−SΔS‡. 3-Hexanol displayed, contrary to other sec-alcohols, a positive ΔR−SΔS‡. In other words, for 3-hexanol the preferred R-enantiomer is not only favored by enthalpy but also by entropy. Molecular dynamics (MD) simulations and systematic search calculations of the substrate accessible volume within the active site revealed that the (R)-3-hexanol transition state (TS) accessed a larger volume within the active site than the (S)-3-hexanol TS. This correlates well with the higher TS entropy of (R)-3-hexanol. In addition, this enantiomer did also yield a higher number of allowed conformations, N, from the systematic search routines, than did the S-enantiomer. The substrate accessible volume was greater for the enantiomer preferred by entropy also for 2-butanol. For 3,3-dimethyl-2-butanol, however, neither MD-simulations nor systematic search calculations yielded substrate accessible volumes that correlate to TS entropy. Ambiguous results were achieved for 3-methyl-2-butanol.
Keywords: Molecular dynamics, systematic search, enthalpy, enantiomeric ratio, Candida antarctica
Enzyme-catalyzed reactions have become popular alternatives to classical chemistry, and several industrial processes using enzymes are now in use (Liese and Filho 1999; Carrea and Riva 2000). High selectivity and activity under mild reaction conditions are some of the advantages. The impressive enantioselectivity displayed by many enzymes is a particularly appealing property that is being exploited as the need for enantiopure substances has increased dramatically over the years (Schulze and Wubbolts 1999).
Candida antarctica lipase B (CALB) is a widely used commercial enzyme proven to be robust and stable and hence used for many applications (Anderson et al. 1998). In particular its very high enantioselectivity to many sec-alcohols has been found most useful. In 1998 Orrenius et al. proposed a model of the mechanism of how this enzyme distinguishes between the enantiomers of sec-alcohols (Orrenius et al. 1998). Experimental and molecular modeling research showed that two different productive binding modes were necessary to allow both enantiomers to develop the hydrogen-bonding pattern within the active site that is required for catalysis. A schematic picture of the active site and the two productive binding modes are presented in Figure 1 ▶.
Fig. 1.

Simplified scheme of the two productive binding modes in the model proposed by Orrenius et al. (1998) that rationalize the enantioselectivity of Candida antarctica lipase B for sec-alcohols. (A) Fast-reacting enantiomer. (B) Slow-reacting enantiomer. M, medium-sized substituent; L, large-sized substituent.
In 1992 Phillips pointed out that enantioselectivity is the result of differences between the enantiomers, not only in activation enthalpy but also in activation entropy (Phillips 1992):
 |
(1) |
By determination of the temperature dependence of the enantiomeric ratio, E, the contributions of differential activation enthalpy, ΔR−SΔH‡, and entropy, ΔR−SΔS‡, to enantioselectivity can be determined. Contrary to what was first assumed, the entropic component of the free energy of activation is as important as the enthalpic component for the enantioselectivity of CALB (Overbeeke et al. 1999; Ottosson and Hult 2001; Ottosson et al. 2001). However, the model of Orrenius et al. (1998) does not include any considerations of the differences in entropy between the enantiomers.
Being able to predict the enantiomeric ratio, E, of an enzyme with computer modeling would save much time and resources nowadays spent in screening for the optimal biocatalyst. Much research and development has consequently been aimed at developing computer methods for this (for review, see Kazlauskas 2000). The contribution of differential activation entropy has generally been neglected to date; although the inclusion of entropy in protein modeling is complex, suggestions of how to handle this component have recently started to appear in the literature (Strajbl et al. 2000; Villa et al. 2000).
The present investigation presents new experimental and molecular modeling studies on the enantioselectivity of CALB towards secondary alcohols. The goal was to investigate the relation between the substrate-related component of activation entropy and the spatial freedom of the substrate in transition state. Our goals have been to expand our knowledge of how this enzyme distinguishes between enantiomers and to understand the roles of enthalpy and entropy on a molecular level.
Results
Experimental results
The temperature dependence of the enantiomeric ratio, E, was determined for transesterification of a series of sec-alcohols catalyzed by Candida antarctica lipase B, CALB. The range of the experimental temperatures and observed E-values are presented in Table 1, along with the R2-values of the linear relation of lnE and T−1. The differential activation parameters were determined based on these data, and E values and the thermodynamic components of enantioselectivity are summarized in Table 2. One notes that the enthalpic and the entropic components of the differential activation free energy, ΔR−SΔG‡, were both important to the overall success of the kinetic resolution of the enantiomers. Even 1-bromo-2-butanol, with isosteric substituents, displayed a significant entropic term of ΔR−SΔG‡. Furthermore, a particularly interesting result was observed with 3-hexanol. For this substrate, contrary to the others, ΔR−SΔH‡ and ΔR−SΔS‡ were of opposite signs.
Table 1.
Range of experimental temperatures and enantiomeric ratios, E, for CALB-catalyzed transesterifications with vinyl octanoate
| Experimental temperature range (°C) | Range of E ± one Std. dev. | ||||
| sec-alcohol | High temp. | Low temp. | High temp. | Low temp. | R2 |
| 1-bromo-2-butanol | 18.6 | 49.8 | 123 ± 9 | 48 ± 7 | 0.998 |
| 3-hexanol | 20.5 | 59.3 | 362 ± 76 | 236 ± 21 | 0.993 |
| 2-butanola | 6.1 | 59.2 | 10.7 ± 1 | 5.3 ± 0.9 | 0.952 |
| 3-methyl-2-butanolb | 6.7 | 70.3 | 1430 ± 440 | 209 ± 25 | 0.985 |
| 3,3-dimethyl-2-butanola | 10.5 | 59.4 | 690 ± 72 | 200 ± 40 | 0.988 |
The R2-value from the linear regression of lnE vs. T−1 is given.
a Data from Overbeeke et al. 1999.
b Data partly from Overbeeke et al. 1999.
Table 2.
Enantiomeric ratio, E, and its thermodynamic components for the kinetic resolution of some sec-alcohols catalyzed by Candida antqrctica lipase B
| sec-alcohol | E (298 K) | ΔR-SΔG‡ (298 K) (kJ/mol) | ΔR-SΔH‡ (kJ/mol) | TΔR-SΔS‡ (298 K) (kJ/mol) | ΔR-SΔS‡ (J/mol, K) | TR (K) |
| 1-bromo-2-butanol | 100 | −11.4 | −23.5 ± 1.0 | −12.1 ± 1.0 | −40.7 ± 3.2 | 580 |
| 3-hexanol | 340 | −14.4 | −9.0 ± 0.7 | +5.5 ± 0.7 | +18.3 ± 2.4 | −490 |
| 2-butanola | 8.3 | −5.26 | −10.7 ± 1.4 | −5.4 ± 1.4 | −18.2 ± 4.6 | 590 |
| 3-methyl-2-butanolb | 810 | −16.6 | −24.3 ± 1.1 | −7.7 ± 1.0 | −26.0 ± 3.4 | 940 |
| 3,3-dimethyl-2-butanola | 460 | −15.2 | −20.4 ± 1.3 | −5.2 ± 1.3 | −17.6 ± 4.2 | 1160 |
E at 298 K was calculated from the linear relation between lnE and T−1. Standard errors given were calculated from the linear regression.
a Data from Overbeeke et al. 1999.
b Data partly from Overbeeke et al. 1999.
Molecular dynamics simulations
To be considered a reactive model of the transition state, the hydrogen-bonding network within the active site must have one hydrogen bond between Asp187 and His224; two hydrogen bonds from His224, one to Ser105 and one to the alcohol oxygen; and at least two of the three possible hydrogen bonds between the oxyanion and the oxyanion hole (Uppenberg et al. 1994; Orrenius et al. 1998). During the 500 psec molecular dynamics (MD) simulations, the tetrahedral intermediate structures used as models of transition state (TS) sometimes lost one or two of these essential hydrogen bonds. The number of reactive TS structures in the MD simulations varied dramatically between enantiomers as well as between different substrates (Fig. 2 ▶). Only 39% of the structures of (S)-2-butanol were reactive, whereas 90% of the structures of (R)-2-butanol were reactive. For 3-hexanol, 59% of the R-enantiomers and 62% of the S-enantiomers were reactive. The nonreactive structures were evenly distributed over the 500 psec simulations (Fig. 2 ▶). The percentage of reactive TS structures did not significantly change when excluding the initial warm-up phase (10 psec) or the first 50 psec of the simulation.
Fig. 2.

Visualization of the distribution of reactive transition states in the molecular dynamics (MD) simulations (10–500 psec). Structures that did not have the intact hydrogen-bonding network required for catalysis are marked with a —. The percentage of reactive transition state structures in the MD simulation (10–500 psec) are given. The reactive structures were evenly distributed over the simulation time.
Figure 3 ▶ displays the atoms from the alcohol part of the substrates from all of the sampled structures of the MD simulations of 3-hexanol, 2-butanol, 3-methyl-2-butanol, and 3,3-dimethyl-2-butanol superimposed on four central atoms of the ester tetrahedral intermediate (see also Fig. 4 ▶ and Materials and Methods). The picture clearly shows that the ethyl substituent of both enantiomers of 2-butanol had essentially two distinctly different orientations within the active site; the γ-carbon could be positioned in two different regions of the active site. This was true for the equivalent γ-carbon in (R)-3-hexanol as well; however, in (S)-3-hexanol this carbon had essentially stayed in one position during the MD simulation. The three γ-carbons of 3,3-dimethyl-2-butanol had very little freedom to move, in neither the R- nor the S-enantiomer, and did not interchange positions with each other during the MD simulation. Some methyl groups also showed restricted rotation. Including only the reactive structures gave a practically identical picture, although with fewer structures, for all the substrates.
Fig. 3.
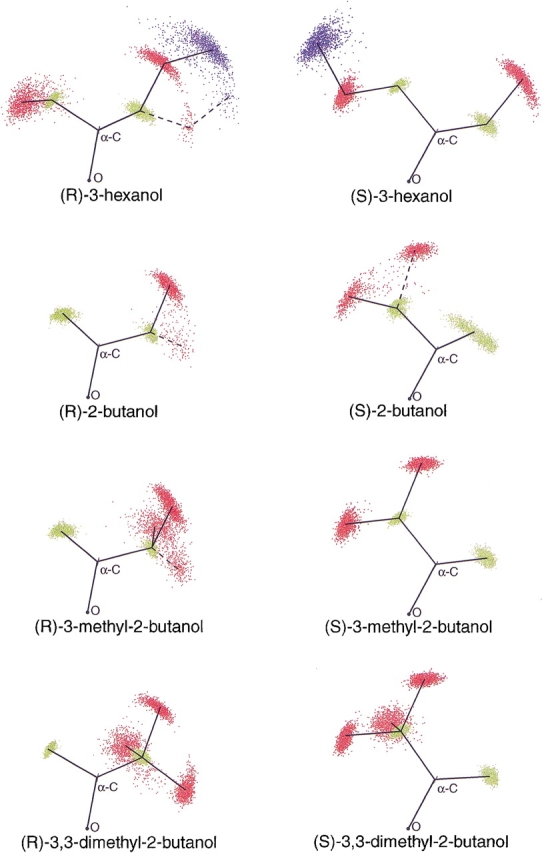
Superpositioned conformations of the alcohol part of the substrates from the MD simulations. Hydrogens are not displayed. Black, oxygen and α-carbon atoms; yellow, β-carbon atoms; red, γ-carbon atoms; green, δ-carbon atoms. Lines show connectivity between the atoms. (R)-3-hexanol, (R)-2-butanol, (S)-2-butanol, and (R)-3-methyl-2-butanol displayed several possible orientations as shown by the dashed lines. See fig. 4 ▶ for the basis of superpositioning of structures.
Fig. 4.

During superpositioning of the sampled structures from the MD simulations, atom B was kept fixed, atom C was given a weight of 100, and atom A was given a weight of 1.
The accumulated volumes in the active site that the tetrahedral intermediate occupied during the MD simulations are plotted in Figure 5 ▶ as a function of the number of sampled structures that were included from time 50 psec in the MD simulations, V50–500 psec. One may note that even after such long simulation times as 500 psec, the substrate still explored new volumes within the active site. That is, the accumulated active site volumes that the substrates had accessed, V50–500 psec, were still increasing at the end of the simulations. The volumes were also calculated including the atoms of the alcohol or the acyl part of the substrate separately (Fig. 4 ▶). The separate volumes of the parts were also increasing at 500 psec simulation time (data not shown). Inclusion of only reactive TS structures, V50–500 psecTS, did not particularly change the plots. Obviously, the V50–500 psecTS values never reached the values of V50–500 psec, especially not in the cases where the fraction of reactive TS of the total was low. Another intriguing observation is displayed in Figure 6 ▶. In the MD simulation, the S-enantiomer of 3-hexanol occupied a volume in the active site during the time 10–50 psec that it never returned to, which is shown by our observation that the level of V50–500 psec never reached the volume calculated from 10 psec, V10–500 psec. One may also note that for V10–500 psec, the S-enantiomer experienced a larger accessible volume than R during the first part (n < 500) of the MD simulation but as the simulation proceeded, the R-enantiomer volume did overtake the S-enantiomer volume and explored a larger accessible volume (n > 500). By the end of the simulation, the R-enantiomer had explored a larger volume of the active site compared to the S-enantiomer.
Fig. 5.

Plots of the accumulated volume of the active site that the tetrahedral intermediate has occupied as a function of the number of structures from time 50 psec, V50–500 psec, in the MD simulation. Structures were sampled every 0.4 psec. Filled symbols include only reactive transition state structures in the calculation V50–500 psecTS. ▵, R-enantiomer; ⋄, S-enantiomer
Fig. 6.

Comparison of the volume occupied ry 3-hexanol as a function of number of sampled structures incluted from 10 psec, V10–500 psec (□), and 50 psec, V50–500 psec (○), respectively in the molecular dynamics simulation. Open symbols represent the R-enantiomer, filled symbols the S-enantiomer. At a point between 10 psec and 50 psec in the MD simulation, the S-enantiomer occupies a volume that it never returns to during the simulation.
Several of the simulations proceeded in a manner yielding a stepwise increase in the substrate accessible volumes. This was most pronounced for (R)-2-butanol (Fig. 7 ▶). After 350 and 750 sampled structures from time 50 psec in the MD simulation, the alcohol portion suddenly accessed new volumes of the active site, resulting in jumps in V50–500 psec.
Fig. 7.

(a) The accumulated volume of the active site occupied by the R-enantiomer of 2-butanol displayed stepwise progress as a function of the number of structures from the MD simulation. (b) Comparison of the positions of the heavy atoms before (upper panel) and just after (lower panel) the first jump in V50–500 psec. For atom connectivity, compare with Fig. 3 ▶.
Systematic searches
Another approach to investigate the volume within the active site accessible for the substrate is systematic search by incremental rotation of bonds (Fig. 8 ▶). The number of allowed conformations, N, produced by the systematic search routine is displayed in Figure 9 ▶. Ten searches were performed for each of the enantiomers of 3-hexanol and five for each of the enantiomers of 2-butanol, 3-methyl-2-butanol, and 3,3-dimethyl-2-butanol. For 3-hexanol, the R-enantiomer gave from all starting conformations more allowed conformations than did the S-enantiomer. However, 2-butanol, 3-methyl-2-butanol, and 3,3-dimethyl-2-butanol did not give equally consistent results but showed for the enantiomers overlapping ranges of N. Increasing the number of increments in the rotations of the systematic search increased the number of allowed structures but did not change their relative positions (data not shown). The substrate accessible volumes found by the systematic searches are listed in Table 3, individually as well as the total volume from all the searches superimposed. The variation in volume between the individual searches was significant, with maximal volume differences between 6 Å3 for (S)-3-methyl-2-butanol and 61 Å3 for (R)-3-hexanol. The total volume of all the individual systematic searches was between 3 and 59 Å3 larger than the largest individual volume for (S)-3,3-dimethyl-2-butanol and (R)-3-hexanol, respectively.
Fig. 8.

Bonds marked `A' were rotated in 30° increments between 0° and 119° and bonds marked `B' in 10° increments between 0° and 359° in systematic search calculations of the substrate accessible volume of the active site of Candida antarctica lipase B.
Fig. 9.

Number of allowed conformations, N, from several systematic searches of the substrate accessible volume for the alcohol part of the substrate in transition state. The systematic searches were done with different starting enzyme–substrate conformations sampled during MD simulations. For 3-hexanol, the starting structures were taken from two separate MD simulations.
Table 3.
Volume (Å3) within the active site explored by the alcohol part of the substrate in systematic searches
| Substrate | ||||||||
| 3-hexanol | 2-butanol | 3-methyl- 2-butanol | 3,3-dimethyl- 2-butanol | |||||
| Search | R | S | R | S | R | S | R | S |
| 1 | 290 | 284 | 138 | 149 | 178 | 170 | 186 | 180 |
| 2 | 282 | 293 | 142 | 164 | 180 | 168 | 199 | 177 |
| 3 | 259 | 274 | 164 | 179 | 181 | 167 | 196 | 174 |
| 4 | 283 | 295 | 147 | 167 | 170 | 173 | 188 | 191 |
| 5 | 298 | 287 | 145 | 156 | 173 | 171 | 206 | 180 |
| 6 | 294 | 279 | ||||||
| 7 | 288 | 271 | ||||||
| 8 | 289 | 306 | ||||||
| 9 | 320 | 274 | ||||||
| 10 | 292 | 298 | ||||||
| Total | 379 | 342 | 174 | 188 | 188 | 185 | 210 | 194 |
| MD (V50–500psec) | 298 | 253 | 182 | 194 | 189 | 173 | 202 | 199 |
The total volume was calculated by superimposing the structures from all individual systematic searches. A comparison with the substrate accessible volume determined with molecular dynamics (MD) simulation (V50–500psec) is shown in the last row.
Discussion
Previous investigations have shown that the differential activation entropy observed in CALB-catalyzed enantioselective transesterification of secondary alcohols is influenced by several factors. Changes in the protein itself (Ottosson et al. 2001), the sec-alcohol (Overbeeke et al. 1999), the acyl chain (Ottosson and Hult 2001), and the solvation of the active site (Ottosson et al. 2002) are factors that have been identified. Differences in activation entropy between enantiomers in enzyme-catalyzed reactions must originate from transition state, as ground state entropy of enantiomers are identical in the nonchiral environment of the bulk solvent. In the molecular modeling part of the present investigation, the contribution of differences in entropy between the enantiomers related to the restriction of the substrates in the enzyme-bound TS was studied. With MD simulations and systematic search calculations, the spatial freedom for the substrate in TS was analyzed and studied for correlations to ΔR−SΔS‡. The lack of parameters describing bromo-atoms in the force field obliged us to exclude this substrate in the modeling part of the present investigation.
Experimental results
The experimental findings obtained in the present study stress the importance of entropy in enzyme catalysis in general and in enantioselectivity in particular, as shown previously (Pham et al. 1989; Phillips 1992; Galunsky et al. 1997; Sakai et al. 1997; Jönsson et al. 1999; Overbeeke et al. 1999; Ottosson and Hult 2001; Ottosson et al. 2001). The five substrates in the present investigation all have entropic terms of differential activation free energy, TΔR−SΔS‡, that are 25% to 60% of the enthalpic term (Table 2). Molecular models that neglect contributions of entropy will thus be incomplete.
The fact that CALB catalyzes transesterifications of halohydrins enantioselectively was shown by Rotticci et al. (1997). They later improved the enantioselectivity of halohydrins with halogens on the large substituent through rational design of the enzyme (Rotticci et al. 2001). This design was based on the two-mode model of CALB catalysis (Orrenius et al. 1998), and was successful although the model only takes differential activation enthalpy, ΔR−SΔH‡, into account, neglecting the contribution by differential activation entropy, ΔR−SΔS‡. Thermodynamic analysis of E for the designed variants showed that the mutations had effects on both ΔR−SΔH‡ and ΔR−SΔS‡ and that conclusions as to the cause of the effects could not be drawn from observed changes in E alone (Ottosson et al. 2001). 1-Bromo-2-butanol has nearly isosteric large- and medium-sized substituents, which give the opportunity to determine whether nonsteric interactions will yield a differential activation entropy, ΔR−SΔS‡. This compound's enantiomers were well resolved by CALB with an E of 100, and ΔR−SΔS‡ was surprisingly large in absolute value (Table 2). Thus the S-enantiomer has a smaller ΔS‡ than does the R-enantiomer or, in other words, pointing the bromo group into the stereospecificity pocket, as S does according to the model, gives a transition state (TS) of higher entropy than when the bromo group points out towards the enzyme surface. Nonsteric interactions can consequently affect both the entropic as well as the enthalpic terms of enantioselectivity. Rotticci et al. (2001) identified interactions between the halogen and protein residues T42 and S47 that constitute parts of the boundaries of the stereospecificity pocket. In contrast to other sec-alcohols, 3-hexanol displayed positive differential activation entropy. Consequently, the preferred R-enantiomer was favored by both enthalpy and entropy, or in other words, the R-enantiomer had a TS of higher entropy compared to the S-enantiomer. A positive differential activation entropy is somewhat counterintuitive, as one generally associates a low activation enthalpy barrier with a low activation entropy barrier. It is also an unusual result. We are aware of very few other observations of this result (Jönsson et al. 1999; Overbeeke et al. 1999, 2000).
Molecular dynamics simulations
A modeled transition state in the active site of the lipase is considered reactive only if an intact hydrogen-bonding network is fulfilled (Orrenius et al. 1998; Berglund et al. 1999). When the stereospecificity pocket harbored only a methyl group, reactive TS structures were easily achieved in MD simulation. The R-enantiomers of 2-butanol, 3-methyl-2-butanol, and 3,3-dimethyl-2-butanol all displayed about 90% reactive TS structures in their MD simulation (Fig. 2 ▶). Larger substituents than methyl were more difficult for the stereospecificity pocket to accommodate. Consequently, both enantiomers of 3-hexanol and the S-enantiomers of the 2-butanol derivatives had fewer reactive TS structures in their MD simulations. Because the starting structures for the MD simulation were made to have an intact hydrogen bonding network, bulkier substrates, which move less in the MD, more frequently kept the network intact. (S)-2-Butanol that was relatively flexible within the active site thus broke the network more frequently than did (S)-3,3-dimethyl-2-butanol, 38% compared to 81% reactive TS.
The volume in the active site occupied by the substrate during an MD simulation should, if the simulation fully explores the conformational space of the system, represent the spatial freedom the substrate has in transition state and should be related to the activation entropy caused by the restriction of substrates. In Table 4, the correlation of the sign of the differential activation entropy of CALB enantioselectivity and which enantiomer occupied the largest volume in the active site in the MD simulations is summarized. The enantiomers of 3-hexanol and 2-butanol with highest TS entropy had the largest V10–500 psec, V50–500 psec, and V50–500 psecTS when we studied the alcohol portion of the substrate. The largest V50–500 psec was found for the enantiomer favored by entropy when we examined the whole substrate of 3-hexanol, 2-butanol, and 3-methyl-2-butanol. In no case did the enantiomer of 3,3-dimethyl-2-butanol with the highest entropy display the largest substrate accessible active site volume. It is possible that other contributions to the differential activation entropy, such as protein or solvation-related contributions, dominated for this substrate. However, it is more likely that insufficient sampling of the conformational space was a major source of error. MD simulations of 500 psec are relatively long simulation times in contemporary modeling of enzyme enantioselectivity (Hwang et al. 2000; Schulz et al. 2000; Raza et al. 2001). Despite this, the volume within the active site that the substrate had occupied, V10–500 psec and V50–500 psec, still increased after such a long simulation time. This means that the simulation still had not fully explored the entire conformational space accessible to the substrate. This could be the reason for the lack of correlation between TS entropy and substrate accessible volume for 3,3-dimethyl-2-butanol. This raises another important question, that is, whether bulkier substrates or substrates with a lower reaction rate, such as 3,3-dimethyl-2-butanol, require longer simulation times than other substrates in order to get a relevant appreciation of their conformational space. The reaction rate of 3,3-dimethyl-2-butanol is several hundred times slower than that of 2-butanol. Does this mean that in order to get a relevant appreciation of the substrate accessible volume within the active site the MD simulation must be correspondingly much longer? It was clear from the structures of 3,3-dimethyl-2-butanol that the tert-butyl group had not been allowed to rotate during the MD simulation, neither for the R- nor for the S-enantiomer. The γ-carbons did not interchange positions. Does this mean that this substrate is so restricted in the active site that it essentially has only one possible TS conformation or that the MD simulation has not yet had time or energy to pass the energy barrier to leave this local minima? The initial docking of the structure and its relevancy thus become very important. The initial docking was sensitive, as observed particularly for 3-hexanol. For this substrate, V50–500 psec never reached the value of V10–500 psec, which indicates that in the first 40 psec after the warm-up phase of the simulation the substrate existed in a conformation that it never returned to during the later 450 psec of the simulation. This substrate may have been docked initially in a conformation that was not very probable.
Table 4.
Correlation of the volume occupied in a 500 psec molecular dynamics computer simulation by the substrate parts to the sign of ΔR–SΔS‡
| 3-hexanol positive ΔR–SΔS‡ | 2-butanol negative ΔR–SΔS‡ | 3-methyl-2-butanol negative ΔR–SΔS‡ | 3,3-dimethyl-2-butanol negative ΔR–SΔS‡ | |||||||||
| al | ac | es | al | ac | es | al | ac | es | al | ac | es | |
| V10–500 psec | Y | N | N | Y | — | Y | N | Y | Y | — | N | N |
| V50–500 psec | Y | — | Y | Y | Y | Y | N | Y | Y | — | N | N |
| V50–500 psecTS | Y | N | Y | Y | N | N | N | Y | Y | N | N | N |
V10–500 psec, accumulated volume occupied by the substrate from time 10 ps in the MD simulation. V50–500 psec, accumulated volume occupied by the substrate from time 50 psec in the MD simulation. V50–500 psecTS, including only reactive TS sample structures from the MD-simulations. al, alcohol part of substrate. ac, acyl part of substrate. es, ester part of substrate. Y, yes. N, no. —, volume difference negligible (≤3 Å3).
Systematic searches
A systematic search by rotation of the bonds in increments is another way of estimating the substrate accessible volumes in the active site. The number of allowed conformations from several such searches for 3-hexanol, 2-butanol, 3-methyl-2-butanol, and 3,3-dimethyl-2-butanol are displayed in Figure 9 ▶. For 3-hexanol, the R-enantiomer was in all cases the one with the largest number of allowed conformations, which is in good agreement with the experimental finding that this enantiomer was favored by entropy over the S-enantiomer in transition state. A larger number of allowed conformations should represent a higher entropy. For the three 2-butanol derivatives, the results did not as clearly favor one enantiomer to have more conformations than the other. However, when overlapping the allowed structures from one systematic search and comparing the volumes of those to the volumes of the overlapped structures from the MD simulation, we noted that the systematic search generally explored a much smaller volume than did the MD simulation. This was most likely due to the fact that in each individual systematic search from a particular starting structure, the enzyme is static and not free to move. Combining all the systematic searches for each substrate and comparing the overall volume should yield a better measure of the substrate accessible volume and its correlation to transition state entropy. The enantiomers preferred by entropy had in fact also the largest accessible volumes calculated by systematic searches for 3-hexanol and 2-butanol. For 3-methyl-2-butanol and 3,3-dimethyl-2-butanol, however, this correlation did not hold. This could possibly be because more systematic searches must be superimposed before a relevant picture of the conformational space can be achieved.
Conclusions
As in several previous studies, we noted the importance of differential activation entropy in enzyme enantioselectivity (Pham et al. 1989; Phillips 1992; Galunsky et al. 1997; Sakai et al. 1997; Jönsson et al. 1999; Overbeeke et al. 1999; Ottosson and Hult 2001; Ottosson et al. 2001). The large contribution of differential activation entropy to enantioselectivity for 1-bromo-2-butanol showed that steric factors alone could not explain the role of entropy in enantioselectivity. Although it is the most common case, the enantiomer that is favored by enthalpy is not necessarily disfavored by entropy, as exemplified in this study by 3-hexanol. The differential activation entropy surely is composed of several components, spatial freedom of the substrate within the active site being one, differences in the degree of freedom for protein residues and solvation between the enantiomers others. With MD simulations and systematic searches, the substrate accessible volume of the active site can be estimated. The component of ΔR−SΔS‡ related to restriction of the substrate upon binding should be related to the substrate accessible volume. The modeled volumes could in several cases predict the correct enantiomer with the higher TS entropy. However, longer dynamics simulations and more systematic searches as well as a larger range of substrates are required to verify the actual predictability of the approach.
Materials and methods
Kinetic resolution of sec-alcohols
Immobilized Candida antarctica lipase B, Novozyme 435 (Novo Nordisk), 5–200 mg, was equilibrated in the reaction vessels to a water activity of 0.11 [LiCl (sat., aq.) ]. Dried (molecular sieves) alcohol (0.43 M) and hexane were added to the reaction vessels and equilibrated in temperature. The reaction was started by the addition of vinyl octanoate (3-hexanol, 2-butanol, 3-methyl-2-butanol, 3,3-dimethyl-2-butanol) or vinyl propionate (1-bromo-2-butanol) (0.43 M). Samples were taken with a syringe at regular intervals for conversions up to 50%. The samples were subsequently analyzed for the enantiomeric excess of the remaining substrate, ees, and of the produced octanoate ester, eep, with chiral capillary GC. Separation of the enantiomers of 3,3-dimethyl-2-butanol, 3-methyl-2-butanol, and their corresponding octanoate esters as well as the separation of the enantiomers of 2-butyl-octanoate, 3-hexyl-octanoate, and 1-bromo-2-butyl-propionate was carried out using a Chirasil-Dex CB column from Chrompack. 2-Butanol was derivatized to the hexanoate ester and 3-hexanol to the propionate ester prior to GC analysis before analysis on the same column. 1-Bromo-2-butanol was derivatized to the trifluoroacetate ester prior to analysis on a Chiraldex γ-PN column (Astec). The enantiomeric ratio, E, was calculated as an average of 3–11, typically 6, samples at conversions 0%–50% from eeS and eeP, assuming irreversibility of the reaction (Rakels et al. 1993).
Molecular modeling computer calculations
The modeling was performed with the SYBYL molecular modeling package 6.7 (Tripos) on SGI Octane UNIX workstations using the Kollman All Atom force field (Weiner et al. 1984, 1986). Preparation of the enzyme structure and the tetrahedral intermediate used as a model of the transition state was as described by Raza et al. (2001). For 3-hexanol, additional water molecules, all originating from the protein surface, were removed as they were expelled from the enzyme structure.
Molecular dynamics simulations
For each of the enantiomers of 3-hexanol, 2-butanol, 3-methyl-2-butanol, and 3,3-dimethyl-2-butanol, a 500 psec-long MD simulation with an NTV ensemble and a 1 fsec time step was run. Each run consisted of a 10 psec-long warm-up phase to 300 K in steps of 2 psec at 50 K intervals. Sample structures were extracted every 1 psec during the warm-up phase and every 0.4 psec after it. For 3-hexanol, an additional 100 psec MD simulation was performed for each enantiomer. The sampled structures were superimposed on each other by fitting the alcohol oxygen (fixed), secondary carbon in the alcohol (weight 100), the carbonyl carbon (weight 1), and the oxyanion (weight 1) of the substrate (Fig. 4 ▶). This superposition was chosen for easy comparison with the systematic search structures (see below). The accessible volumes for the substrates, its acyl part, and its alcohol part (Fig. 4 ▶) were calculated on structures where the atom coordinates for the substrate atoms had been picked out of the sampled structures and combined to one structure file.
Systematic searches
Structures taken at different time steps in the MD simulations were after minimization used in systematic searches. The bonds were rotated in increments (Fig. 7 ▶). The scale factors applied to the van der Waals radius to soften the contacts were 0.8 for general interactions (longer than 1,4), 0.87 for 1,4 interactions and 0.65 for interactions with potential hydrogen bonding. To include as many conformations as possible, a very high value (1,000,000 kcal/mol) was set as the maximal energy difference between an allowed conformer and the lowest energy conformer during the systematic search. The volume in the active site occupied by the allowed conformations was calculated after the alcohol atoms were picked out of the structures and combined to one structure file.
Acknowledgments
This work was supported by the European Union (grant number BIO4-CT95-0231), and the Swedish Natural Science Research Council (NFR). Novo Nordisk (Denmark) kindly provided the enzyme.
The publication costs of this article were defrayed in part by payment of page charges. This article must therefore be hereby marked "advertisement" in accordance with 18 USC section 1734 solely to indicate this fact.
Article and publication are at http://www.proteinscience.org/cgi/doi/10.1110/ps.3480102.
References
- Anderson, E.M., Larsson, K.M., and Kirk, O. 1998. One biocatalyst—many applications: The use of Candida antarctica B-lipase in organic synthesis. Biocatal. Biotransform. 16 181–204. [Google Scholar]
- Berglund, P., Vallikivi, I., Fransson, L., Dannacher, H., Holmquist, M., Martinelle, M., Bjorkling, F., Parve, O., and Hult, K. 1999. Switched enantiopreference of Humicola lipase for 2-phenoxyalkanoic acid ester homologs can be rationalized by different substrate binding modes. Tetrahedron: Asymmetry 10 4191–4202. [Google Scholar]
- Carrea, G. and Riva, S. 2000. Properties and synthetic applications of enzymes in organic solvents. Angew. Chem. Int. Ed. Engl. 39 2226–2254. [PubMed] [Google Scholar]
- Galunsky, B., Ignatova, S., and Kasche, V. 1997. Temperature effects on S1- and S′1-enantioselectivity of α-chymotrypsin. Biochim. Biophys. Acta 1343 130–138. [DOI] [PubMed] [Google Scholar]
- Hwang, B.Y., Scheib, H., Pleiss, J., Kim, B.G., and Schmid, R.D. 2000. Computer-aided molecular modeling of the enantioselectivity of Pseudomonas cepacia lipase toward γ- and δ-lactones. J. Mol. Catal. B: Enzym. 10 223–231. [Google Scholar]
- Jönsson, Å., Wehtje, E., Adlercreutz, P., and Mattiasson, B. 1999. Thermodynamic and kinetic aspects on water vs. organic solvent as reaction media in the enzyme-catalysed reduction of ketones. Biochim. Biophys. Acta 1430 313–322. [DOI] [PubMed] [Google Scholar]
- Kazlauskas, R.J. 2000. Molecular modeling and biocatalysis: Explanations, predictions, limitations, and opportunities. Curr. Opin. Chem. Biol. 4 81–88. [DOI] [PubMed] [Google Scholar]
- Liese, A. and Filho, M.V. 1999. Production of fine chemicals using biocatalysis. Curr. Opin. Biotechnol. 10 595–603. [DOI] [PubMed] [Google Scholar]
- Orrenius, C., Hæffner, F., Rotticci, D., Öhrner, N., Norin, T., and Hult, K. 1998. Chiral recognition of alcohol enantiomers in acyl transfer reactions catalysed by Candida antarctica lipase B. Biocatal. Biotransform. 16 1–15. [Google Scholar]
- Ottosson, J., Fransson, L, King, J.W., and Hult, K. 2002. Size as a parameter for solvent effects on Candida antarctica lipase B enantioselectivity. Biochim. Biophys. Acta. 1594 325–334. [DOI] [PubMed] [Google Scholar]
- Ottosson, J. and Hult, K. 2001. Influence of the acyl chain length on the enantioselectivity of Candida antarctica lipase B and its thermodynamic components in kinetic resolution of sec-alcohols. J. Mol. Catal. B: Enzym. 11 1025–1028. [Google Scholar]
- Ottosson, J., Rotticci-Mulder, J.C., Rotticci, D., and Hult, K. 2001. Rational design of enantioselective enzymes requires considerations of entropy. Protein Sci. 10 1769–1774 [DOI] [PMC free article] [PubMed]
- Overbeeke, P.L.A., Koops, B.C., Verheij, H.M., Slotboom, A.J., Egmond, M.R., Jongejan, J.A., and Heijnen, J.J. 2000. Activity and enantioselectivity of modified lipases in organic solvents. Biocatal. Biotransform. 18 59–77. [Google Scholar]
- Overbeeke, P.L.A., Ottosson, J., Hult, K., Jongejan, J.A., and Duine, J.A. 1999. The temperature dependence of enzymatic kinetic resolutions reveals the relative contribution of enthalpy and entropy to enzymatic enantioselectivity. Biocatal. Biotransform. 17 61–79. [Google Scholar]
- Pham, V.T., Phillips, R.S., and Ljungdahl, L.G. 1989. Temperature-dependent enantiospecificity of secondary alcohol dehydrogenase from Thermoanaerobacter ethanolicus. J. Am. Chem. Soc. 111 1935–1936. [Google Scholar]
- Phillips, R.S. 1992. Temperature effects on stereochemistry of enzymatic reactions. Enzyme Microb. Technol. 14 417–419. [Google Scholar]
- Rakels, J.L.L., Straathof, A.J.J., and Heijnen, J.J. 1993. A simple method to determine the enantiomeric ratio in enantioselective biocatalysis. Enzyme Microb. Technol. 15 1051–1056. [DOI] [PubMed] [Google Scholar]
- Raza, S., Fransson, L., and Hult, K. 2001. Enantioselectivity in Candida antarctica lipase B: A molecular dynamics study. Protein Sci. 10 329–338. [DOI] [PMC free article] [PubMed] [Google Scholar]
- Rotticci, D., Orrenius, C., Hult, K., and Norin, T. 1997. Enantiomerically enriched bifunctional sec-alcohols prepared by Candida antarctica Lipase B catalysis. Evidence of non-steric interactions. Tetrahedron: Asymmetry 8 359–362. [Google Scholar]
- Rotticci, D., Rotticci-Mulder, J.C., Denman, S., Norin, T., and Hult, K. 2001. Improved enantioselectivity of a lipase by rational protein engineering. Chembiochem 2 766–770. [DOI] [PubMed] [Google Scholar]
- Sakai, T., Kawabata, I., Kishimoto, T., Ema, T., and Utaka, M. 1997. Enhancement of the enantioselectivity in lipase-catalyzed kinetic resolutions of 3-phenyl-2H-azirine-2-methanol by lowering the temperature to −40°C. J. Org. Chem. 62 4906–4907. [Google Scholar]
- Schulz, T., Pleiss, J., and Schmid, R.D. 2000. Stereoselectivity of Pseudomonas cepacia lipase toward secondary alcohols: A quantitative model. Protein Sci. 9 1053–1062. [DOI] [PMC free article] [PubMed] [Google Scholar]
- Schulze, B. and Wubbolts, M.G. 1999. Biocatalysis for industrial production of fine chemicals. Curr. Opin. Biotechnol. 10 609–615. [DOI] [PubMed] [Google Scholar]
- Strajbl, M., Sham, Y.Y., Villa, J., Chu, Z.T., and Warshel, A. 2000. Calculations of activation entropies of chemical reactions in solution. J. Phys. Chem. B 104 4578–4584. [Google Scholar]
- Uppenberg, J., Hansen, M.T., Patkar, S., and Jones, T.A. 1994. The sequence, crystal structure determination and refinement of two crystal forms of lipase B from Candida antarctica. Structure 2 293–308. [DOI] [PubMed] [Google Scholar]
- Weiner, S.J., Kollman, P.A., Nguyen, D.T., and Case, D.A. 1986. An all atom force field for simulations of proteins and nucleic acids. J. Comput. Chem. 7 230–252. [DOI] [PubMed] [Google Scholar]
- Weiner, S. J., Kollman, P. A., Case, D. A., Singh, U. C., Ghio, C., Alagona, G., Profeta, S., and Weiner, P. 1984. A new force field for molecular mechanical simulation of nucleic acids and proteins. J. Am. Chem. Soc. 106 765–784. [Google Scholar]
- Villa, J., Strajbl, M., Glennon, T. M., Sham, Y. Y., Chu, Z. T., and Warshel, A. 2000. How important are entropic contributions to enzyme catalysis? Proc. Natl. Acad. Sci. 97 11899–11904. [DOI] [PMC free article] [PubMed] [Google Scholar]