Abstract
Data are reported for Tm, the temperature midpoint of the thermal unfolding curve, of ribonuclease A, versus pH (range 2–9) and salt concentration (range 0–1 M) for two salts, Na2SO4 and NaCl. The results show stabilization by sulfate via anion-specific binding in the concentration range 0–0.1 M and via the Hofmeister effect in the concentration range 0.1–1.0 M. The increase in Tm caused by anion binding at 0.1 M sulfate is 20° at pH 2 but only 1° at pH 9, where the net proton charge on the protein is near 0. The 10° increase in Tm between 0.1 and 1.0 M Na2SO4, caused by the Hofmeister effect, is independent of pH. A striking property of the NaCl results is the absence of any significant stabilization by 0.1 M NaCl, which indicates that any Debye screening is small. pH-dependent stabilization is produced by 1 M NaCl: the increase in Tm between 0 and 1.0 M is 14° at pH 2 but only 1° at pH 9. The 14° increase at pH 2 may result from anion binding or from both binding and Debye screening. Taken together, the results for Na2SO4 and NaCl show that native ribonuclease A is stabilized at low pH in the same manner as molten globule forms of cytochrome c and apomyoglobin, which are stabilized at low pH by low concentrations of sulfate but only by high concentrations of chloride.
Keywords: Anion-specific binding, protein stabilization, net positive charge, ribonuclease A, thermal unfolding, Hofmeister effect
Specific anions induce the formation of molten globule forms from acid-unfolded cytochrome c and apomyoglobin (Goto et al. 1990). When various anions are ranked by their effectiveness in inducing molten globules according to the anion concentration needed, the same anion series is found for both cytochrome c and apomyoglobin. Today, specific anion stabilization of molten globules at low pH is considered to be a characteristic property of molten globules. The question then arises whether specific anion stabilization is a property only of molten globules or applies also to native proteins (see also Makhatadze et al. 1998; Bedell et al. 2000; Sakurai et al. 2001).
The mechanism by which specific anions stabilize molten globules is reduction of the net positive charge on the protein through anion binding. At pH 2, the basic residues (Lys, His, Arg) of molten globules are fully ionized whereas most of the acidic groups (Asp, Glu) are protonated. The resulting net positive charge on the protein is strongly destabilizing, according to unfolding experiments in which the net charge is varied. Goto and Nishikiori (1991) carried out partial acetylation of the lysine amino groups of cytochrome c and separated the partially reacted species by net charge, using electrofocusing. Thermal unfolding experiments on the separated species at pH 1.8 revealed a strong dependence of molten globule stability on net charge. Later work showed a linear relation between unfolding free energy and the square of net charge (Hagihara et al. 1994), as expected for the model in which stability depends to a first approximation on net charge. Site-directed mutagenesis experiments on apomyoglobin, in which individual basic groups were replaced one at a time with alanine, also gave results indicating that molten globule stability depends on net charge (Kay and Baldwin 1998).
To investigate whether native proteins are likewise stabilized by specific anion binding and reduction of net positive charge, we chose ribonuclease A (RNase A), a protein whose unfolding behavior has been studied extensively. It has long been known for good reversibility of unfolding, reduced stability at low pH, and two-state unfolding (native ⇔ denatured) without formation of a molten globule species in the conditions used here (see Harrington and Schellman 1956; Hermans and Scheraga 1961; Ginsburg and Carroll 1965; Brandts and Hunt 1967). There are also many later references. See Torrent et al. (2001) for a recent reference.
Two anions, which differ widely in their effectiveness in stabilizing molten globules at low pH, are studied here: sulfate, which stabilizes molten globules at low salt concentrations, and chloride, which stabilizes them at considerably higher salt concentrations (Goto et al. 1990). The effects of Na2SO4 and NaCl are reported for both thermal and urea-induced unfolding. Thermal unfolding experiments cover a wide range of pH (2–9) and salt concentration (0–1 M). The results are analyzed to determine if the observed stabilization can be separated into anion binding, Debye screening, and Hofmeister effects. Our primary goal is to determine whether anion-specific binding stabilizes a native protein at low pH in the same manner as molten globule forms are stabilized. A quantitative separation of the free energies resulting from different stabilizing effects is not attempted here, although a thermodynamic framework for making such a separation has been provided recently by Courtenay et al. (2001).
Results
Dependence of free energy for urea-induced unfolding on salt concentration
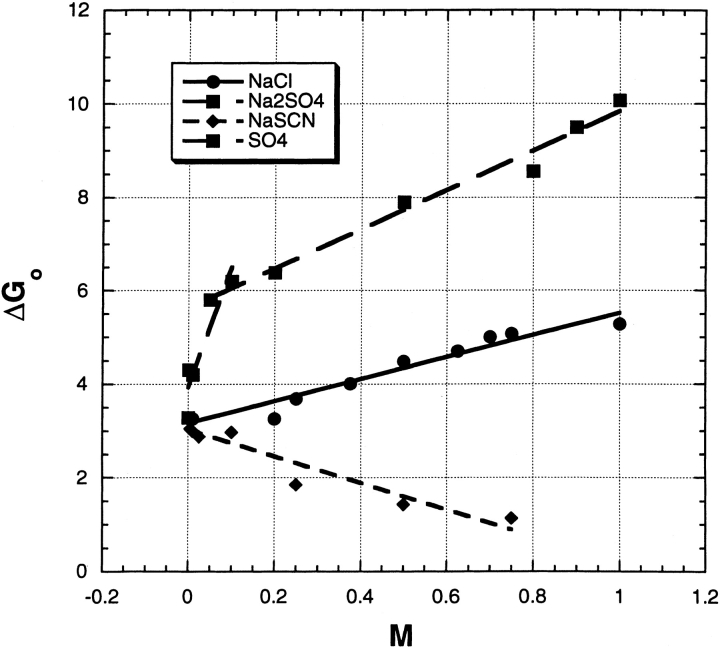
Urea-induced unfolding has been measured versus salt concentration at pH 3.0, 25°C, for three salts: NaCl, Na2SO4, and NaSCN (Fig. 1 ▶; Table 1). First, the unfolding free energy ΔG is measured versus urea molarity at a fixed salt concentration and extrapolated back to 0 M urea to give ΔGo, by using the linear extrapolation method (Greene and Pace 1974; Schellman 1978). Then, this procedure is repeated at a series of salt concentrations and ΔGo is plotted versus [salt]. In Figure 1 ▶, the dependence of ΔGo on [salt] is obviously biphasic for Na2SO4. It rises twofold between 0 and 0.1 M and then increases more slowly between 0.1 and 1.0 M. For NaCl, ΔGo also increases with [salt] but less rapidly. There is no initial abrupt rise, and the results fit a linear curve between 0 and 1.0 M. For NaSCN, ΔGo decreases with increasing [salt].
Fig. 1.
The free energy of urea-induced unfolding of RNase A in kcal/mol, extrapolated to zero urea concentration and plotted against salt molarity. Conditions: pH 3.0, 25°C, 3 mM glycine-HCl. The data are fitted with straight lines, and the sulfate data are fitted to a biphasic curve (hence two SO4 legends).
Table 1.
Anion dependence of the unfolding free energy of RNase A for urea unfolding at pH 3.0, 25°C
| [Salt] | ΔGo | Cm | m |
| (M) | (kcal/mol) | (M) | (kcal/mol/M) |
| No salt added | 3.28 ± 0.08 | 1.48 ± 0.06 | 2.24 ± 0.08 |
| 0.01 NaCl | 3.26 ± 0.22 | 1.43 ± 0.08 | 2.29 ± 0.13 |
| 0.25 NaCl | 3.69 ± 0.20 | 2.00 ± 0.02 | 1.85 ± 0.11 |
| 0.50 NaCl | 4.48 ± 0.23 | 2.49 ± 0.02 | 1.80 ± 0.09 |
| 0.75 NaCl | 5.07 ± 0.14 | 2.91 ± 0.05 | 1.75 ± 0.08 |
| 1.00 NaCl | 5.28 ± 0.23 | 3.21 ± 0.06 | 1.64 ± 0.09 |
| 0.01 Na2SO4 | 4.20 ± 0.31 | 2.55 ± 0.10 | 1.67 ± 0.13 |
| 0.20 Na2SO4 | 6.38 ± 0.30 | 4.21 ± 0.08 | 1.52 ± 0.12 |
| 0.50 Na2SO4 | 7.91 ± 0.23 | 5.28 ± 0.09 | 1.50 ± 0.11 |
| 0.80 Na2SO4 | 8.56 ± 0.20 | 5.81 ± 0.08 | 1.47 ± 0.12 |
| 1.00 Na2SO4 | 10.07 ± 0.51 | 6.43 ± 0.05 | 1.57 ± 0.08 |
| 0.01 NaSCN | 3.05 ± 0.34 | 1.44 ± 0.12 | 2.21 ± 0.16 |
| 0.05 NaSCN | 2.91 ± 0.33 | 1.55 ± 0.11 | 1.87 ± 0.15 |
| 0.25 NaSCN | 1.85 ± 0.25 | 1.50 ± 0.11 | 1.23 ± 0.15 |
| 0.50 NaSCN | 1.43 ± 0.21 | 1.38 ± 0.12 | 1.03 ± 0.15 |
| 0.75 NaSCN | 1.14 ± 0.28 | 1.04 ± 0.10 | 1.10 ± 0.10 |
ΔGo is the unfolding free energy extrapolated to 0 M urea using the linear extrapolation formula ΔG = ΔGo—mM; Cm is the urea molarity (M) at the midpoint of the transition curve where ΔG = 0 and ΔGo = mCm. See Materials and Methods for buffers.
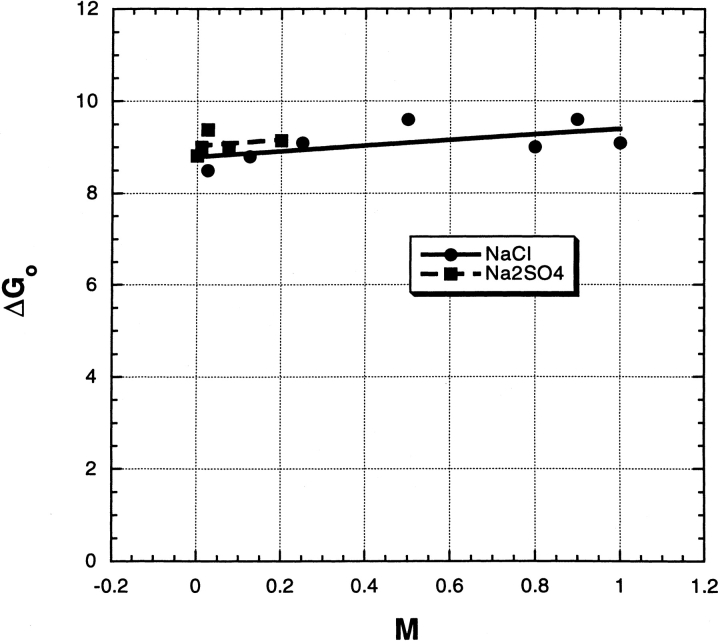
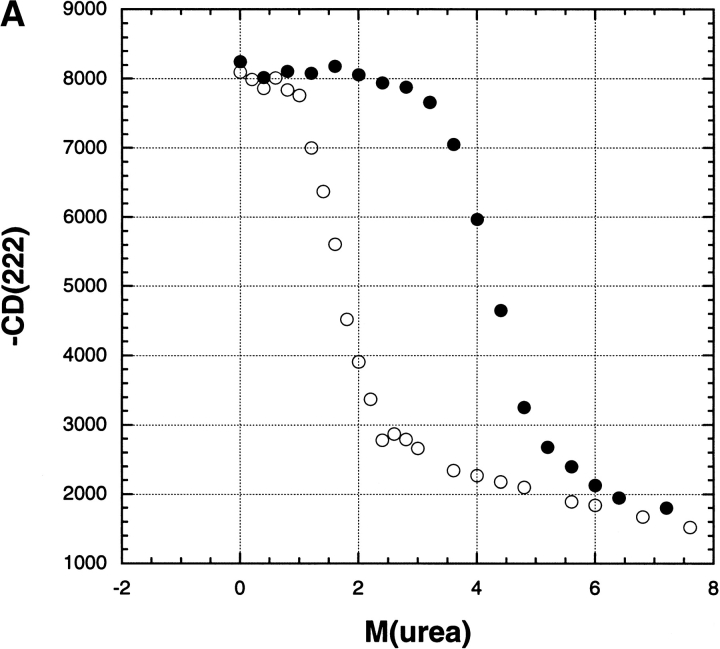
At pH 6, the effect of Na2SO4 on ΔGo (Fig. 2 ▶) is quite different from that at pH 3 because there is no large initial rise in ΔGo between 0 and 0.1 M at pH 6. Also, the values of ΔGo for NaCl and Na2SO4 are similar at low-salt concentrations (0–0.1 M) at pH 6, in sharp contrast to the pH 3 results. For NaCl, the results for ΔGo versus [salt] again fit a linear curve between 0 and 1.0 M at pH 6, but the slope is fourfold lower at pH 6 than at pH 3. Figure 3A ▶ shows examples of the primary data from which the unfolding free energy is computed: transition curves of mean residue ellipticity versus urea molarity in 0 M salt and also in 200 mM Na2SO4.
Fig. 2.
The free energy of urea-induced unfolding of RNase A, in kcal/mol, at pH 6.0, 3 mM MES buffer, plotted against salt molarity. For other details, see legend to Figure 1 ▶.
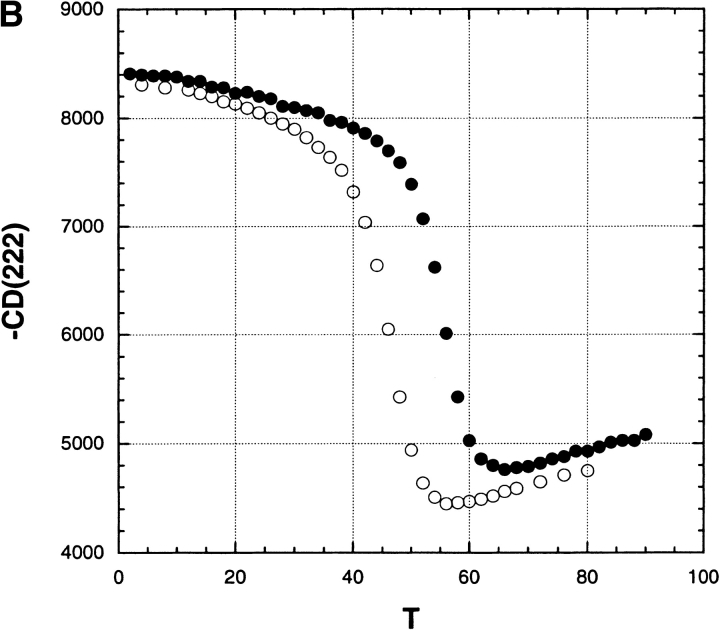
Fig. 3.
(A) Transition curves showing the mean residue ellipticity (222 nm) of RNase A (units are deg cm2/dmol) versus urea molarity at pH 3.0, either in 0 M salt (open circles) or in 200 mM Na2SO4 (filled circles), 25°C, 3 mM glycine-HCl, illustrating primary data from which the free energy of unfolding (ΔGo) was determined. (B) Transition curves showing the mean residue ellipticity (222 nm) of RNase A (units are the same as panel A) versus temperature either in 0 M salt (open circles) or in 10 mM Na2SO4 (filled circles), pH 3.0, illustrating primary data from which the thermal transition temperature (Tm) was determined.
At pH 3, there is a strong dependence on [salt] (Table 1) of the parameter m, which is the slope of the plot of ΔG versus [urea] in the linear extrapolation method. Using a simple model for denaturant-induced unfolding predicts that m should be a constant when an environmental variable such as pH or [salt] is varied. In this model, m is proportional to the number of sites buried upon folding that are available in the unfolded protein for interaction with the denaturant (Schellman 1978). Because the number of buried sites should be independent of salt concentration and pH, any dependence of ΔGo on these variables should be expressed through their dependence of Cm, the molar concentration of urea at the transition midpoint (ΔGo = mCm). Pace and coworkers found, however, that the m-value for urea unfolding of RNase A roughly doubles from pH 9 to pH 3, as the net proton charge increases from 1.5 to 14 (Pace et al. 1990), and both m and Cm change with pH, in contrast to the predictions of the simple model.
On the other hand, Pace et al. (1990) found that the m-value for GdmCl unfolding of RNase A changes only slightly with pH between pH 9 and pH 3, and they suggested that the reason for the difference between the urea and GdmCl results is that GdmCl is a salt, able to screen charge-charge interactions, which affect the m-value. Whitten et al. (2001) suggested that the pH-dependent changes in m-value arise from a folding intermediate, which becomes populated at low pH, but this hypothesis does not explain why the changes in m-value are seen with urea unfolding but not with GdmCl-induced unfolding of RNase A.
Table 1 shows how the m-value for urea unfolding depends on [salt] at pH 3.0. The three salts affect the m-value quite differently. The m-value for Na2SO4 drops abruptly between 0 and 0.01 M and then levels off at higher [salt], the m-value for NaCl drops significantly between 0 and 0.25 M and then decreases slowly with [salt], whereas the m-value for NaSCN drops substantially between 0 and 0.5 M. The m-values of the three salts are quite different from one another at 0.5 M [salt]. The trend of the NaCl results agrees well with the results of Yao and Bolen (1995), who made similar measurements, but in the presence of 0.1 M β-alanine buffer.
Dependence of Tm on pH at various salt concentrations
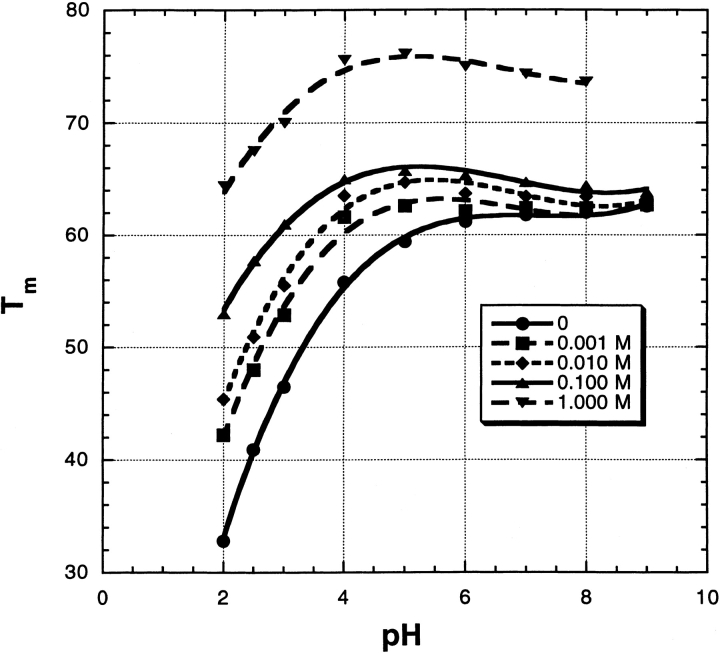
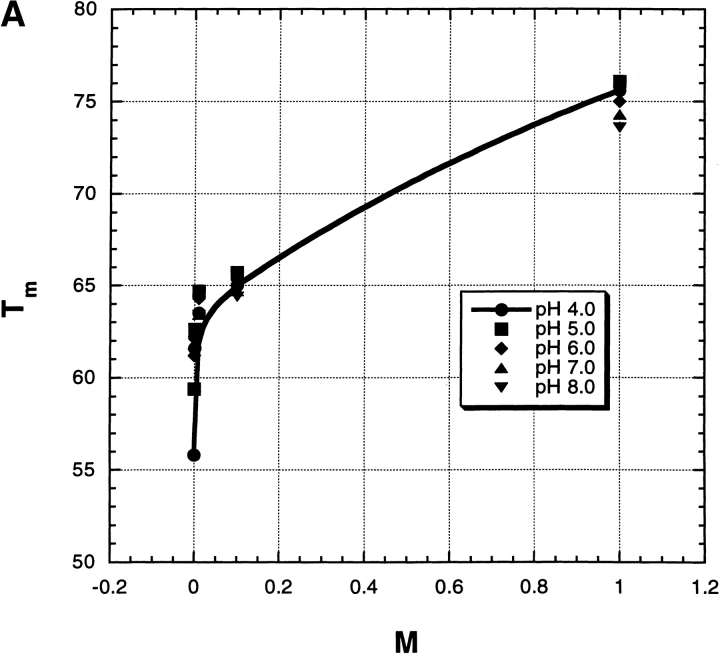
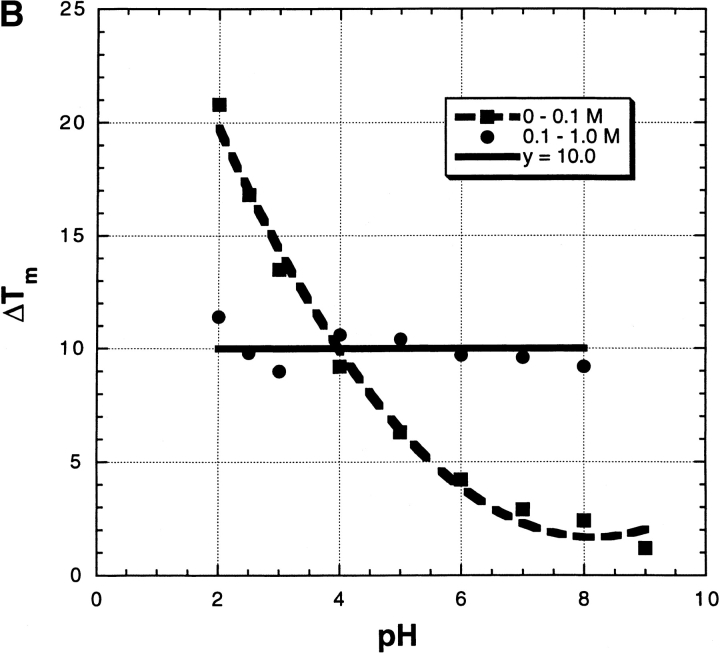
Figure 3B ▶ gives examples of thermal unfolding curves (mean residue ellipticity of RNase A) versus temperature in 0 M salt and also in 10 mM Na2SO4; the transition temperature Tm is taken from the midpoint of the curve. Note the striking stabilizing effect of 10 mM Na2SO4. Figure 4 ▶ shows the dependence of Tm on [Na2SO4] over the pH range 2–9 and for varying salt concentrations from 0 to 1.0 M. Several interesting features are evident. (1) At low pH, where the net charge becomes large and Tm becomes strongly dependent on pH, Tm also becomes strongly dependent on [salt]. (2) The dependence of Tm on [Na2SO4] is very strong at low pH and low salt concentrations; even 1 mM salt produces a 9° increase in Tm at pH 2. (3) The [Na2SO4] dependence is biphasic over the whole pH range (see Fig. 5A ▶). There is an abrupt rise in Tm between 0 and 0.1 M Na2SO4, whose size is only 1° at pH 9 but 20° at pH 2 (Fig. 5B ▶). A second rise in Tm occurs between 0.1 and 1.0 M, which is linear in M and whose size is 10°, independent of pH (Fig. 5B ▶).
Fig. 4.
The transition temperature, in °C, measured by circular dichroism, for thermal unfolding of RNase A at a series of pH values and Na2SO4 molarities. For buffers, see Materials and Methods.
Fig. 5.
(A) The Tm values from Figure 4 ▶ plotted against Na2SO4 molarity at a series of pH values, to illustrate the biphasic nature of these curves. (B) From the experiments shown in Figure 4 ▶, the changes in Tm between 0 and 0.1 M Na2SO4, and also between 0.1 and 1.0 M, are plotted against pH. The horizontal line (y = 10.0) represents the average value of the change in Tm between 0.1 and 1.0 M.
Figure 6 ▶ shows the dependence of Tm on pH for NaCl. In striking contrast to the Na2SO4 results, 0.1 M NaCl has little effect on Tm at any pH, even at pH 2, where Tm at 0 M [salt] has decreased 30° from the value at pH 9. Addition of 1 M NaCl raises Tm 14° at pH 2, although 1 M NaCl raises Tm only 1° at pH 9.
Fig. 6.
The transition temperature, in °C, for thermal unfolding of RNase A, measured by circular dichroism, at a series of pH values and NaCl molarities. For buffers, see Materials and Methods.
Note that, as expected, the effects of Na2SO4 and NaCl on RNase A stability are similar in character whether measured by urea unfolding or by thermal unfolding. This is true both at pH 3.0 and pH 6.0 (compare Figs. 1 and 2 ▶ ▶ with Figs. 4 and 6 ▶ ▶).
Discussion
Mechanisms for stabilizing proteins by salt
Hofmeister effect
Perhaps the earliest recognized mechanism of stabilizing proteins by salt is that of Hofmeister (1888), who studied the precipitation by various salts of proteins from whole egg white. He found the regular series of anions and cations that bears his name. Agents that affect protein solubility are expected also to affect stability, and von Hippel and Wong (1965) demonstrated that salts do affect the Tm of RNase A at pH 7 with the rank order given by the Hofmeister series. They also found that the Hofmeister series applies to stabilization by salts of the DNA helix and the collagen helix (von Hippel and Wong 1964). Moreover, the same Hofmeister series is found in studies of salting-out benzene from aqueous solution (McDevit and Long 1952).
Surprisingly, the same Hofmeister series gives the rank order of effectiveness of anions, which salt in the peptide group in glycyl peptides (Nandi and Robinson 1972a) as those which salt out amino-acid residues with nonpolar side chains (Nandi and Robinson 1972b). Thus, Hofmeister anions interact favorably with the peptide group whereas they interact unfavorably with nonpolar side chains. von Hippel and coworkers have suggested that the favorable ion-peptide interactions are nonspecific and do not represent a second class of Hofmeister ion interactions, but rather that the apparent Hofmeister character of these interactions arises from the unfavorable Hofmeister ion interactions with the -CH2 group in the glycyl peptide backbone (Hamabata and von Hippel 1973). For a different interpretation, see Baldwin (1996). Important studies of the mechanism of action of Hofmeister salts have been made by Hamabata and von Hippel (1973), Arakawa and Timasheff (1982), and Collins and Washabaugh (1985), and model compound studies of Hofmeister ions have been reviewed by Baldwin (1996).
For understanding our present results, there are two important points from the model compound studies. (1) Both unfavorable interaction between a Hofmeister ion and a nonpolar compound and the favorable interaction between a Hofmeister ion and the peptide group have transfer-free energies that are proportional to salt molarity up to the highest molarities studied (see Baldwin 1996). Consequently, Hofmeister interactions can be measured at high salt concentrations where other interactions have reached saturating values. Note that, when Tm is measured versus salt molarity, linearity of Tm versus M is not expected over a wide temperature range because both ΔH and ΔS are strongly temperature dependent. (2) Because of their opposite interactions with nonpolar side chains and with the peptide group, Hofmeister ions can be either protein denaturants or stabilizers.
Debye screening
The name is given because of the close analogy between this mechanism and the screening mechanism outlined in the Debye-Hückel theory by which an added electrolyte affects the activity coefficient of an ion. The theory for activity coefficients has been tested extensively and is widely quoted, for example, in textbooks of physical chemistry. According to the screening mechanism, any electrostatic interaction in aqueous solution, favorable or unfavorable, may be screened by mobile ions. Consequently, according to this mechanism, it should be possible for mobile ions to screen both the favorable interactions between oppositely charged groups in proteins and the repulsive interactions between groups of like sign. Note, however, the recent criticisms by da Silva et al. (2001) of applying a Debye-Hückel screening mechanism to charge interactions in proteins without detailed justification.
For understanding the results presented here, there are two basic properties of the screening mechanism as contrasted with the Hofmeister and anion-binding mechanisms. (1) Debye screening is comparatively nonspecific. According to the Debye-Hückel theory for the effect of added salt on the activity coefficients of simple ions, the screening effect of a dilute electrolyte depends only on its contribution to the ionic strength, which depends in turn on the salt concentration and on the square of the valence of each ion. (At a given molar concentration, the ionic strength of a Na2SO4 solution is three times larger than that of a NaCl solution.) (2) Screening by mobile ions should reduce the strengths of both classes of charge-charge interactions in proteins, favorable and unfavorable, whereas anion binding should reduce the strength only of the unfavorable interactions among positively charged groups.
Anion binding and reduction of net positive charge
Stabilization of molten globule forms by specific anion binding is well known and the evidence for this mechanism is outlined in the Introduction. The initial motivation for our study was to find out if stabilization by specific anion binding occurs also with a native protein such as RNase A. The underlying question is if molten globules have some special structural feature different from native proteins that enables them to be stabilized by binding specific anions, and the answer appears to be no.
There is, in fact, good evidence in the older literature for specific anion binding at low pH to one native protein, human serum albumin (Scatchard et al. 1957 and references therein). Scatchard's work on ligand binding to proteins is remembered today chiefly for the Scatchard plot (Scatchard 1949), which is applied especially to measuring specific ligand-protein interactions, such as binding allosteric effectors and inhibitors. Scatchard devised his plot, however, to study anion binding by serum albumin, which was readily available in crystalline form and had been studied extensively during World War II as a possible extender of blood plasma. Scatchard and coworkers studied monoanions. The anions, which they found to be bound strongly by serum albumin, such as trichloroacetate and perchlorate, turned out in later work to be anions that stabilize molten globule forms at low [salt] concentrations (Goto et al. 1990).
Stabilization of RNase A by Na2SO4 and NaCl
The evidence that Na2SO4 stabilizes RNase A by at least two distinct mechanisms is summarized in Figures 4 and 5 ▶ ▶. The two mechanisms can be separated because the first mechanism reaches saturation between 0 and 0.1 M [sulfate], while the second one can be measured between 0.1 and 1.0 M. The first mechanism is reduction of the net positive charge on RNase A by specific anion binding, according to the following evidence and arguments. This mechanism, which goes to completion between 0 and 0.1 M Na2SO4, causes a large increase in stability at pH 2, where the net proton charge is +17.5, but only a small increase at pH 9, where the net proton charge is 1.5 (Pace et al. 1990). Stabilization of RNase A by the first mechanism, which is strongly pH-dependent and reaches saturation at a low-salt concentration (0.1 M in the case of sulfate), is not a general property shown by all salts because no corresponding stabilization is observed with NaCl. Thus, stabilization of RNase A by [sulfate] between 0 and 0.1 M is a specific property of the sulfate anion and does not result from the Debye screening mechanism, which is a general mechanism applicable to all salts.
Native RNase A binds oligonucleotides at several subsites, chiefly by binding phosphate groups (McPherson et al. 1986), and these subsites may well be sulfate-binding sites. Nevertheless, the pH dependence of the sulfate stabilization of RNase A between 0 and 0.1 M shows clearly that stabilization depends on reducing the net proton charge. There is little stabilization by sulfate at pH 9, where the net proton charge of RNase A is near zero.
The classic paper by Ginsburg and Carroll (1965) is remembered today chiefly for its demonstration of two-state unfolding by a then novel criterion: probes with different structural correlates yield superimposable unfolding transition curves if there are no populated folding intermediates. The stated aim of the paper is, however, to demonstrate that RNase A is specifically stabilized against thermal unfolding by sulfate ion. Ahmad and Bigelow (1986) noted that RNase A is stabilized by phosphate>sulfate>acetate, at pH 7.0, 25°C, and that myoglobin, hen lysozyme, and pepsinogen are likewise stabilized by these anions in the same order. Other workers have noted recently that native proteins may be stabilized at low pH by specific anions, in a similar manner as molten globules. The small protein Sac7d is induced to fold at acid pH by various anions and the folded product is the native protein (Bedell et al. 2000), not the molten globule form as supposed initially. Native ubiquitin is stabilized at pH 2.0 by various anions in a manner that suggests anion binding is responsible (Makhatadze et al. 1998). Various salts, including GdmCl, stabilize the native dimer of β-lactoglobulin at acid pH, apparently by specific anion binding (Sakurai et al. 2001).
The second mechanism by which sulfate stabilizes RNase A is the Hofmeister effect. It causes the increase in Tm between 0.1 and 1.0 M [salt] (Figs. 5A,B), which is independent of pH (Fig. 5B ▶). It also causes the increase in free energy of urea unfolding between 0.1 and 1.0 M Na2SO4 at pH 3 (Fig. 1A ▶). The urea unfolding results for ΔGo versus [Na2SO4], [NaCl] and NaSCN display two typical properties of interactions between Hofmeister ions and proteins. First, free energy depends linearly on [salt] above a threshold salt concentration. Second, sulfate is a good protein stabilizer, chloride is almost neutral, and thiocyanate is a denaturant, as observed earlier (von Hippel and Wong 1965). From model compound studies, sulfate acting as a Hofmeister anion is expected to be an effective protein stabilizer because sulfate strongly salts out nonpolar compounds (Nandi and Robinson 1972b; Arakawa and Timasheff 1986; Baldwin 1996) and only weakly salts in the peptide group (Nandi and Robinson 1972a).
An alternative explanation for the second mechanism, other than the Hofmeister effect, by which sulfate stabilizes RNase A above 0.1 M Na2SO4, is weak sulfate binding that saturates only at a high salt concentration, above 1 M. Weak sulfate binding would be expected to change the net charge on RNase A and consequently weak binding might be expected to produce a pH-dependent change in RNase A stability, whereas the observed change is pH-independent (Fig. 5B ▶). As pointed out above, the Hofmeister effect is a plausible explanation because model compound data show that sulfate strongly salts out nonpolar compounds, as expected for a good protein stabilizer, and also sulfate interacts only weakly with the peptide bond, likewise as expected for a good protein stabilizer.
The stabilizing effects of NaCl on RNase A are considerably more difficult to characterize and may represent a mixture of three effects: anion binding, Debye screening, and the Hofmeister effect. The increase in Tm between 0 and 1.0 M NaCl changes from 14° at pH 2 to only 1° at pH 9. This behavior indicates stabilization by reduction of net proton charge, via either anion binding or Debye screening, or both. The change in Tm between 0.1 and 1.0 M [salt] at pH 9, where the net proton charge is nearly 0, is only 1°, which indicates that the Hofmeister effect for NaCl is quite small.
Conclusions
The results presented here indicate that stabilization of molten globules at low pH by binding specific anions, such as sulfate, is not a special property of molten globules but rather applies also to native proteins. Specific anion binding should be kept in mind as an important mechanism of influencing the net charge on a native protein at low pH. Prediction of the net charge on a protein at low pH only from the pK values of its proton-binding groups may be quite unrealistic. We do not observe stabilization of RNase A by 0.1 M NaCl at low pH, which we expected from Debye screening. For an example of the predicted effect of Debye screening on the electrostatic free energy of RNase S, see Matthew and Richards (1982), who used a modified Tanford-Kirkwood model. Our result may suggest, in agreement with recent simulations by da Silva et al. (2001), that the Debye screening behavior observed with proteins has quite different properties than those observed with simple ions.
Materials and methods
Materials
RNase A type XII-A was obtained from Sigma and used without further purification. The protein concentration was calculated spectrophotometrically using an extinction coefficient at 278 nm of 9800 cm−1 M−1 (Sela and Anfinsen 1957). Buffers for measuring RNase A stability are: 3 mM glycine-HCl for pH 2.0 to 3.0; 2 mM sodium-acetate for pH 4.0 to 5.0; 3 mM MES for pH 6.0; 2 mM MOPS for pH 7.0; 2 mM Tris-HCl for pH 8.0; and 3 mM glycine-NaOH for pH 9.0. Urea solutions were prepared freshly and their concentrations determined by refractive index (Pace 1986). All chemicals were analytical grade. All solutions were filtered after preparation and their pH values were checked before and after filtration. The term "0 M salt" refers to added Na2SO4 or NaCl and does not include the buffer, which is always present.
Circular dichroism and absorbance measurements
Circular dichroism (CD) measurements were made using either an AVIV 62ADS or a Jasco J-810 spectropolarimeter. The CD signal at 222 nm was averaged for 5 min. Absorbance measurements were made using a Beckman DU640 spectrophotometer. The absorbance at 287 nm was averaged for 5 min. All measurements were made using 1-cm cells. The RNase A concentration was 6 μM for CD experiments and 37 μM for absorbance experiments.
Thermal and urea unfolding curves
Thermal unfolding was recorded at 2°C intervals from 0 to 90°C with 3 min equilibration before taking measurements. Reversibility was tested by recording the cooling curve at 15°C intervals from 90 to 0°C with 8 min equilibration before taking measurements. The pH of each sample was checked after thermal unfolding. The conditions for urea-induced unfolding were 3 mM Glycine-HCl, pH 3.0, or 3 mM MES, pH 6.0, at 25°C. After diluting the RNase A sample into a urea solution, 20 min was allowed before taking CD or absorbance measurements for the reaction to reach equilibrium. Both thermal and urea-induced unfolding of RNAse A are reversible in the conditions studied here.
Urea-induced unfolding curves were fitted to a two-state equation as described by Santoro and Bolen (1988) to calculate the thermodynamic parameters ΔG, Cm and m. The unfolding free energy ΔG is assumed to be a linear function of urea molarity with ΔG = ΔGo−mM. The Tm is calculated from the first derivative of the curve of CD versus temperature. The values of these parameters and their standard deviations are the average of at least three unfolding experiments. Curve fittings were made using KaleidaGraph software program (Abelbeck Software) and Origin (Microcal Software).
Acknowledgments
This work was supported by NIH grant GM 19988. C.H.I.R. is a PEW Latin American Fellow (P0195SC) and is supported by Fundação de Amparo à Pesquisa do Estado de São Paulo FAPESP (96/06919–9; 98/12978–3; 99/07574–3) and MCT/CNPq. We thank Marc Jamin and Doug Laurents for helpful discussion and Veruska Soares for technical assistance.
The publication costs of this article were defrayed in part by payment of page charges. This article must therefore be hereby marked "advertisement" in accordance with 18 USC section 1734 solely to indicate this fact.
Abbreviations
Tm, temperature midpoint of thermal unfolding curve
ΔG, unfolding free energy
ΔGo, ΔG at zero urea molarity
m, slope of curve of ΔG versus urea molarity
Cm, urea molarity at midpoint of unfolding transition
GdmCl, guanidinium chloride
MES, 4-morpholinoethane sulfonic acid
MOPS, 3—(N-morpholino)propanesulfonic acid
TRIS, Tris(hydroxymethyl)aminomethane
Article and publication are at http://www.proteinscience.org/cgi/doi/10.1110/ps.0205902.
References
- Ahmad, F. and Bigelow, C.C. 1986. Thermodynamic stability of proteins in salt solutions: A comparison of the effectiveness of protein stabilizers. J. Prot. Chem. 5355–367. [Google Scholar]
- Arakawa, T. and Timasheff, S.N. 1982. Preferential interactions of proteins with salts in concentrated solutions. Biochemistry 216545–6552. [DOI] [PubMed] [Google Scholar]
- Baldwin, R.L. 1996. How Hofmeister ion interactions affect protein stability. Biophys. J. 712056–2063. [DOI] [PMC free article] [PubMed] [Google Scholar]
- Bedell, J.L., McCrary, B.S., Edmondson, S.P., and Shriver, J.W. 2000. The acid-induced folded state of Sac7d is the native state. Protein Sci. 91878–1888. [DOI] [PMC free article] [PubMed] [Google Scholar]
- Brandts, J.F. and Hunt, L. 1967. The thermodynamics of protein denaturation. III. The denaturation of ribonuclease in water and in aqueous urea and aqueous ethanol mixtures. J. Am. Chem. Soc. 894826–4838. [DOI] [PubMed] [Google Scholar]
- Collins, K.D. and Washabaugh, M.W. 1985. The Hofmeister effect and the behavior of water at interfaces. Q. Rev. Biophys. 18323–422. [DOI] [PubMed] [Google Scholar]
- Courtenay, E., Capp, M.W., and Record, M.T. Jr. 2001. Thermodynamics of interactions of urea and guanidinium salts with protein surface: Relationships between solute effects on protein processes and changes in water-accessible surface area. Protein Sci. 10 2485–2497. [DOI] [PMC free article] [PubMed] [Google Scholar]
- da Silva, F.L.B., Jönsson, B., and Penfold, R. 2001. A critical investigation of the Tanford-Kirkwood scheme by means of Monte Carlo simulations. Protein Sci. 101415–1425. [DOI] [PMC free article] [PubMed] [Google Scholar]
- Ginsburg, A. and Carroll, W.R. 1965. Some specific ion effects on the conformation and thermal stability of ribonuclease. Biochemistry 42159–2174. [Google Scholar]
- Goto, Y., Calciano, L.J., and Fink, A.L. 1990. Acid-induced folding of globular proteins. Proc. Natl. Acad. Sci. 87573–577. [DOI] [PMC free article] [PubMed] [Google Scholar]
- Goto, Y. and Nishikiori, S. 1991. Role of electrostatic repulsion in the acidic molten globule of cytochrome c. J. Mol. Biol. 222679–686. [DOI] [PubMed] [Google Scholar]
- Greene, R.F. Jr., and Pace, C.N. 1974. Urea and guanidine hydrochloride denaturation of ribonuclease, lysozyme, α-chymotrypsin and β-lactoglobulin. J. Biol. Chem. 2495388–5393. [PubMed] [Google Scholar]
- Grimsley, G.R., Shaw, K.L., Fee, L.R., Alston, R.W., Huyghues-Despointes, B.M., Thurlkill, R.L., Scholtz, J.M., and Pace, C.N. 1999. Increasing protein stability by altering long-range coulombic interactions. Protein Sci. 91843–1849. [DOI] [PMC free article] [PubMed] [Google Scholar]
- Hagihara, Y., Tan, Y., and Goto, Y. 1994. Comparison of the conformational stability of the molten globule and native states of horse cytochrome c. Effects of acetylation, heat, urea and guanidine-hydrochloride. J. Mol. Biol. 237336–348. [DOI] [PubMed] [Google Scholar]
- Hamabata, A. and von Hippel, P.H. 1973. Model studies on the effects of neutral salts on the conformational stability of biological macromolecules. II. Effects of vicinal hydrophobic groups on the specificity of binding ions to amide groups. Biochemistry 121264–1271. [DOI] [PubMed] [Google Scholar]
- Harrington, W.F. and Schellman, J.A. 1956. Evidence for the instability of hydrogen-bonded peptide structures in water based on studies of ribonuclease and oxidized ribonuclease. C.R. Trav. Lab. Carlsberg, Ser. Chim. 3021–43. [PubMed] [Google Scholar]
- Hermans, J. and Scheraga, H.A. 1961. Structural studies of ribonuclease. V. Reversible change of configuration. J. Amer. Chem. Soc. 833283–3292. [Google Scholar]
- Hofmeister, F. 1888. Zur Lehre von der Wirkung der Salze. Zweite Mittheilung. Arch. Exp. Pathol. Pharmakol. 24247–260. [Google Scholar]
- Kay, M.S. and Baldwin, R.L. 1998. Alternative models for describing the acid unfolding of the apomyoglobin folding intermediate. Biochemistry 377859–7868. [DOI] [PubMed] [Google Scholar]
- Makhatadze, G.I., Lopez, M.M., Richardson III, J.M., and Thomas, S.T. 1998. Anion binding to the ubiquitin molecule. Protein Sci. 7689–697. [DOI] [PMC free article] [PubMed] [Google Scholar]
- Matthew, J.B. and Richards, F.M. 1982. Anion binding and pH-dependent electrostatic effects in ribonuclease. Biochemistry 214989–4999. [DOI] [PubMed] [Google Scholar]
- McDevit, W.F. and Long, F.A. 1952. The activity coefficient of benzene in aqueous salt solutions. J. Am. Chem. Soc. 741773–1777. [Google Scholar]
- McPherson, A., Brayer, G., Cascio, D., and Williams, R. 1986. The mechanism of binding of a polynucleotide chain to pancreatic ribonuclease. Science 232767–768. [DOI] [PubMed] [Google Scholar]
- Nandi, P.K. and Robinson, D.R. 1972a. The effects of salts on the free energy of the peptide group. J. Am. Chem. Soc. 941299–1308. [DOI] [PubMed] [Google Scholar]
- ——1972b. The effects of salts on the free energies of nonpolar groups in model peptides. J. Am. Chem. Soc. 941308–1315. [DOI] [PubMed] [Google Scholar]
- Pace, C.N. 1986. Determination and analysis of urea and guanidine hydrochloride denaturation curves. Methods Enzymol. 131266–280. [DOI] [PubMed] [Google Scholar]
- Pace, C.N., Laurents, D.V., and Thomson, J.A. 1990. pH dependence of the urea and guanidine hydrochloride denaturation of ribonuclease A and ribonuclease T1. Biochemistry 292564–2572. [DOI] [PubMed] [Google Scholar]
- Sakurai, K., Oobatake, M., and Goto, Y. 2001. Salt-dependent monomer-dimer equilibrium of bovine β-lactoglobulin at pH 3. Protein Sci. 102325–2335. [DOI] [PMC free article] [PubMed] [Google Scholar]
- Santoro, M.M., and Bolen, D.W. 1988. Unfolding free energy changes determined by the linear extrapolation method. 1. Unfolding of phenylmethanesulfonyl α-chymotrypsin using different denaturants. Biochemistry 278063–8068. [DOI] [PubMed] [Google Scholar]
- Scatchard, G. 1949. The attractions of proteins for small molecules and ions. Ann. N.Y. Acad. Sci. 51660–672. [Google Scholar]
- Scatchard, G., Coleman, J.S. and Shen, A.L. 1957. Physical chemistry of protein solutions. VII. The binding of some small anions to serum albumin. J. Am. Chem. Soc. 7912–20. [Google Scholar]
- Schellman, J.A. 1978. Solvent denaturation. Biopolymers 171305–1322. [DOI] [PubMed] [Google Scholar]
- Sela, M. and Anfinsen, C.F. 1957. Some spectrophotometric and polarimetric experiments with ribonuclease. Biochim. Biophys. Acta 24229–235. [DOI] [PubMed] [Google Scholar]
- Torrent, J., Rubens, P., Ribo, M., Heremans, K., and Vilanova, M. 2001. Pressure versus temperature unfolding of ribonuclease A: An FTIR spectroscopic characterization of 10 variants at the carboxy-terminal site. Protein Sci. 10725–734. [DOI] [PMC free article] [PubMed] [Google Scholar]
- von Hippel, P.H. and Wong, K.Y. 1964. Neutral salts: The generality of their effects on the stability of macromolecular conformations. Science 145577–580. [DOI] [PubMed] [Google Scholar]
- ——1965. On the conformational stability of globular proteins. The effects of various electrolytes and nonelectrolytes on the thermal ribonuclease transition. J. Biol. Chem. 2403909–3923. [PubMed] [Google Scholar]
- Whitten, S.T., Wooll, J.O., Razeghifard, R., Garcia-Moreno, B.E., and Hilser, V.J. 2001. The origin of pH-dependent changes in m-values for the denaturant-induced unfolding of proteins. J. Mol. Biol. 3091165–1175. [DOI] [PubMed] [Google Scholar]
- Yao, M. and Bolen, D.W. 1995. How valid are denaturant-induced unfolding free energy measurements? Level of conformance to common assumptions over an extended range of ribonuclease A stability. Biochemistry 343771–3781. [DOI] [PubMed] [Google Scholar]


