

Abstract
Existing models of the denatured state of proteins consider only one possible spatial distribution of protein charges and therefore are applicable to a limited number of cases. In this article, a more general framework for the modeling of the denatured state is proposed. It is based on the assumption that the titratable groups of an unfolded protein can adopt a quasi-random distribution restricted by the protein sequence. The model was applied for the calculations of electrostatic interactions in two proteins, barnase and N-terminal domain of the ribosomal protein L9. The calculated free energy of denaturation, ΔG(pH), reproduces the experimental data better than the commonly used null approximation (NA). It was shown that the seemingly good agreement with experimental data obtained by NA originates from the compensatory effect between the pairwise electrostatic interactions and the desolvation energy of the individual sites. It was also found that the ionization properties of denatured proteins are influenced by the protein sequence.
Keywords: Electrostatic interactions, denatured state, proteins, pH-dependence, free energy
The stability of proteins at given conditions is determined by the difference in the Gibbs free energies, ΔG, between folded and unfolded conformations of a molecule. The theoretical prediction of ΔG and its components is a prerequisite for the correct understanding of various functional properties of proteins. Such a component, for instance, is electrostatic interactions. The electrostatic term of ΔG can be deduced from the pH-dependence of the denaturation energy, in which electrostatic interactions are a predominant factor (Tanford 1968):
 |
(1) |
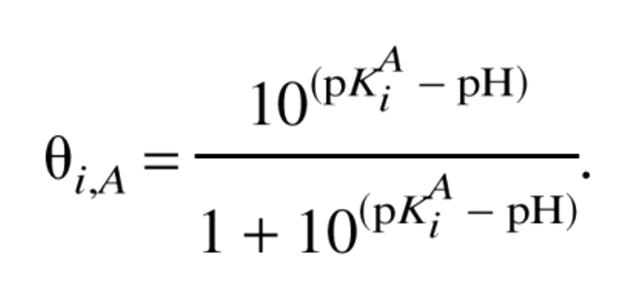
The indexes D and N stand for denatured and native protein, respectively, β = (RT)−1, R is the gas constant, T is the temperature, and ΔG0 is the free energy at pH0, which is chosen so that ΔG0 does not depend on pH. This is fulfilled, for instance, at extremely low pH values in which there is no difference in charge between the native and denatured states (QN = QD). The net charge QA (A is either D or N), in turn, can be obtained from the degree of protonation, θi,A, of the individual titratable sites using the Henderson–Hasselbalch equation:
 |
(2) |
It should be noted that equation 2 is not valid for strong electrostatic interactions between titratable sites. The conditions for non-Henderson-Hasselbalch ionization behavior were described in our previous work (Koumanov et al. 2002). In general, θi,A can be determined on the basis of statistical mechanical considerations, such as equation 4 given in the Materials and Methods section.
Efforts toward prediction of the pKiA values are mainly concentrated on native proteins, and studies aimed at analysis of electrostatic properties of unfolded proteins are scarce. Most often, the denatured state is modeled by means of the null approximation (NA) (Antosiewicz et al. 1994), in which the electrostatic interactions are set to zero and the titratable groups are characterized by pK values of amino acids with the alpha amino and carboxyl groups substituted by blocking groups. The pK values of such model compounds can be obtained both experimentally and from quantum chemical calculations. This makes NA a convenient reference state for pK calculations of native proteins (Ullmann and Knapp 1999). However, NA becomes weak for prediction of the electrostatic term of ΔG because the assumption for zero electrostatic interactions does not hold (Pace et al. 2000). The fact that electrostatic interactions in denatured state cannot be neglected has been shown clearly by Fersht and coworkers in a series of studies (Oliveberg et al. 1994, 1995; Tan et al. 1995). These authors have shown that the pK values of the acidic groups in barnase are on average 0.4 pH units lower than those evaluated in terms of NA.
Other approaches in the modeling of the denatured state of proteins include the use of an extended conformation with or without additional conditions (Schaefer et al. 1997; Warwicker, 1999) and the use of a native state as a starting point in a simple molecular mechanics protocol (Elcock 1999). Yang and Honig (1994) have analyzed the pH and ionic strength effect on electrostatic free energy for different states of sperm whale apomyoglobin. The null model has been applied for the unfolded state of this molecule, whereas a mixture of model pK values and pK values corresponding to the native state have been used to describe intermediate states. All these approaches were designed to solve specific tasks and have the limitation of considering only one possible spatial distribution of protein charges (single conformation). This may be, in general, not representative for an unfolded protein. Recently we have proposed a new, more general model for calculation of electrostatic interactions in the denatured state of proteins (Kundrotas and Karshikoff 2002). It is based on a simple assumption that titratable sites of a denatured protein adopt a quasi-random distribution with restrictions arising from geometry and amino-acid sequence of a given molecule. The model was successfully applied for calculation of the titration curves and the pK values of the titratable groups of two proteins.
In this article we extend our model by introducing the influence of the desolvation of titratable groups on their ionization properties. We show that this model can be used for prediction of the pH dependence of the denaturation free energy.
Results
Continuum model of denatured state
The protein molecule in the denatured state is represented by an object with dielectric constant, ɛp, immersed in the medium of the solvent with ɛs > ɛp. It is known that because of differences in desolvation energies, a mobile charge is expelled from media with lower ɛ (protein interior) toward media with higher ɛ (solvent) (Warshel et al. 1984). Because charges of titratable groups belong to the protein moiety and because of polypeptide chain flexibility, it is plausible to suggest that titratable sites of a denatured protein in equilibrium tend to be located on the protein surface. The shape of an unfolded protein can be considered as an average of all possible conformations of a flexible chain, which results in a sphere inside which most of the protein atoms reside. The radius of this sphere is assumed to be equal to the radius of gyration, Rg, of a protein in its denatured state. To take into account a possible influence of protein sequence, the distance between two successive titratable sites, l and l` (l and l` stand for residue number in the sequence), is allowed to take only certain values, d(m), determined by the number, m = |l-l`|-1, of nontitratable residues separating these sites along the sequence. The N- and C-termini are considered to be titratable sites. If a terminal side chain is titratable, the distance between the charges within this residue is taken equal to d(0).
The model is based on three general parameters: the radius of the sphere that comprises the protein moiety, Rg; the dielectric constant of the protein moiety, ɛp; and the distance constrictions, d(m). To our knowledge, there are no consistent experimental data on ɛp; therefore, ɛp is an adjustable parameter in the current calculations.
To find general rules for evaluation of the parameters Rg and d(m), computer simulations on short polypeptide chains, constructed from 20 randomly chosen titratable residues, were performed. Details of the simulations are published elsewhere (Kundrotas and Karshikoff 2002), and only the essential results are presented below. The radius of the sphere representing the denatured protein can be evaluated using a simple relation:
 |
(3) |
where Nr is the total number of residues in a protein molecule (Nr ≥ 5). Despite its simplicity, equation 3 gives Rg values that show good agreement with experimentally measured Rg for a number of denatured proteins (Kundrotas and Karshikoff 2002).
The simulations showed that the distributions of d(m) approach very rapidly the Gaussian distribution when m increases. Practically all histograms for m > 4 have a Gaussian shape. Moreover, the histogram maxima shifts toward larger distances very slowly with increasing m (e.g., for m = 4 the maximum appears at distance ≈18 Å, whereas for m = 15 at ≈21 Å). For simplicity, single values of d(m) are used in the calculations presented below. These values correspond to the maxima of the histograms for the individual m: d(1) = 15.0 Å, d(2) = 15.5 Å, d(3) = 17.0 Å, d(4) = 18.0 Å, d(m ≥ 5) = 20.0 Å. For m = 0 (titratable residues are neighboring in the protein sequence), the d(m) histogram is characterized by two peaks: d`(0) = 10.0 Å and d"(0) = 12.5 Å. In this case, at each calculation step a random choice between those two values was made.
Model representations of barnase and NTL9
The model presented above was tested on two proteins: barnase from Bacillus amyloliquefaciens and N-terminal domain of the ribosomal protein L9 from Bacillus stearothermophilus (NTL9). Barnase is a protein with 110 residues, 35 of which are titratable groups (9 Asp, 3 Glu, 7 Tyr, 2 His, 8 Lys, and 6 Arg). Denatured barnase in a model representation is then a virtual chain containing 37 segments (titratable groups plus C- and N-terminals) located on a surface of the sphere with Rg = 24 Å (equation 3). NTL9 has 56 residues with the C-terminus amidated and titratable N-terminus. The protein sequence includes 2 Asp, 4 Glu, 11 Lys, and 1 Arg groups. Thus, the model virtual chain for NTL9 consists of 19 segments and Rg = 18 Å. Lengths of the chain segments were determined according to the corresponding protein sequences taken from the Protein Data Bank (Bernstein et al. 1977) (PDB codes are 1A2P for barnase and 1DIV for NTL 9).
pH-dependent stability of barnase and NTL9
The results presented below were obtained for T = 20°C, ionic strength 0.1 M, ɛs = 80, and exclusion radius of a solvent ion ΔR = 2 Å. We used the following set of standard pK values (Matthew 1985; Åqvist et al. 1991): pKi0 (Asp) = 4.0; pKi0 (Glu) = 4.4; pKi0 (His) = 6.3; pKi0 (Cys) = 9.1; pKi0 (Tyr) = 9.4; pKi0 (Lys) = 10.4; and pKi0 (Arg) = 12.0. Because experimental results for the proteins considered in this article are available for the acidic pH region only, hereafter we discuss the pK values only for acidic groups, although they were calculated for all types of titratable groups.
The values of ΔG for barnase and NTL9 were calculated by equations 1 and 2 using the set of pKiN values measured experimentally (Oliveberg et al. 1995; Kuhlman et al. 1999) and two different sets of pKiD: (i) pKiD = pKi0 that corresponds to NA and (ii) pKiD calculated by the model proposed in this work. The constants ΔG0 (equation 1) were chosen so that ΔG(pH 2.1) = 0 for barnase and ΔG(pH 0) = 2 kcal/mole for NTL9. The results are summarized in Table 1 and Figure 1 ▶.
Table 1.
p K values for native and denatured barnase and NTL9
| Residue | pKiNa | pKiOb | pKic | ΔpKel,id |
| Barnase | ||||
| Asp8 | 3.10 | 4.00 | 3.70 | −0.75 |
| Asp12 | 3.50 | 4.00 | 3.58 | −1.02 |
| Asp22 | 3.30 | 4.00 | 3.56 | −0.89 |
| Asp44 | 3.60 | 4.00 | 3.74 | −0.71 |
| Asp54 | 2.20 | 4.00 | 3.69 | −0.76 |
| Asp75 | 3.10 | 4.00 | 3.48 | −0.97 |
| Asp86 | 4.20 | 4.00 | 3.68 | −0.77 |
| Asp93 | 1.50 | 4.00 | 3.53 | −0.92 |
| Asp101 | 2.00 | 4.00 | 3.69 | −0.76 |
| Glu29 | 3.75 | 4.40 | 4.17 | −0.68 |
| Glu60 | 3.40 | 4.40 | 4.03 | −0.82 |
| Glu73 | 2.10 | 4.40 | 4.01 | −0.84 |
| NTL9 | ||||
| Asp8 | 2.99 | 4.00 | 3.51 | −1.09 |
| Asp23 | 3.05 | 4.00 | 3.54 | −1.06 |
| Glu17 | 3.57 | 4.40 | 3.99 | −1.01 |
| Glu38 | 4.04 | 4.40 | 4.09 | −0.91 |
| Glu48 | 4.21 | 4.40 | 4.00 | −1.00 |
| Glu54 | 4.21 | 4.40 | 4.03 | −0.97 |
a Experimental data. For barnase data taken from (Oliveberg et al. 1995). For NTL9 data taken from (Kuhlman et al. 1999).
b Standard pK values (null approximation).
c Values of pK calculated by the model presented in this work using ɛp = 29 (barnase) and ɛp = 20 (NTL9).
d Shift of protonation/deprotonation equilibrium as a result of the charge–charge interaction.
Fig. 1.

The calculated (lines) and experimental (circles) free energy of denaturation, ΔG, as a function of pH for barnase (panel A) and NTL9 (panel B). The experimental data for barnase and NTL9 are taken from the references Oliveberg et al. 1995 and Luisi and Raleigh 2000, respectively. Solid lines (numbered 2) stand for results of calculations using the model of denatured state proposed in the paper with ɛp = 29 (barnase) and with ɛp = 20 (NTL9); dashed lines (numbered 1) represent calculations with the null approximation (NA) as a model of denatured state. The results of calculations for barnase using the model of denatured state proposed in the article with ɛp = 40 (dotted curve 3 in panel A), the results for NTL9 using the model of the denatured state proposed in the article with ɛp = 20, and only pairwise electrostatic interactions taken into consideration (dotted curve 3 in the panel B) are also shown in the Figure for comparison.
Discussion
The model proposed in this work gives a more realistic physical description of unfolded proteins and predicts their electrostatic properties essentially better than the commonly used NA. For instance, for barnase the change of ΔG from pH ∼1 to pH ∼6 is ΔΔGexpbarnase ≈ 13 kcal/mole, whereas NA produces ΔΔGNAbarnase ≈ 23 kcal/mole. The corresponding values for NTL9 are: ΔΔGexpNTL9 ≈ 2 kcal/mole and ΔΔGNANTL9 ≈ 3.5 kcal/mole, respectively (see Fig. 1 ▶). It is also noteworthy that the introduction of the desolvation effects into the model (see Materials and Methods) significantly improves the evaluation of the electrostatic interactions. This is illustrated in Figure 1B ▶, where, ΔΔGELNTL9, calculated on the basis of pairwise electrostatic interactions only, indicates electrostatic destabilization of the native structure (ΔΔGELNTL9 ≈ −3.5 kcal/mole), whereas the experimental results show the opposite.
Very often, assessments of ΔΔG based on the NA give seeming good correlation with experimental data. This is the case, for instance, when GdmHCl is used as a denaturing agent, which eliminates electrostatic effects. This is also the case in pH regions, for example, pH 5–9 for SNase (see Fig. 3 in Kundrotas and Karshikoff 2002), in which no protonation or deprotonation takes place. Then NA, and the model presented here gives identical overall protein charge but may give different ΔΔG. In special cases when pairwise interactions are compensated by the desolvation penalty, the two models give identical results as well. In all other cases, NA appears to be an oversimplification.
A noteworthy result is that a small but detectable variation of pKiD values calculated for the individual groups of the same kind is observed (Table 1). This is not consistent with the concept of the denatured state as a state in which the spread of pKiD is lost. The calculations showed (Kundrotas and Karshikoff 2002) that such variation is not caused by statistical insufficiency but rather reflects the influence of the protein sequence on the titration properties of individual titratable groups in denatured proteins. Recent pK measurements on short fragments of NTL9 (Kuhlman et al. 1999) have also shown that local structure and sequence can have a distinguishable effect on the pK values.
One of the critical parameters of the model is the dielectric constant of the protein material. As mentioned previously, the protonation and deprotonation equilibria are sensitive to the value of this parameter. For instance, the calculations performed with ɛp = 40 showed an apparent overestimation of the electrostatic interactions (see Fig. 1A ▶, curve 2). Essentially better agreement is obtained with a lower dielectric constant: ɛp = 29 for barnase (Fig. 1A ▶, curve 1) and ɛp = 20 for NTL9 (Fig. 1B ▶, curve 1). This result originates from the fact that the reduction of ɛp enhances charge–charge interactions to a lesser extent than desolvation penalty. Our calculations indicate that an appropriate range for the dielectric constant of denatured proteins is between 20 and 30.
One of the key assumptions of the model is that the unfolded protein is approximated by a sphere with a radius equal to the radius of gyration Rg of a flexible polypeptide chain. In general, proteins at different conditions (such as pH and temperature) may adopt various denatured states characterized by different compactness and often by distinctive residual secondary structures. These factors are not reflected in equation 3, which was obtained from pure geometrical considerations. A reconsideration of equation 3 to include terms determining pH and temperature dependencies of Rg is in progress.
Materials and methods
pK calculations in denatured state
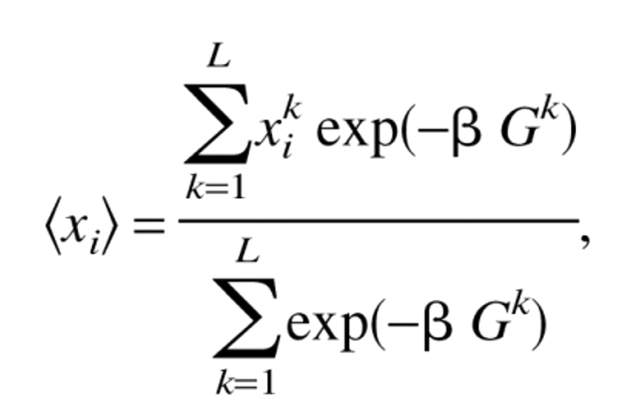
The pK value of an individual titratable site i can be obtained by calculating the degree of deprotonation for this group as a function of pH. It is convenient to introduce a deprotonation variable, xi, associated with a titratable site i (xi = 1 when a site i is deprotonated and xi = 0 when a site i is protonated) (Bashford and Karplus 1991). The pH value in which <xi> = 0.5 is then equivalent to the pK value of group i. At a given pH and temperature <xi> obeys the Boltzmann statistics
 |
(4) |
where xik is the value (0 or 1) of xi in a microscopic state k of a protein molecule and Gk is the free energy of the molecule in the state k defined as
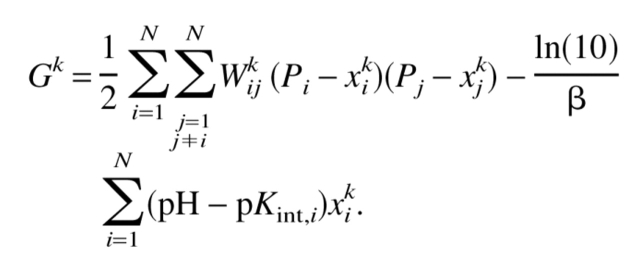 |
(5) |
Here Pi = 1 for basic groups and Pi = 0 for acidic groups. According to the Tanford definition (Tanford and Kirkwood 1957), the intrinsic pK value of a site i, pKint,i consists of the standard pK value of the i-th residue and of the pK shifts arising from influence of protein permanent charges, ΔpKper,i, and attributable to the desolvation penalty ΔpKsol,i:
 |
(6) |
The summation in equation 4 runs over all L microscopic states of the system. Assuming single structure for a native protein, a microscopic state is uniquely defined by an N-dimensional vector Xk = (x1k, x2k, . . ., xNk), which gives L = 2N. The assumption of a single structure does not hold for denatured proteins because titratable sites can change their spatial allocation. The vector Xk then becomes (2 × N)-dimensional, Xk = (r1k, r2k, . . . , rNk, x1k, x2k, . . . , xNk), where rikdetermines the coordinates of a site i in a state k. This increases L dramatically and makes the summation in equation 4 unfeasible even for short polypeptide chains with N ∼ 10. An appropriate solution of this problem is the application of the Monte Carlo (MC) technique in which equation 4 is substituted by a simple average
 |
(7) |
over the number LMC << L of states generated randomly according to the probability p(Xk → Xk+1) = min{1,exp(−βΔGk)} with ΔGk being the difference between the energies (equation 5) of states k + 1 and k. It is proven (Binder 1979) that equations 4 and 7 give indistinguishable results providing sufficiently large LMC and statistical independence of states included in equation 7.
Generation of denatured protein
The protein molecule is represented as a virtual chain with N elements, each of them corresponding to one titratable site. According to the assumptions described previously, the chain elements (i.e., the titratable sites) are located on the surface of a sphere that comprises the material of the denatured protein. The possible positions of the chain elements are predetermined by a set of uniformly distributed points on the surface of the sphere forming a spherical grid. The minimum distance between the grid points, dmin, is ∼3 Å, which is close to the minimum distance between the charges of an ion pair in proteins. An initial configuration of the virtual chain is generated by arbitrarily placing the first point on the spherical grid and by placing each next point so that (1) the chain does not become self-intersecting and (2) the distance from the previous point satisfies the constraint d(m) ± dmin. When generating Xk + 1 from Xk, either the protonation state (xik → xik+ in equation 5) or allocation (Wijk → Wijk+1 in equation 5) of a randomly chosen titratable site is altered. The choice between the two types of alterations is made randomly. The set of deprotonation variables was stored after repeating the above generation procedure N times, which comprises one MC step per site (MCS/S). All results presented below were obtained as an average over 20 MC runs with different initial configuration of the virtual chain. Each run consists of 10,000 MCS/S with the first 2000 MCS/S being discarded from consideration. The average over MC runs reduces computational time considerably because it diminishes problems related to a trapping of the system in a metastable state.
Calculations of Wij and desolvation energy
Because of the assumed spherical shape of an unfolded molecule in equilibrium, the pairwise interactions Wijk in equation 5 can be calculated using the formalism developed by Kirkwood and Tanford (Kirkwood 1934; Tanford and Kirkwood 1957).
It should be noted that the interactions of the titratable sites with other polar components, such as peptide dipoles, are generally not negligible, especially if charge and dipole belong to the same group (Spassov et al. 1997). For the purpose of the current calculations, however, such interactions can be neglected, because they are approximately the same in both native and denatured states. Otherwise, charge–dipole interactions can be neglected (ΔpKper,I = 0 in equation 6) because they include an average over all possible dipole orientations.
It has been shown (Warshel et al. 1984) that ΔpKsol is sensitive to the dielectric environment. It is then desirable to obtain values of ΔpKsol,i for different types of titratable groups before applying the above model to denatured proteins. For this purpose, calculations for seven types of titratable groups (glutamic and aspartic acids, lysine, arginine, cysteine, tyrosine, and histidine) located on the surface of a dielectric sphere were performed for different radii and dielectric constants, ɛp, inside the sphere. Because the Kirkwood-Tanford formalism produces a divergent self energy for a charge at the surface of a dielectric boundary, the values of ΔpKsol,i were calculated using the formula
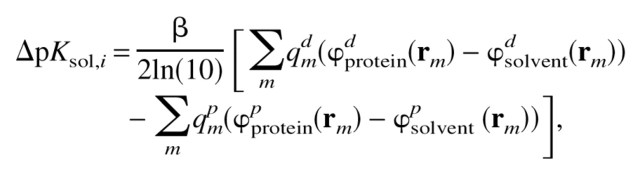 |
(8) |
where qmd and qmp are the charge value of an atom m of the titratable group i in its deprotonated (d) and protonated (p) forms, respectively. The potential fields ϕproteinp(d) (rm) and ϕsolventp(d) (rm) are created by the charges, qm, of protonated (deprotonated) residue in protein and in solvent, respectively. The calculations were performed numerically using the finite difference method. The calculated values display a clearly pronounced dependence on ɛp (see Fig. 2 ▶, in which typical results of calculations are shown).
Fig. 2.

Calculated values for the glutamic acid as a function of radius, R, of dielectric sphere at different values of dielectric constant, ɛp, inside the sphere. The results were obtained for simplified charge distributions. For the deprotonated state, a charge of −0.5 p.u. was assigned to carboxyl oxygens. For the protonated state, all atoms were taken neutral.
Acknowledgments
This work was supported by grant BIO4CT970129 from the IV Biotechnology Program of the European Communities and by grant A1–5/2286 from the Swedish Council for Planning and Coordination of Research. The authors thank Professor Rudolf Ladenstein for unreserved support and useful discussions.
The publication costs of this article were defrayed in part by payment of page charges. This article must therefore be hereby marked "advertisement" in accordance with 18 USC section 1734 solely to indicate this fact.
Article and publication are at http://www.proteinscience.org/cgi/doi/10.1110/ps.4690102.
References
- Antosiewicz, J., McCammon, J.A., and Gilson, M.K. 1994. Prediction of pH-dependent properties of proteins. J. Mol. Biol. 238 415–436. [DOI] [PubMed] [Google Scholar]
- Åqvist, J., Luecke, H., Quiocho, F.A., and Warshel, A. 1991. Dipoles localized at helix termini of proteins stabilize charges. Proc. Natl. Acad. Sci. 88 2026–2030. [DOI] [PMC free article] [PubMed] [Google Scholar]
- Bashford, D. and Karplus, M. 1991. Multiple-site titration curves of proteins: An analysis of exact and approximate methods for their calculation. J. Phys. Chem. 95 9556–9561. [Google Scholar]
- Bernstein, F.C., Koetzle, T.F., Williams, G.J.B., Meyer, E.D.J., Brice, M.D., Rogers, J.R., Kennard, O., Shinaniushi, T., and Tasumi, M. 1977. The Protein Data Bank: A computer based archival file for macromolecular structures. J. Mol. Biol. 112 535–542. [DOI] [PubMed] [Google Scholar]
- Binder, K. 1979. General aspects of theory and technique of statistical modeling by the Monte Carlo method. In Monte Carlo methods in statistical physics (ed. K. Binder), pp. 9–57. Springer-Verlag, Berlin.
- Elcock, A.H. 1999. Realistic modeling of the denatured states of proteins allows accurate calculations of the pH dependence of protein stability. J. Mol. Biol. 294 1051–1062. [DOI] [PubMed] [Google Scholar]
- Kirkwood, J.G. 1934. Theory of solutions of molecules containing widely separated charges with special application to zwitterions. J. Chem. Phys. 2 351–361. [Google Scholar]
- Koumanov, A., Rüterjans, H., and Karshikoff, A. 2002. Continuum electrostatic analysis of irregular ionization and proton allocation in proteins. Proteins 46 85–96. [DOI] [PubMed] [Google Scholar]
- Kuhlman, B., Luisi, D.L., Young, P., and Raleigh, D.P. 1999. pKa values and the pH dependent stability of the N-terminal domain of L9 as probes of electrostatic interactions in the denatured state. Differentiation between local and nonlocal interactions. Biochemistry 38 4896–4903. [DOI] [PubMed] [Google Scholar]
- Kundrotas, P.J. and Karshikoff, A. 2002. Model for calculations of electrostatic interactions in unfolded proteins. Phys. Rev. E 65. [DOI] [PubMed]
- Luisi, D.L. and Raleigh, D.P. 2000. pH-Dependent interactions and the stability and folding kinetics of the N-terminal domain of L9. Electrostatic interactions are only weakly formed in the transition state of folding. J. Mol. Biol. 299 1091–1100. [DOI] [PubMed] [Google Scholar]
- Matthew, J.B. 1985. Electrostatic effects in proteins. Annu. Rev. Biophys. Biomol. Struct. 14 387–417. [DOI] [PubMed] [Google Scholar]
- Oliveberg, M., Arcus, V.L., and Fersht, A.R. 1995. pKA values of carboxyl groups in the native and denatured state of barnase: The pKA values of the denatured state are on 0.4 units lower than those of model compounds. Biochemistry 34 9424–9433. [DOI] [PubMed] [Google Scholar]
- Oliveberg, M., Vuilleumier, S., and Fersht, A. 1994. Thermodynamic study of the acid denaturation of barnase and its dependence on ionic strength: Evidence for residual electrostatic interactions in the acid/thermal denatured state. Biochemistry 33 8826–8832. [DOI] [PubMed] [Google Scholar]
- Pace, C.N., Alston, R.W., and Shaw, K.L. 2000. Charge-charge interactions influence the denatured state ensemble and contribute to protein stability. Protein Sci. 9 1395–1398. [DOI] [PMC free article] [PubMed] [Google Scholar]
- Schaefer, M., Sommer, M., and Karplus, M. 1997. pH-dependence of protein stability: Absolute electrostatic free energy difference between conformations. J. Phys. Chem. B 101 1663–1683. [Google Scholar]
- Spassov, V.Z., Ladenstein, R., and Karshikoff, A. 1997. Optimization of the electrostatic interactions between ionized groups and peptide dipoles in proteins. Protein Sci. 6 1190–1195. [DOI] [PMC free article] [PubMed] [Google Scholar]
- Tan, Y.-J., Olivegerg, M., Davis, B., and Fersht, A.R. 1995. Perturbed pKa-values in the denatured states of proteins. J. Mol. Biol. 254 980–992. [DOI] [PubMed] [Google Scholar]
- Tanford, C. 1968. Protein denaturation. Adv. Protein Chem. 23 121–282. [DOI] [PubMed] [Google Scholar]
- Tanford, C. and Kirkwood, J.G. 1957. Theory of titration curves. I. General equations for impenetrable spheres. J. Am. Chem. Soc. 79 5333–5339. [Google Scholar]
- Ullmann, G.M. and Knapp, E.W. 1999. Electrostatic models for computing protonation and redox equilibria in proteins [Review]. Eur. Biophys. J. 28 533–551. [DOI] [PubMed] [Google Scholar]
- Warshel, A., Russell, S.T., and Churg, A.K. 1984. Macroscopic models for studies of electrostatic interactions in proteins: Limitations and applicability. Proc. Natl. Acad. Sci. 81 4785–4789. [DOI] [PMC free article] [PubMed] [Google Scholar]
- Warwicker, J. 1999. Simplified methods for pK(a) and acid pH-dependent stability estimation in proteins: Removing dielectric and counterion boundaries. Protein Sci. 8 418–425. [DOI] [PMC free article] [PubMed] [Google Scholar]
- Yang, A.-S. and Honig, B. 1994. Structural origin of pH and ionic strength effects on protein stability. Acid denaturation of sperm whale apomyoglobin. J. Mol. Biol. 237 602–614. [DOI] [PubMed] [Google Scholar]