Abstract
A major bottleneck in comparative modeling is the alignment quality; this is especially true for proteins whose distant relationships could be reliably recognized only by recent advances in fold recognition. The best algorithms excel in recognizing distant homologs but often produce incorrect alignments for over 50% of protein pairs in large fold-prediction benchmarks. The alignments obtained by sequence–sequence or sequence–structure matching algorithms differ significantly from the structural alignments. To study this problem, we developed a simplified method to explicitly enumerate all possible alignments for a pair of proteins. This allowed us to estimate the number of significantly different alignments for a given scoring method that score better than the structural alignment. Using several examples of distantly related proteins, we show that for standard sequence–sequence alignment methods, the number of significantly different alignments is usually large, often about 1010 alternatives. This distance decreases when the alignment method is improved, but the number is still too large for the brute force enumeration approach. More effective strategies were needed, so we evaluated and compared two well-known approaches for searching the space of suboptimal alignments. We combined their best features and produced a hybrid method, which yielded alignments that surpassed the original alignments for about 50% of protein pairs with minimal computational effort.
Keywords: Profile-profile alignments, suboptimal alignments, sequence profiles, FFAS
Crucial insights into the functions of proteins are provided by their three-dimensional structures. Enzymatic reactions, substrate recognitions, and protein–protein interactions all happen on a molecular level, and whether we want to understand, inhibit, or enhance them, it is necessary to look at the three-dimensional molecular structures of proteins. The importance of protein structure in understanding function is exemplified by the recent Structural Genomics Initiative: a massive effort to solve the structure of at least one representative from every protein family (Burley et al. 1999; Berman et al. 2000).
However, the Structural Genomics Initiative could not provide us with experimental structures for all known proteins. The number of known protein sequences is several orders of magnitude larger than the most optimistic estimates of the number of protein structures that will be solved by high-throughput structure determination; the best chance of gaining structural insights for many proteins will be comparative modeling. In such predictions, a model for a protein's structure is built on the basis of a known experimental structure of a homologous protein. The number of experimentally determined structures has grown rapidly in the last few years and this growth is expected to accelerate with the advent of the Structural Genomics Initiative. Coupled with recent advances in algorithms for fold recognition, this growth has made it possible to build reliable models for over 50% of bacterial proteins and about 40% of higher eukaryotic proteins (Pawlowski et al. 2001). We can expect that comparative modeling will apply to more proteins as the number of solved structures for different protein folds increases.
The process of building a protein model is highly modular, typically consisting of three major stages: recognizing the best template for the target protein, calculating the alignment between the target and the template, and building the final model using the template's three-dimensional (3D) structure.
Each step has unique challenges, and errors in earlier steps cannot be corrected later. For example, choosing the wrong template could not be improved by doing a good alignment. And the quality of the alignment decides the quality of the final model (Sanchez and Sali 1997). Despite advances in the methodology for automated loop building, even the best loop-building algorithm cannot correct misalignments at the ends of the secondary structure elements or missing some of them in the alignment. The quality of loop building decides the quality of the final model, but only if no errors were made in earlier stages. However, this is seldom the case except for very close homologs. Fold (or distant homology) recognition and loop building have received a lot of attention, but surprisingly much less effort was put into improving the alignment quality. In this article, we focus on the alignment stage of comparative modeling, or, rather, on the question of how much the alignment quality can be improved within the current generation of the fold-recognition algorithms.
The development of fold-recognition algorithms, threading, and sophisticated profile-alignment methods, has increased the applicable range of comparative modeling, but has also exacerbated existing problems in the alignment step (CASP4 2000). The most important difference between teams at the Asilomar Critical Assessment of Techniques for Protein Structure Prediction (CASP) meetings was their ability to minimize errors in the alignments (Jones and Kleywegt 1999). CASP4 evaluators established that there was no significant improvement in alignment accuracy (as measured by "percent correctly aligned residues") between CASP3 and CASP4 (Tramontano et al. 2001), despite a significant progress in the recognition step.
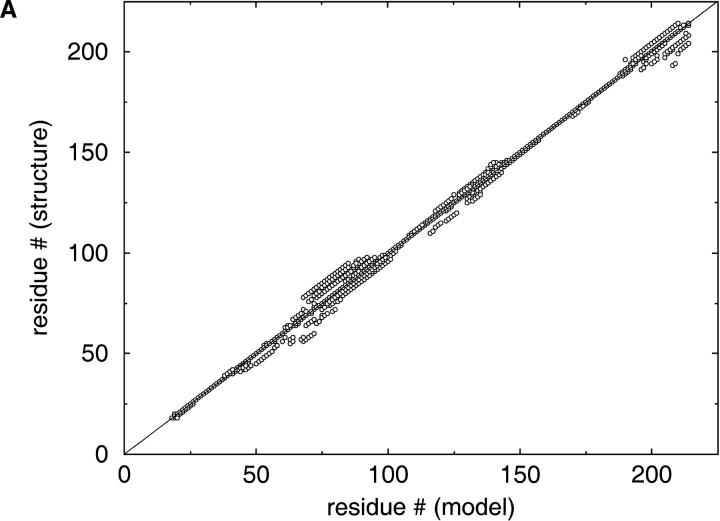
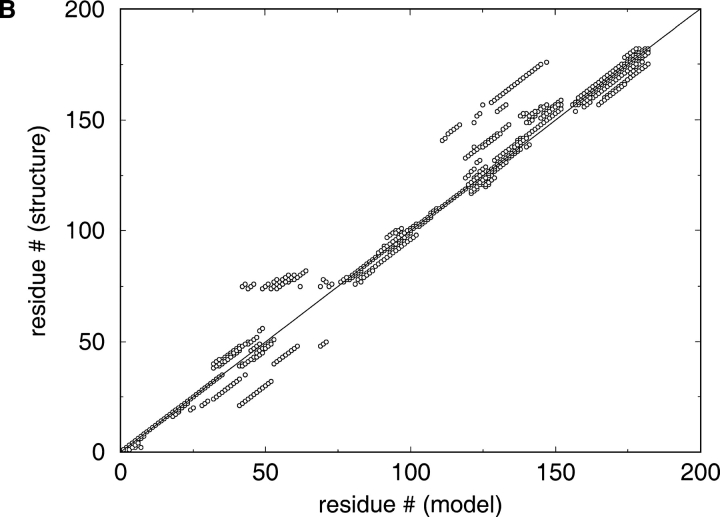
The serious problems with alignment quality can be easily illustrated by the analysis of graphical summaries made available by CASP4 organizers on its web site: http://predictioncenter.llnl.gov/casp4/. CASP4 organizers provide a comprehensive graphical description of alignment accuracy. The graphs are based on the comparison of the models with real structures of the targets superimposed with the Local-Global Alignment (LGA) program (Zemla et al. 1999). Because most of the groups submitted 3D structures, we cannot directly assess the accuracy of all the alignments used to build the models. Most groups succeeded at finding the structural template for the target, and there is a common opinion that the discrepancies between the models and real structures detected with the LGA algorithm (Zemla et al. 1999) mainly reflect errors in the alignments. There is a very wide distribution of alignment accuracy, and even the alignments for relatively easy targets submitted by most groups differ significantly from the structural alignment within loop regions and secondary structure elements (Fig. 1A ▶). For more difficult targets, the situation is more dramatic (Fig. 1B ▶).
Fig. 1.
LGA (Zemla et al. 1999) structural alignments of the models submitted by the predictors with the real structures of the two CASP4 (Fourth Meeting on the Critical Assessment of Techniques for Protein Structure Prediction) targets. The discrepancies between these alignments reflect the discrepancies between the alignments used for homology modeling. Real structure (the case of 100% correct prediction) would be the diagonal straight line on this plot. (A) T0117 (AF185268) is deoxyribonucleoside kinase from Drosophila melanogaster. (B) T0109 (P45340) is oligoribonuclease from Haemophilus influenzae.
For protein pairs in which both 3D structures are known, it is possible to compare the alignment obtained from sequence comparison with the one obtained from comparing structures. Despite some ambiguities in the definitions of structural alignments (Godzik 1996), structural alignments are often treated as the "standards of truth" in evaluating sequence alignments because it is generally accepted that, with increasing evolutionary distance, structures change less than do sequences (Vogt et al. 1995). By this criterion, standard alignment methods are usually correct if the amino acid sequences of the target and template are more than 50% identical. When proteins are 30%–50% identical, then significant shifts between different alignments emerge, mostly in the loop regions. When sequence identity is below 30%, then sequence alignments become very unstable, changing dramatically with scoring matrices and gap penalties (Vogt et al. 1995); they essentially become random for structurally similar proteins with undetectable sequence similarity (Holm et al. 1992; Pascarella and Argos 1992; Orengo et al. 1997).
Comparison of sequence-based alignments obtained with fold-recognition algorithms with structural alignments indicates that structural alignments correctly describe the relationship between proteins of moderate or low sequence similarity. Hence, good-quality alignments for distantly related protein pairs exist but they could not be found with currently existing algorithms without knowing both structures. A procedure for finding such alignments would significantly increase the range of applications for comparative modeling to proteins with moderate-to-low sequence similarity.
For known protein structures, it is possible to evaluate the accuracy of a given alignment by testing how well it describes the similarity between these structures. Throughout this article, we use structure-based criteria to evaluate sequence-based alignments and we call alignments "good" or "bad", depending on how closely they recover structural similarity. This is possible in the context of a benchmark, in which the structures of both proteins are known; such analyses allow us to develop tools and insights for the analysis of alternative alignments in real prediction cases.
We calculate the structural similarity of the target and template as seen by the alignment to be evaluated and we use this value as a measure of the alignment accuracy. We used this approach to evaluate the accuracy of alignments obtained with different methods (Jaroszewski et al. 2000); a similar approach was used to evaluate structure predictions in the CASP4 meeting (CASP4 2000; Sippl et al. 2001).
We used three particular measures of protein structural similarity: contact map overlap (CMO), root mean square deviation (RMSD) (Kabsch 1978) and percent of the structural alignment (PSA) reproduced by a given alignment. CMO (Godzik et al. 1993; Godzik 1996) has several advantages, and, in particular, it is less sensitive to extending the alignment into less similar regions. The other similarity measure, RMSD, is very susceptible to extending the alignment. A detailed description of alignment accuracy measures and a discussion of their features were recently published (Jaroszewski et al. 2000). PSA was obtained by comparison of a given alignment with the structural alignment obtained from the Combinatorial Extension (CE) algorithm (Shindyalov and Bourne 1998). The percent of overlap between these two alignments was calculated as the percent of residue pairs aligned in the same way in both alignments. To compare different algorithms, we calculated average values for these measures over the entire benchmark. Our opinion is that this is the best way to detect some general trends. It should be noted that, for weakly and moderately similar protein pairs, alignment accuracies are widely distributed and the average values only give some general insights.
Structural alignments used in this publication were obtained by using the Combinatorial Extension algorithm (Shindyalov and Bourne 1998). The program was downloaded from the San Diego Supercomputer Center's ftp site: ftp://ftp.sdsc.edu/pub/sdsc/biology/CE/src/. We used the CE program's default parameters. As discussed earlier, structural alignments obtained with different algorithms differ from each other but their differences are usually small in comparison to errors made by sequence-based methods.
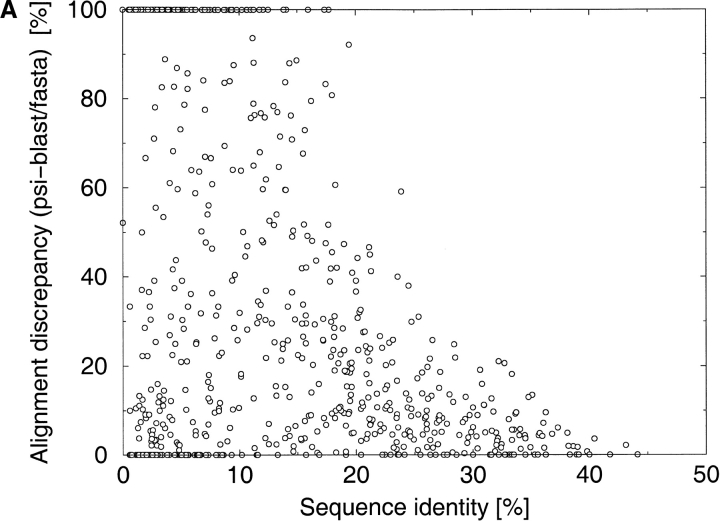
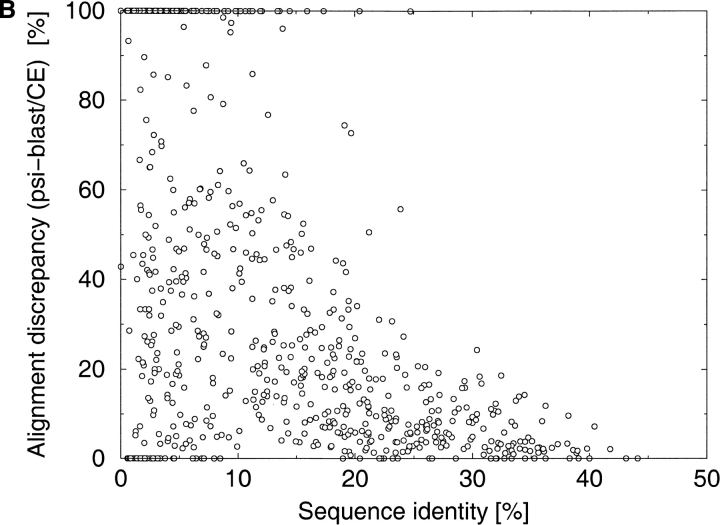
To obtain more general information about alignment accuracy as a function of sequence identity, we compared different alignments for large sets of protein pairs that were less than 45% identical. The alignments were calculated with two popular sequence alignment programs: FASTA (Pearson and Lipman 1988) and PSI-BLAST (Altschul et al. 1997). The structural alignment was calculated with the CE algorithm (Shindyalov and Bourne 1998). These comparisons indicate that alignments can be completely incorrect below 25%–30% of sequence identity between sequences (Fig. 2A,B ▶). The alignments obtained with PSI-BLAST can differ over their entire lengths from the alignments obtained with FASTA and they can be completely different from the structural alignments. The distribution of alignment accuracy is very broad—some PSI-BLAST and FASTA alignments for this range of sequence identities were very accurate despite low sequence identity.
Fig. 2.
The distribution of discrepancies between the different alignments as a function of sequence identity. Alignment discrepancy is measured as the percentage of differently aligned residues in the shorter of two alignments. The discrepancies have been calculated for a comprehensive benchmark of protein pairs consisting of 742 protein pairs selected from the Structural Classification of Proteins (SCOP) database. (A) PSI-BLAST (Altschul et al. 1997) alignments versus FASTA (Pearson and Lipman 1988) alignments. (B) PSI-BLAST alignments versus CE (Shindyalov and Bourne 1998) structural alignments.
The majority of alignments in the 30%–45% sequence identity range were partly correct and there was some overlap between the PSI-BLAST and FASTA alignments (Fig. 2A,B ▶). There is much less alignment variation with protein pairs with identities above the 45% threshold, which until recently were the focus of most modeling projects, perhaps explaining why the alignment-quality problem has not been widely appreciated. There have been some serious attempts to address the problem of alignment quality, but they concentrated on optimizing alignment parameters (Vogt et al. 1995) or identifying an alignment's reliable fragments (Vingron and Argos 1990; Mevissen and Vingron 1996).
Dynamic programming (Needleman and Wunsch 1970; Smith and Waterman 1981), the most popular alignment algorithm, calculates the score of the best alignment between two proteins and provides a single alignment with this score. It does not provide information about how many different alignments have scores close to the optimal one, and how different these alignments are. In principle, this information is easily available in alignment algorithms based on high-scoring segment pairs, such as those used in BLAST, but the most popular implementations of these algorithms do not provide such information. In fact, none of the widely used alignment algorithms tells anything about the shape and structure of the suboptimal alignments' space. To the best of our knowledge, only one publicly available program provides tools for visualization of the density of suboptimal alignments: the fold-recognition program MatchMaker from TRIPOS. The space of suboptimal alignments was studied by several authors and sampling strategies for this space are in the literature (Saqi and Sternberg 1991; Zuker 1991; Waterman et al. 1992; Naor and Brutlag 1994; Waterman 1995); however, none of these methods is publicly available, with the exception of the declumping algorithm in the USC (University of Southern California) software alignment package (http://www-hto.usc.edu/).
The dynamic programming algorithm requires two types of parameters: a substitution matrix and the penalties for introducing gaps into the alignment. The first group of parameters yields information about the probability of one amino acid being replaced by another via substitution. The derivation of substitution matrices can be based on various information sources: structural equivalence of numerous protein sequences, genetic code similarity, chemical similarity, hydrophobicity, physical property indices, main-chain folding angles, contact potential, and neighborhood selectivity (Tomii and Kanehisa 1996). Various groups have derived hundreds of various substitution matrices. They have been collected, systematically analyzed, and made publicly available on the Internet (Tomii and Kanehisa 1996). The second type of parameter is the gap introduction and extension penalty (Waterman et al. 1992), which has no clear physical interpretation and is usually determined by an empirical optimization.
Enumeration of all possible alignments for medium-size proteins leads to a combinatorial explosion. Estimates (Waterman 1995) indicate that the explicit construction of all possible alignments is computationally unfeasible; however, it is possible to enumerate all significantly different alignments by imposing some constraints on the alignments. By imposing such constraints on the alignments, we were able to assess the distance between the lowest-scoring alignment and the structural alignment for some protein pairs. Even after imposing such constraints, the number of resulting alignments is still enormous and limits the practical significance of this method.
There are two practical approaches to alternative alignment calculations. In the first "iterative elimination" approach, one uses single-sequence similarity function and iteratively calculates suboptimal alignments. Several variants of this method have been described (Saqi and Sternberg 1991; Waterman 1995) and are effective in some examples (Saqi and Sternberg 1991; Saqi et al. 1992). In the second, "parametric" approach, alternative alignments are generated by varying scoring functions and gap penalties (Jaroszewski et al. 1998a; Pawlowski et al. 1997; Waterman et al. 1992). The concept behind this strategy is that there is no single optimal similarity measurement for all pairs of distant protein homologs. If several combinations of parameter sets optimized for special situations are applied, then one may have a greater chance for finding a correct alignment than by iterative elimination of suboptimal alignments by using a single similarity measure. These two approaches are two search strategies in two projections of the same, huge space of alternative alignments.
An effective method for calculating alternative alignments should provide sets of alignments that contain at least one alignment that is significantly more accurate than the best-scoring alignment (illustrated in Fig. 3 ▶). Of course, the presence of the accurate alignment in the set of suboptimal alignments has little practical significance unless it is possible to recognize it before both structures are known. It is possible to select the best alignment by building the models using all of the alignments and then evaluating their self-threading energy (Pawlowski et al. 1997; Jaroszewski et al. 1998a) or core volumes and packing pair potentials (Saqi et al. 1992). Our version of this approach, the multiple model approach (MMA), was tested for 16 pairs of distantly related proteins (Pawlowski et al. 1997; Jaroszewski et al. 1998a). Other approaches for verifying the quality of alignments are possible: neural networks (Jones 1999) and energy calculations in the defrosted approximation (Godzik et al. 1992).
Fig. 3.
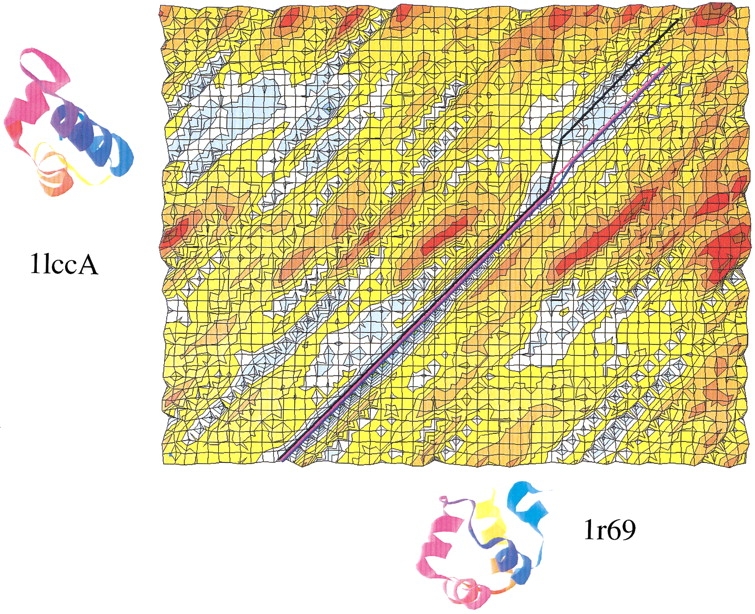
Fold and Function Assignment System (FFAS) similarity matrix (Rychlewski et al. 2000) calculated for 1r69 and 1lccA sequences and presented as a surface plot (blue colors mean higher similarity; red colors mean lower similarity). (A similarity matrix is a matrix describing a similarity score assigned to each pair of potentially aligned residues. Here, the X-axis corresponds to the query sequence and the Y-axis corresponds to the target sequence.) The picture illustrates an obvious discrepancy between the C-terminal fragments of the best-scoring Fold and Function Assignment System (FFAS) alignment (shown as a black path on the A1 matrix surface) and the CE structural alignment (shown in blue). The best suboptimal alignment (shown in pink) overlaps with 90% of the structural alignment. Root mean square deviation values of the FFAS alignment, the best suboptimal alignment, and the structural alignment are 3.6, 2.6, and 2.1 Å, respectively. All three alignments correctly assign the second and third helix of 1r69 to the first and second from 1lccA, but the lowest-scoring FFAS alignment incorrectly embraces the C-terminal part of the last helix from 1lccA. 1lccA is the N-terminal domain of the Lac repressor (LacR) from Escherichia coli. 1r69 is the DNA-binding domain of the C1 repressor from E. coli-derived Phage 434. Both proteins belong to the same structural superfamily in the SCOP database.
However, in this manuscript we focused on the question of whether a good alignment exists in a set of alternative alignments using a given method. The question of how to recognize such alignments will be discussed in a separate publication.
All tests and calculations were obtained with the profile–profile alignment algorithm Fold and Function Assignment System (FFAS) (Rychlewski et al. 2000), which was developed by our group and tested in the CASP4 fold-prediction experiment, where it compared favorably with other automated fold-recognition algorithms (the second-best score among automated fold-prediction servers).
Results
We evaluated the average alignment accuracy for each of the different ranges of FFAS z-score (Table 1) and found that the FFAS z-score is a good indicator of the alignment quality. Hence, we used these FFAS z-score-based similarity ranges in subsequent computational experiments.
Table 1.
The average global accuracy of FFAS profile–profile alignments for different ranges of FFAS z-score
| Benchmark subset | FFAS z-score range | Average RMSD (Å) | Average CMO (%) | Average PSA (%) |
| High similarity | >14 | 6.2 (1.5) | 52 (6) | 72 (9) |
| Moderate similarity | 14–7 | 9.1 (2.3) | 36 (8) | 45 (10) |
| Low similarity | 7–2 | 12.3 (1.9) | 26 (9) | 4 (11) |
| Undetectable similarity | <2 | 13.7 (2.0) | 19 (11) | 11 (8) |
Values of variance are given in parentheses. (FFAS) Fold and Function Assignment System; (RMSD) root mean square deviation; (CMO) contact map overlap; (PSA) percent of the structural alignment.
In the first numerical experiment, we enumerated all possible alignments for selected protein pairs. The distance between the best-scoring alignment and structural alignment does not directly depend on the total number of possible suboptimal alignments. The distance to the structural alignment is diverse and does not correlate with the accuracy of the alignment obtained with a hybrid method (Table 2). For example, in the case of the 1yhb/1pfsA protein pair, the distance to the structural alignment is 10 times smaller than the total number of alignments, and in this case the hybrid method found the alignment with an RMSD value of 3.3Å: to be the same as the RMSD of the structural alignment. On the other hand, the 1huw/1cnt1 and 2ligA/256bA protein pairs have quite short distances between the best-scoring alignments and the structural alignments, but the alignment's improvement by the hybrid method is not as striking as for 1yhb/1pfsA. This may indicate that the search for the optimal scoring function for a given protein pair may yield a correct alignment even in cases where the distance to the structural alignment is enormous if accessed for a single scoring function.
Table 2.
A detailed analysis of the suboptimal alignment space for selected protein pairs
| Query/target | Number of secondary structure elements | Total number of alignments | Distance to structural alignmenta |
| 1huw/1cnt1 | 4 | 1 × 10⁶ | 4800 |
| 1yhb/1pfsA | 5 | 2 × 10⁶ | 5 × 10⁵ |
| 2ligA/256bA | 5 | 4 × 10⁷ | 36 |
| 1neu/1fna | 6 | 5 × 10⁷ | 2 × 10⁵ |
| 1dcoA/1xxaA | 6 | 1 × 10⁸ | 3 × 10⁶ |
| 1urnA/1aps | 7 | 1 × 10⁸ | 2 × 10⁷ |
| Query/target | RMSD of the best scoring FFAS alignmentb | RMSD of the best alignment from hybrid method | RMSD of structural alignment |
| The results of direct enumeration of suboptimal alignments within reduced alignment spaces and the effectiveness of the suboptimal alignment calculations with the hybrid method. | |||
| a Distance to structural alignment is defined as the number of alignments scoring better than the structural alignment (e.g., number of alignments between the best scoring alignment and structural alignment. | |||
| b (RMSD) Root mean square deviation; (FFAS) Fold and Function Assignment System. | |||
| 1huw/1cnt1 | 15.0 | 10.5 | 2.9 |
| 1yhb/1pfsA | 9.8 | 3.3 | 3.3 |
| 2ligA/256bA | 14.3 | 6.6 | 2.9 |
| 1neu/1fna | 15.2 | 5.8 | 3.2 |
| 1dcoA/1xxaA | 12.8 | 7.1 | 2.8 |
| 1urnA/1aps | 11.5 | 7.9 | 3.2 |
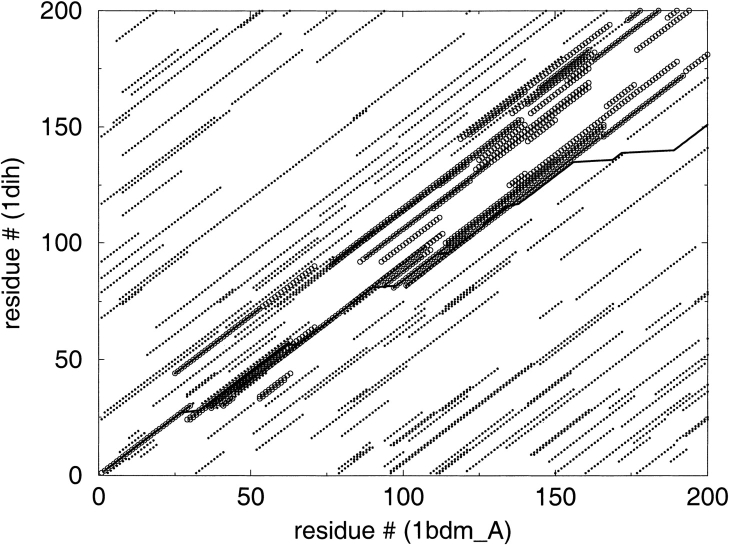
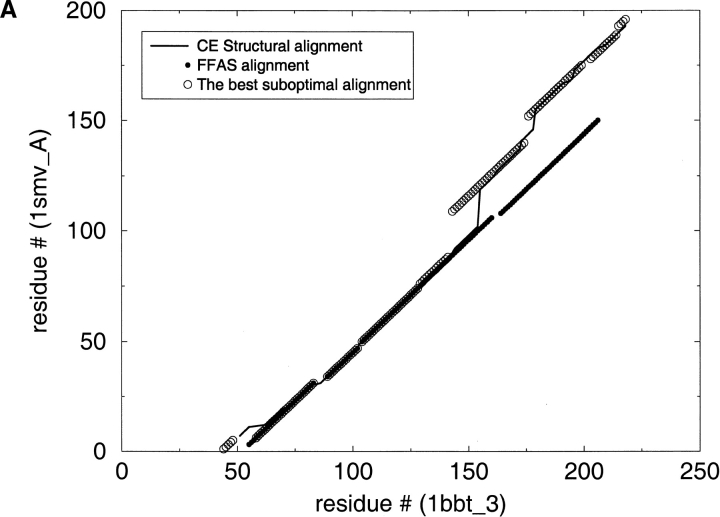
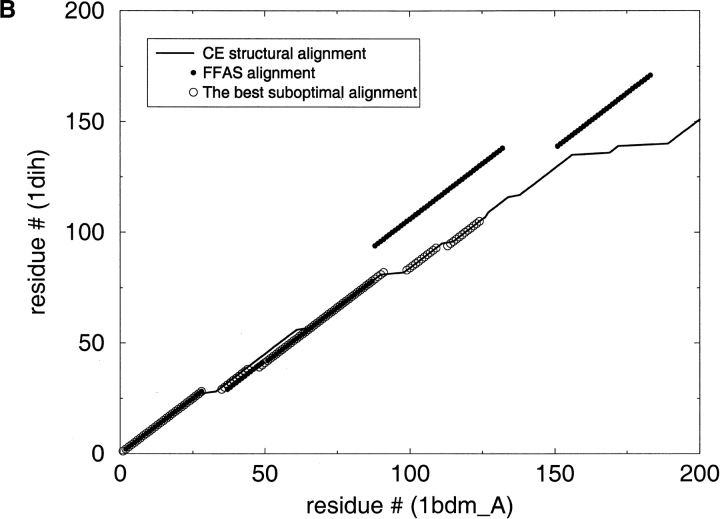
In the second computational experiment, we compared the parametric, iterative, and hybrid method of calculation of suboptimal alignments in terms of how many alignments they generated and the percentage of significantly improved alignments. These results indicate that the iterative method is less efficient than the parametric method: it yields a similar percent of improved alignments but only after testing many more suboptimal alignments (Table 3). The hybrid method turned out to be superior in efficiency. The significant gain from linking iterative and parametric methods is connected to the fact that each component method explores a different subset of alignments (for example, see Fig. 4 ▶). The application of the hybrid method to example pairs of distant homologs is shown in Figure 5 ▶.
Table 3.
The effectiveness of calculating suboptimal alignments using different methods
| The method of alignment calculation | % Alignments significantly improved | Average number of alignments | Maximum number of alignments | Minimum number of alignments |
| Parametric method | 34 | 49 (34) | 138 | 1 |
| Iterative method | 35 | 275 (130) | 469 | 25 |
| Hybrid method | 48 | 733 (300) | 2210 | 131 |
Only the results for the moderate similarity range (FFAS z-score 14–7) are shown. Values of variance are given in parentheses.
Fig. 4.
The subsets of suboptimal alignments as explored with the parametric method (circles) and the iterative method (dots). In addition, CE structural alignment is shown (black line).
Fig. 5.
Applying the suboptimal alignment calculations. This graph illustrates the discrepancies between the original FFAS alignments and the CE structural alignments. The best suboptimal alignment is also shown in the graph. (A) 1bbt is foot-and-mouth disease virus protein; 1smv is sesbania mosaic virus coat protein. (B) 1bdm is malate dehydrogenase; 1dih is dihydrodipicolinate reductase.
In the next computational experiment, we separately evaluated the effectiveness of the hybrid method for the different ranges of the FFAS z-score. It is clear that improving the suboptimal alignment search strongly depends on the similarity of a given protein pair (Table 4). The percentage of improved alignments by the best hybrid method decreased with an increasing FFAS z-score. For the most similar protein pairs (FFAS z-score higher than 14.0), we found better suboptimal alignments in only 34% of cases. For the least similar protein pairs (FFAS z-score lower than 2.0), a better alignment was found in 78% of cases, but these improved alignments were often inaccurate (average RMSD of 9.5). We have concluded that this suboptimal alignment search has the greatest practical potential in the region of moderate similarity: protein pairs with FFAS z-scores between 14 and 7. Alignments in this region are better in a reasonable percentage of the cases and are fairly accurate. We should note the very high diversity of the accuracy of calculated alignments as illustrated by high values of variance for all alignment accuracy measures. The general improvement of alignment accuracy achieved by suboptimal alignment exploration is unquestionable, because it was observed for all similarity ranges and tested with different criteria, but it is quite difficult to predict the improvement of the alignment accuracy for a particular protein pair.
Table 4.
The effectiveness of the suboptimal alignment search by hybrid method
| Average Improvement | |||
| Benchmark subset | % Alignments improved | RMSD (Å) | CMO (%) |
| High similarity | 34 | 6.2 (1.5) to 4.8 (1.4) | 52 (6) to 56 (7) |
| Moderate similarity | 48 | 9.1 (2.3) to 6.5 (1.7) | 36 (8) to 40 (4) |
| Low similarity | 65 | 12.3 (1.9) to 8.7 (1.9) | 26 (9) to 33 (5) |
| Undetectable similarity | 78 | 13.7 (2.0) to 9.5 (2.1) | 19 (11) to 27 (11) |
The average improvement of RMSD and CMO. Values of variance are given in parentheses. (RMSD) Root mean square deviation; (CMO) contact map overlap.
Discussion
We have previously shown that the FFAS z-score is a good estimate of the alignment accuracy and profile–profile similarity (Jaroszewski et al. 2000), and in general for this and other methods statistical significance of the alignment correlates well with its accuracy. In this article, we used this parameter to divide our alignment-accuracy benchmark into subsets corresponding with different similarity ranges. We showed that the methods for generating suboptimal alignments are most useful for protein pairs of moderate and low sequence similarity.
We tested three simple methods for generating suboptimal alignments and evaluated the effectiveness and efficiency of their suboptimal alignment space explorations. The most efficient methods were the parametric methods relying on the variation of protein–protein similarity scoring functions. The iterative elimination methods based on the single protein–protein similarity matrix required calculation of many more alignments to yield comparable results. The possible explanation of this is that there are several different types of similarity between distantly related pairs and various gap parameters and substitution matrices are optimized for different similarity types. For this reason, applying several of the combinations gives us a better chance of finding the right one.
The hybrid method encompassing the threading similarity function variation and the iterative elimination yielded better suboptimal alignment for many more protein pairs than for each of its components. These two approaches are apparently not redundant and there is a significant gain from constructing a hybrid method, because the methods explore different alignment space regions (for example, see Fig. 4 ▶).
In this article, we ascertained the possibility of obtaining a relatively small set of the alignments that contains at least one significantly better alignment. The issue of how to select this alignment is of great practical importance, but was not addressed here. There is strong evidence that recognizing the correct alignment is possible by building a protein model and evaluating it (Saqi et al. 1992; Pawlowski et al. 1997; Jaroszewski et al. 1998a). At this stage of model building, additional 3D constraints are imposed; these constraints are not present in the sequence–sequence or profile–profile similarity function. Moreover, protein models may be evaluated with energy-like functions, which do not apply directly to the alignments. Several advanced algorithms for evaluating protein models are in the literature (Chiche et al. 1990; Matsuo et al. 1995; Eisenberg et al. 1997; Golovanov et al. 1999; Petrey and Honig 2000). Further developing strategies for generating suboptimal alignments and for evaluating the resulting models is the subject of our ongoing research.
The accuracy of the best suboptimal alignment is decisive for the success of the protocol described earlier, because existing model evaluation tools work best in the conformational region close to the native structure. We can therefore succeed in determining the optimal model, if we can obtain at least one reasonably accurate alignment out of a relatively small set of alternative alignments.
The most important conclusion of this article is that one has much better chance of finding better alignment by applying several protein–protein similarity functions to a given protein pair than by iterative elimination of the alternative alignments using one protein–protein similarity function.
Materials and methods
The benchmark
The benchmark used here consists of 742 protein pairs selected from the SCOP database (Murzin et al. 1995) clustered at the 45% sequence identity threshold. Each protein pair shares at least one similar domain as identified by SCOP; entire proteins were included to make the test more realistic (before structures are known, we do not know the extent of the domains). We used the SCOP fold, superfamily, and family similarity levels to divide the benchmark pairs into groups of 108, 225, and 409 protein pairs, respectively. To avoid biasing the results by the few most popular folds, we selected only one protein pair to represent each fold type at a given similarity level. A similar benchmark was previously used to assess and compare fold-prediction algorithms (Rychlewski et al. 2000). The list of all benchmark pairs is available from our WWW server http://bioinformatics.burnham-inst.org/benchmarks.
The effectiveness of methods aimed toward improving alignments strongly depends on the accuracy of the initial alignment, which here is performed with the FFAS algorithm (Rychlewski et al. 2000). We have shown that the accuracy of the FFAS alignment is strongly correlated with the value of the FFAS z-score (Jaroszewski et al. 2000), which itself strongly correlates with the reliability of the prediction. This is true for FFAS alignments, but anecdotal evidence suggests that this is true for all alignment methods. In other words, better fold-recognition usually implies better alignment.
The benchmark was divided into four subsets of protein pairs corresponding to different FFAS z-score ranges (see Table 1). For FFAS z-scores higher than 14, the alignments are in most cases quite accurate. In the FFAS z-score region between 14 and 7, it is usually possible to pick up the protein pair from the database, but the accuracy of the alignment may be quite low; the methods described in this article may improve the alignment. In the range between 7 and 2, the similarity is often too low to select the correct template protein structure from the database; however, if the template's structure can be identified with other considerations, the accurate alignment can be obtained. For FFAS z-scores lower than 2, even the most sensitive methods cannot detect any similarity between protein sequences.
Evaluating the effectiveness of suboptimal alignment calculation methods
Our goal is to obtain a set of acceptably accurate alignments after considering only a manageably small number of the possible suboptimal (alternative) alignments. In other words, the goal is to effectively explore the alignment space. We can describe the effectiveness of the search by the accuracy of the best suboptimal alignment and the total number of alignments that must be tested before a significantly better alignment is found. Therefore, our criterion for the method's effectiveness is the percent of benchmark pairs in which a suboptimal alignment of significantly better accuracy was found. "Significantly better accuracy" was defined as follows: alignment RMSD at least 25% lower than the RMSD of the original alignment with the same or greater CMO or alignment CMO at least 25% higher than the CMO of the original alignment with the same or lower RMSD. The parameters of each method were optimized by grid search to maximize the number of protein pairs in which significantly better alignment accuracy was achieved.
Enumerating all possible alignments in the simplified alignment space
The comprehensive method for analyzing alignment space would be the complete enumeration of all possible alignments; this is not practically possible or necessary because we can impose some limits on the size of the search space by using known features of protein structures. This simplified space is based on a well-known fact: mutations in loop regions are much more tolerated than in a protein's core. We therefore assumed that there were no gaps within the template's secondary structure elements. The space was further simplified by excluding the less reliable calculations of alignments in the loop fragments. These assumptions made it possible to enumerate all possible alignments for a pair of medium-sized proteins. In this simplified description, alignment enumeration always yielded one alignment identical to the structural one. The enumeration of all possible alignments gave us two interesting values: an estimate of the alignment space's size (the total number of alignments), and a rough estimate of the distance between the structural alignments and the best-scoring alignments, as measured by the number of alignments with scores better than the scores for the structural alignments.
The last value roughly describes the difficulty of reaching the structural alignment. The distance from the best-scoring alignments to the structural alignments for our protein pairs is shown in Table 2.
The iterative elimination method
An elegant method for calculating suboptimal alignments was proposed by Saqi and Sternberg in 1991. The algorithm was based on a standard sequence–sequence similarity calculated with a substitution matrix and by a modified dynamic programming protocol. The sequence–sequence similarity matrix was calculated by using a standard substitution matrix. Standard dynamic programming was used to obtain the best-scoring alignment. The matrix is then modified to "penalize, but not eliminate, the equivalencing of residues" obtained from the first alignment (Saqi and Sternberg 1991). More precisely, the previously obtained alignment is penalized by adding small values to similarity matrix cells, which were included in this alignment, and after calculating the next alignment it is penalized again in the similarity matrix and the procedure is repeated. This algorithm yields a set of alignments that differ significantly from the best-scoring alignment. The crucial parameter of this algorithm is the value of Δ, which is added to the similarity matrix cells "visited" by the previous alignments. Smaller values of Δ allow a more complete exploration of suboptimal alignments but at a higher computational cost.
As recommended in the literature (Saqi and Sternberg 1991), the value of the Δ parameter was set to 1/4 of the average absolute value of the similarity matrix terms. This value was then decreased until it was observed that the best suboptimal alignment no longer improved. Similarly, the number of iterations was increased until no further improvement of the benchmark results was detected. The accuracy of the best alignment yielded by the method stabilized at a Δ equal to 0.01 and 1000 iterations.
The parametric method
The "parametric approach" to generating suboptimal alignments is based on observations that different gap penalty parameters (Waterman et al. 1992), substitution matrices (Pawlowski et al. 1997; Jaroszewski et al. 1998a), and threading algorithms usually yield different alignments for distantly related proteins.
In our implementation, the method generated a set of suboptimal alignments for a given sequence and the template structure selected from the Protein Data Bank (PDB) database. After calculating the initial alignment based on the FFAS profile–profile algorithm, the similarity matrix of the two proteins was recalculated using different combinations of profile–profile and threading terms. The result of this procedure is a set of alignments that emphasize different aspects of sequence-structure matching.
 |
(1) |
where:
Simi,j is the similarity matrix term for the query residue number i and template residue number j.
Pi,j is the FFAS profile–profile matching term (Rychlewski et al. 2000) for the query residue number i and target residue number j.
Bi,j is the burial term adopted from the threading algorithm (Jaroszewski et al. 1998b).
β is the weight of the threading term.
Li,j is the local structure propensity term adopted from the threading algorithm (Jaroszewski et al. 1998b).
λ is the weight of the local structure propensity term.
For each combination of profile–profile and threading terms, a set of alignments was calculated using several gap-penalty parameters. The rationale was that there is no one ideal pair of gap-penalty parameters suitable for all protein families; therefore, we increased the chance of getting the correct alignment by applying several gap-penalty parameters.
We increased the number of applied weights of threading terms and gap penalties until we observed no further improvement of the best suboptimal alignment. The optimal number of applied weights was surprisingly low. In other words, the testing of a few threading parameters yielded a significant number of alignments that were more accurate than the original FFAS alignment; testing more parameter values did not improve these alignments.
The optimal set of threading term weights was: (0, ⅓, ⅔,1) for β and (0, ⅓, ⅔, 1) for λ. The optimal set of gap penalties were (0, 3, 6, 9) for the gap-opening parameter and (0, ⅓, ⅔, 1) for the gap-extension parameter. Thus the method used 4×4×4×4 = 256 parameter sets. The number of different alignments generated by the method were often significantly lower because many parameter sets yielded identical alignments.
A hybrid method
A hybrid method was constructed by combining the parametric method with the iterative method: the iterative elimination was applied to each parameter set generated by the parametric approach. The best alignment scoring was calculated for each set of threading energy weights and gap penalties; then the best scoring alignment was "penalized" by adding small values to the similarity matrix's cells, which were then "visited" by this alignment. The best scoring alignment was then found for such a modified similarity matrix and the process was repeated. The parameters were adopted from optimized parametric and iterative methods, so that the maximal number of suboptimal alignments generated is the product of the 1000 iterations and the 256 combinations of weights and gap penalties. In fact, many of the alignments are identical, so that the average number of alternative alignments that was generated by hybrid method was 733 (see Table 3). For our comprehensive benchmark, the maximal number of alignments generated with this method did not exceed 2500 and always exceeded 100 (see Table 3). Within this range, the number of suboptimal alignments generated for protein pairs is quite diverse, as indicated by high values of its variance.
Acknowledgments
Our research was supported by NIH grant R01 GM60049. The authors are grateful to Drs. Krzysztof Fidelis and Adam Zemla for help in analyzing the CASP4 results illustrated in this article.
The publication costs of this article were defrayed in part by payment of page charges. This article must therefore be hereby marked "advertisement" in accordance with 18 USC section 1734 solely to indicate this fact.
Article and publication are at http://www.proteinscience.org/cgi/doi/10.1110/ps.4820102.
References
- Altschul, S.F., Madden, T.L., Schaffer, A.A., Zhang, J., Zhang, Z., Miller, W., and Lipman, D.J. 1997. Gapped BLAST and PSI-BLAST: A new generation of protein database search programs. Nucleic. Acids Res. 25 3389–3402. [DOI] [PMC free article] [PubMed] [Google Scholar]
- Berman, H.M., Bhat, T.N., Bourne, P.E., Feng, Z., Gilliland, G., Weissig, H., and Westbrook, J. 2000. The Protein Data Bank and the challenge of structural genomics. Nat. Struct. Biol. 7 957–959. [DOI] [PubMed] [Google Scholar]
- Burley, S.K., Almo, S.C., Bonanno, J.B., Capel, M., Chance, M.R., Gaasterland, T., Lin, D., Sali, A., Studier, F.W., and Swaminathan, S. 1999. Structural genomics: Beyond the human genome project. Nat. Genet. 23151–157. [DOI] [PubMed] [Google Scholar]
- CASP4. Fourth Meeting on the Critical Assessment of Techniques for Protein Structure Prediction. 2000. Asilomar, Pacific Grove, CA.
- Chiche, L., Gregoret, L.M., Cohen, F.E., and Kollman, P.A. 1990. Protein model structure evaluation using the solvation free energy of folding. Proc. Natl. Acad. Sci. 87 3240–3243. [DOI] [PMC free article] [PubMed] [Google Scholar]
- Eisenberg, D., Luthy, R., and Bowie, J.U. 1997. VERIFY3D: Assessment of protein models with three-dimensional profiles. Methods Enzymol. 277 396–404. [DOI] [PubMed] [Google Scholar]
- Godzik, A. 1996. The structural alignment between two proteins: Is there a unique answer? Protein Sci. 51325–1338. [DOI] [PMC free article] [PubMed] [Google Scholar]
- Godzik, A., Kolinski, A., and Skolnick, J. 1992. Topology fingerprint approach to the inverse protein folding problem. J. Mol. Biol. 227 227–238. [DOI] [PubMed] [Google Scholar]
- Godzik, A., Skolnick, J., and Kolinski, A. 1993. Regularities in interaction patterns of globular proteins. Protein Eng. 6 801–810. [DOI] [PubMed] [Google Scholar]
- Golovanov, A.P., Volynsky, P.E., Ermakova, S.B., and Arseniev, A.S. 1999. Recognizing misfolded and distorted protein structures by the assumption-based similarity score. Protein Eng. 12 31–40. [DOI] [PubMed] [Google Scholar]
- Holm, L., Ouzounis, C., Sander, C., Tuparev, G., and Vriend, G. 1992. A database of protein structure families with common folding motifs. Protein Sci. 1 1691–1698. [DOI] [PMC free article] [PubMed] [Google Scholar]
- Jaroszewski, L., Pawlowski, K., and Godzik, A. 1998a. Multiple model approach: Exploring the limits of comparative modelling. J. Mol. Model 4 294–309. [Google Scholar]
- Jaroszewski, L., Rychlewski, L., Zhang, B., Godzik, A. 1998b. Fold prediction by a hierarchy of sequence, threading, and modeling methods. Protein Sci. 7 1431–1440. [DOI] [PMC free article] [PubMed] [Google Scholar]
- Jaroszewski, L., Rychlewski, L., and Godzik, A. 2000. Improving the quality of twilight-zone alignments. Protein Sci. 9 1487–1496. [DOI] [PMC free article] [PubMed] [Google Scholar]
- Jones, D.T. 1999. GenTHREADER: An efficient and reliable protein fold recognition method for genomic sequences. J. Mol. Biol. 287 797–815. [DOI] [PubMed] [Google Scholar]
- Jones, T.A. and Kleywegt, G.J. 1999. CASP3 comparative modeling evaluation. Proteins S3 30–46. [DOI] [PubMed] [Google Scholar]
- Kabsch, W. 1978. A discussion of the solution for the best rotation to relate two sets of vectors. Acta Crystallogr. 34 827–828. [Google Scholar]
- Matsuo, Y., Nakamura, H., and Nishikawa, K. 1995. Detection of protein 3D-1D compatibility characterized by the evaluation of side-chain packing and electrostatic interactions. J. Biochem. (Tokyo) 118 137–148. [DOI] [PubMed] [Google Scholar]
- Mevissen, H.T. and Vingron, M. 1996. Quantifying the local reliability of a sequence alignment. Protein Eng. 9 127–132. [DOI] [PubMed] [Google Scholar]
- Murzin, A.G., Brenner, S.E., Hubbard, T., and Chothia, C. 1995. SCOP: A structural classification of proteins database for the investigation of sequences and structures. J. Mol. Biol. 247 536–540. [DOI] [PubMed] [Google Scholar]
- Naor, D. and Brutlag, D.L. 1994. On near-optimal alignments of biological sequences. J. Comput. Biol. 1 349–366. [DOI] [PubMed] [Google Scholar]
- Needleman, S.B. and Wunsch, C.D. 1970. A general method applicable to the search for similarities in the amino acid sequence of two proteins. J. Mol. Biol. 48 443–453. [DOI] [PubMed] [Google Scholar]
- Orengo, C.A., Michie, A.D., Jones, S., Jones, D.T., Swindells, M.B., and Thornton, J.M. 1997. CATH—A hierarchic classification of protein domain structures. Structure 5 1093–1108. [DOI] [PubMed] [Google Scholar]
- Pascarella, S. and Argos, P. 1992. A data bank merging related protein structures and sequences. Protein Eng. 5 121–137. [DOI] [PubMed] [Google Scholar]
- Pawlowski, K., Jaroszewski, L., Bierzynski, A., and Godzik, A. 1997. Multiple model approach—Dealing with alignment ambiguities in protein modeling. Pac. Symp. Biocomput. 328–339. [PubMed]
- Pawlowski, K., Rychlewski, L., Zhang, B., and Godzik, A. 2001. Fold predictions for bacterial genomes. J. Struct. Biol. 134 219–231. [DOI] [PubMed] [Google Scholar]
- Pearson, W.R. and Lipman, D.J. 1988. Improved tools for biological sequence comparison. Proc. Natl. Acad. Sci. 85 2444–2448. [DOI] [PMC free article] [PubMed] [Google Scholar]
- Petrey, D. and Honig, B. 2000. Free energy determinants of tertiary structure and the evaluation of protein models. Protein Sci. 9 2181–2191. [DOI] [PMC free article] [PubMed] [Google Scholar]
- Rychlewski, L., Jaroszewski, L., Weizhong, L., and Godzik, A. 2000. Comparison of sequence profiles. Structural predictions with no structure information. Protein Sci. 8 232–241. [DOI] [PMC free article] [PubMed] [Google Scholar]
- Sanchez, R. and Sali, A. 1997. Advances in comparative protein-structure modelling. Curr. Opin. Struct. Biol. 7 206–214. [DOI] [PubMed] [Google Scholar]
- Saqi, M.A. and Sternberg, M.J. 1991. A simple method to generate non-trivial alternate alignments of protein sequences. J. Mol. Biol. 219 727–732. [DOI] [PubMed] [Google Scholar]
- Saqi, M.A., Bates, P.A., and Sternberg, M.J. 1992. Towards an automatic method of predicting protein structure by homology: An evaluation of suboptimal sequence alignments. Protein Eng. 5 305–311. [DOI] [PubMed] [Google Scholar]
- Shindyalov, I.N. and Bourne, P.E. 1998. Protein structure alignment by incremental combinatorial extension (CE) of the optimal path. Protein Eng. 11 739–747. [DOI] [PubMed] [Google Scholar]
- Sippl, M.J., Lackner, P., Domingues, F.S., Prlic, A., Malik, R., Andreeva, A., and Wiederstein, M. 2001. Assessment of the CASP4 fold recognition category. Proteins S5 55–67. [DOI] [PubMed] [Google Scholar]
- Smith, T.F. and Waterman, M.S. 1981. Identification of common molecular subsequences. J. Mol. Biol. 147 195–197. [DOI] [PubMed] [Google Scholar]
- Tomii, K. and Kanehisa, M. 1996. Analysis of amino acid indices and mutation matrices for sequence comparison and structure prediction of proteins. Protein. Eng. 9 27–36. [DOI] [PubMed] [Google Scholar]
- Tramontano, A., Leplae, R., and Morea, V. 2001. Analysis and assessment of comparative modeling predictions in CASP4. Proteins S5 22–38. [DOI] [PubMed] [Google Scholar]
- Vingron, M. and Argos, P. 1990. Determination of reliable regions in protein sequence alignments. Protein Eng. 3 565–569. [DOI] [PubMed] [Google Scholar]
- Vogt, G., Etzold, T., and Argos, P. 1995. An assessment of amino acid exchange matrices in aligning protein sequences: The twilight zone revisited. J. Mol. Biol. 249 816–831. [DOI] [PubMed] [Google Scholar]
- Waterman, M.S. 1995. Introduction to computational biology. Chapman & Hall, London.
- Waterman, M.S, Eggert M., and Lander, E. 1992. Parametric sequence comparisons. Proc. Natl. Acad. Sci. 89 6090–6093. [DOI] [PMC free article] [PubMed] [Google Scholar]
- Zemla, A., Venclovas, C., Moult, J., and Fidelis, K. 1999. Processing and analysis of CASP3 protein structure predictions. Proteins S3 22–29. [DOI] [PubMed] [Google Scholar]
- Zuker, M. 1991. Suboptimal sequence alignment in molecular biology. Alignment with error analysis. J. Mol. Biol. 221 403–420. [DOI] [PubMed] [Google Scholar]


