Abstract
The nematode Caenorhabditis elegans exhibits behavioral responses to many volatile odorants. Chemotaxis toward one such odorant, diacetyl (butanedione), requires the function of a seven-transmembrane receptor protein encoded by the odr-10 gene. To determine directly whether ODR-10 protein is an odorant receptor, it is necessary to express the protein in a heterologous system and show that it responds to diacetyl by activation of a G protein signaling pathway. Here we demonstrate that human cells expressing ODR-10 on their surfaces exhibit a transient elevation in intracellular Ca2+ levels after diacetyl application. Volatile compounds that differ from diacetyl only by the addition of a methyl group (2,3-pentanedione) or the absence of a keto group (butanone) are not ODR-10 agonists. Behavioral responses to these compounds are not dependent on odr-10 function, so ODR-10 specificity in human cells resembles in vivo specificity. The apparent affinity of ODR-10 for diacetyl observed in human cells is consistent with the diacetyl concentration ranges that allow efficient nematode chemotaxis. ODR-10 expressed in human cells also responds to two anionic compounds, pyruvate and citrate, which are metabolic precursors used for diacetyl production by certain bacterial species. Ca2+ elevation in response to ODR-10 activation is due to release from intracellular stores.
Keywords: olfaction, G protein-coupled receptor, signal transduction, chemotaxis
In both vertebrates and invertebrates, the olfactory system can detect hundreds or thousands of volatile odorants, yet is capable of discriminating between compounds that differ only slightly in chemical structure. Binding of odorants to receptors in the vertebrate olfactory epithelium is thought to activate adenylyl cyclase (AC) via a Gsα-like G protein (reviewed in ref. 1). The cAMP thus produced opens a cyclic nucleotide-gated cation channel that is required for all odorant responses in mice (2). The best candidates for mammalian odorant receptors are the members of a very large family (>500 genes) of olfactory-specific seven-transmembrane receptors (1, 3). These receptors have not been demonstrated to bind to odorants or to activate AC when expressed in heterologous cells, however.
Because it has only 32 chemosensory neurons and is accessible to genetic analysis, the soil nematode Caenorhabditis elegans provides a valuable system in which to define genes and proteins that control olfactory behavior. Chemotaxis to volatile attractants is mediated by two pairs of ciliated neurons, AWA and AWC (4). A cyclic nucleotide-gated channel is required for volatile odorant responses mediated by AWC but not for those controlled by AWA (5, 6). Like vertebrates, C. elegans has a large repertoire (>100 genes) of seven-transmembrane receptors expressed in chemosensory neurons (7).
Mutations in the nematode odr-10 gene affect chemotaxis toward only one volatile odorant, diacetyl (butanedione) (8). Diacetyl is produced as an end product of fermentation by bacteria that can serve as a food source for the nematode. The ability to respond to diacetyl and other volatile metabolites provides a mechanism for long-range detection of bacterial populations. Attractive responses to diacetyl are mediated by the AWA neuron, whereas the responses to two closely related odorants, butanone and 2,3- pentanedione, require AWC function and are unaffected by ablation of AWA (8) (P. Sengupta and C.I.B., unpublished results).
The odr-10 gene encodes a seven-transmembrane domain protein that is distantly related to the G protein-coupled receptor superfamily. odr-10 is expressed only in the AWA neurons, and an ODR-10 fusion protein localizes to the distal cilia of the AWA dendrites where odorant detection is thought to occur (8). These results suggest that ODR-10 could selectively interact with diacetyl from the external environment and activate a G protein in response to diacetyl binding. Because AWA function is not dependent on the cyclic nucleotide-gated channel, ODR-10 might be expected to couple to a different signaling pathway than that used by vertebrate odorant receptors.
Alternative models could also explain these genetic data. For example, ODR-10 could bind to a number of structurally related odorants, but behavioral responses to compounds other than diacetyl might be suppressed by mechanisms downstream of the receptor. To distinguish between these models requires a functional assay in which ODR-10 specificity can be directly evaluated. Here we show that ODR-10 expressed in human cells can activate a G protein signaling pathway leading to release of Ca2+ from intracellular stores. Our results indicate that ODR-10 is indeed a diacetyl-specific odorant receptor.
MATERIALS AND METHODS
Molecular Biology.
A full-length odr-10 cDNA was inserted into pCS2 cytomegalovirus (CMV) promoter expression vectors. In the Myc-ODR-10 plasmid, the ODR-10 coding sequence was inserted immediately 3′ to a sequence encoding six copies of a 13-residue c-myc epitope in the vector pCS2+MT (9). The epitope-tagged β2-adrenergic receptor (HA-β2AdR) sequence is in pcDNAI/amp (Invitrogen), and the plasmid contains one copy of the 12CA5 influenza hemagglutinin (HA) epitope at the N terminus of β2AdR.
Cell Culture and Immunofluorescence.
HEK293 cells were maintained in a high glucose medium (GIBCO) with 10% fetal calf serum and lacking pyruvate. Cells were plated onto poly-d-lysine-coated 15-mm glass coverslips in 35-mm tissue culture dishes 24 hr before transfection. Lipofectamine (GIBCO) was used as the DNA carrier. Two micrograms of plasmid DNA (ODR-10 plasmids or control plasmid vectors) was added to each culture dish. The cells were incubated with the mixture for 10 hr at 37°C. Two days after transfection, cells were fixed and permeabilized with methanol at −20°C for 20 min. Anti-c-myc (Oncogene Sciences; 9E10) and anti-HA (Boehringer Mannheim; 12CA5) mAbs were used at 1:1,000 and 1:200 dilutions, respectively. Fluorescein isothiocyanate (FITC)-conjugated secondary antibody (Jackson ImmunoResearch) was used at a 1:200 dilution. Staining and visualization were carried out according to standard procedures.
Flow Cytometry.
For flow cytometry, cells were grown on 10-cm tissue culture plates and transfected as described above. For each plate, 16 μg of plasmid DNA was used. The control vector in the experiment of Fig. 1 was pCS2-CMV-lacZ. The transfected cells were gently washed off the plate after incubation in divalent-free Hanks’ balanced salt solution (HBSS; GIBCO). The solution was supplemented with 2.5 mg/ml BSA, 5 mM NaN3, 250 μg/ml DNase, and 0.5 mM EDTA. The cells were counted, spun down, and resuspended in the above HBSS buffer with divalents to allow DNase digestion. The secondary antibody was a phycoerythrin-conjugated goat anti-mouse IgG (Caltag, South San Francisco, CA). After staining, the cell suspensions were washed and filtered through a fine nylon mesh and incubated in HBSS at 2 × 10⁶ cells per ml. Cells were analyzed on a Coulter Epics Elite flow cytometer with an argon laser exciting at 488 nm (15 mW).
Figure 1.
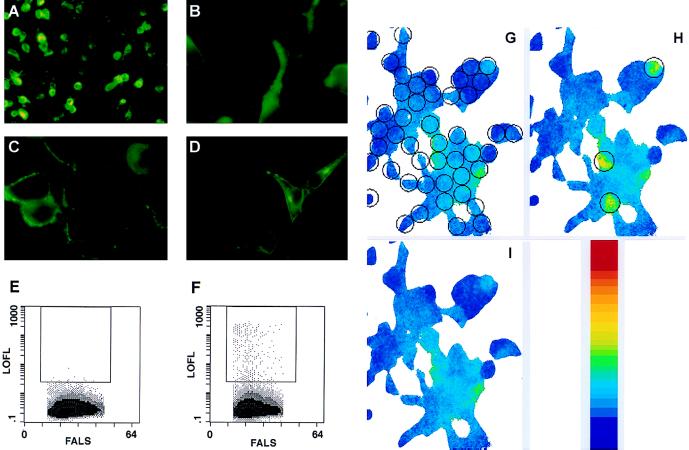
ODR-10 expression and function in human cells. For immunofluorescence, the primary antibodies were mAbs against the Myc and HA epitopes, and the secondary antibody was a FITC-conjugated goat anti-mouse IgG (green). The yellow color is due to exposure saturation. (A) Myc-ODR-10-transfected HEK293 cells, low power (200×). (B) Myc-ODR-10-transfected cells, 630×: cytoplasmic fluorescence. (C) Myc-ODR-10-transfected cells, 630×: perimeter fluorescence. (D) HA-β2AdR-transfected cells, 630×. (E and F) Two-dimensional dot plots of flow cytometry measurements. The rectangular boxes enclose dots representing cell populations that display surface Myc epitope expression at levels above an arbitrarily defined threshold. Each cytogram compiled data from 100,000 cells identified as viable by forward and 90° light scatter. The different texture levels (from lightest to darkest) indicate threefold increases in frequency. LOFL, log orange fluorescence level; FALS, forward angle light scatter. (E) Control vector-transfected cells (<0.01% of cell population was Myc-positive above threshold). (F) Myc-ODR-10-transfected cells (0.3% of cell population was Myc-positive above threshold in this experiment). (G–I) Images of Ca2+ measurements for a group of cells that were transiently transfected with wt ODR-10 plasmid. The graded color bar is a calibration of the imaging system. The red color in the calibration bar indicates the highest Ca2+ level measured by the imaging system. The open circles in G indicate all of the areas used for data analysis. Open circles in H indicate the three areas (cells) in the field that exhibited diacetyl responses. (G) Prior to diacetyl perfusion. (H) Three minutes after onset of a 1-min application of 10 μM diacetyl. (I) Seven min after the onset of diacetyl application.
Fura-2 Ca2+ Imaging.
Approximately 48 hr after transfection, cells were incubated for 45 min at 37°C in a loading buffer (pH 7.4) containing 140 mM NaCl, 3 mM KCl, 10 mM Hepes, 10 mM glucose, 2 mM CaCl2, 0.005 mM Fura-2-AM (Molecular Probes), and 0.1% Pluronic F-127. The cells were then incubated for another 1.5 hr at room temperature before washing. The loaded coverslips were mounted onto a microimaging chamber (RC21A, Warner Instruments, Hamden, CT). The bath volume of the chamber was 150 μl. Bath perfusion and drug delivery were controlled by an automated solenoid valve controller (AutoMate Science, Oakland, CA). The solution exchanging time was about 5 sec. Diacetyl, butanone, 2,3-pentanedione, acetoin, pyrazine, and the anionic compounds were all dissolved in water and diluted into loading buffer. Hydrophobic odorants were dissolved in dimethyl sulfoxide, mixed into pools, and sonicated into loading buffer (final concentration = 5 μM each; names of tested odorants are available from the authors on request).
The imaging chamber was mounted on top of a Zeiss Axiovert-10 inverted microscope, and a Zeiss Plan-Neofluar 40× oil immersion objective lens was used. Samples were illuminated by a 75-W xenon bulb, and a computer-controlled filter changer (Lambda-10; Sutter Instruments, Novato, CA) was used to switch the excitation wavelength. An intensified CCD camera (Hamamatsu, Ichinocho, Japan) was used in detecting fluorescence. Images were acquired at 5- or 10-sec intervals and analyzed with VideoProbe system (ETM Systems, Irvine, CA) hardware and software. All cells within a field were selected (circled) and analyzed (see Fig. 1G for examples), and up to 20% of circled cells might exhibit odorant responses. Instrument calibration was carried out with standard Ca2+ solutions (Molecular Probes) in custom-made microglass chambers that were 150 μm deep and 3 mm2 in area.
RESULTS
Expression of ODR-10 on the Surfaces of Transfected Human Cells.
To evaluate ODR-10 expression, we transfected mammalian cells with a plasmid encoding an ODR-10 protein with a Myc epitope tag at its N terminus, which should be exposed at the external face of the plasma membrane. Myc-ODR-10 was expressed at high levels in about 30% of transiently transfected human HEK293 cells (Fig. 1A). In the majority of expressing cells, the protein appeared to be cytoplasmic, although staining extended to the cell perimeters (Fig. 1B). Some cells, however, exhibited bright fluorescence around their perimeters with little cytoplasmic staining (Fig. 1C). This localization pattern is similar to that observed for HA-β2AdR expressed in transfected HEK293 cells (Fig. 1D).
To determine whether Myc-ODR-10 could reach the surface of transiently transfected human cells, we used flow cytometry to measure Myc epitope expression on live cells. About 0.3–1.0% of total cells assayed displayed Myc-ODR-10 on their surfaces at levels that were well above the fluorescence background observed with vector-transfected cells (Figs. 1 E and F). Expression of Myc-ODR-10 at the cell surface is inefficient by comparison to HA-β2AdR, for which >8% of total cells assayed exhibited high-level surface expression (data not shown). Unhealthy or otherwise antibody-permeable cells do not account for the apparent surface Myc expression seen in Fig. 1F, because HEK293 cells expressing several different Myc-tagged vertebrate olfactory receptors did not stain for surface Myc when assayed by flow cytometry (data not shown). These and other data indicate that expression of Myc-tagged receptors does not induce permeability to antibodies.
Our results also indicate that immunofluorescent staining of cell perimeters cannot be used as a criterion for surface expression, because the percentage of cells that actually express surface Myc as measured by flow cytometry is much lower than the percentage showing staining extending out to the perimeter. This is true even if only cells with weak cytoplasmic staining (as in Fig. 1C) are considered.
ODR-10 Mediates Ca2+ Elevation in Response to Diacetyl Application.
To assay ODR-10 function, we measured intracellular Ca2+ levels in ODR-10-expressing cells using fura-2-based Ca2+ imaging. Upon perfusion of diacetyl (10 μM) onto HEK293 cells transfected with plasmids encoding wild-type (wt) ODR-10 or Myc-ODR-10, a transient increase in intracellular Ca2+ was observed in a fraction of the cells (Fig. 1 G–I). Such responses were never seen in vector-transfected or untransfected cells. They were also not observed in cells expressing the muscarinic M1 acetylcholine receptor (M1AChR), which couples efficiently to release of Ca2+ from intracellular stores.
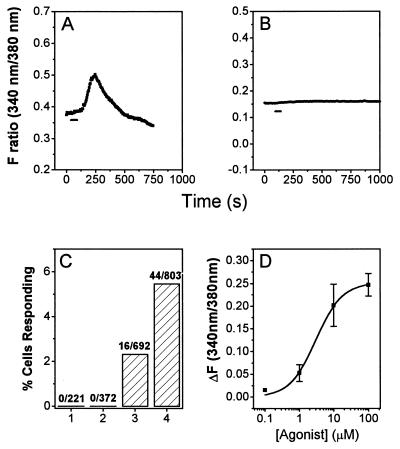
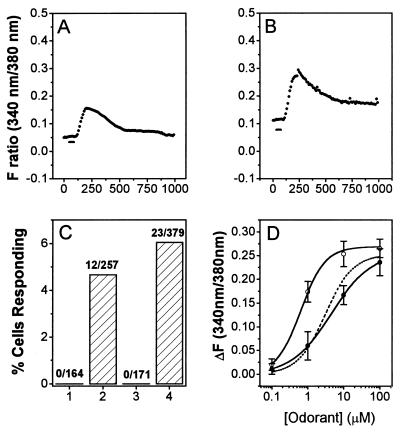
Fig. 2 shows graphs of time-dependent changes in intracellular Ca2+, each averaged over 10 or more responding cells. The Ca2+ elevation response was maximal about 3 min after the onset of diacetyl application and decayed within 4 min (Fig. 2A). These kinetics are considerably slower than those observed for the M1AChR response to acetylcholine (ACh; Fig. 4D). Basal Ca2+ levels in populations of ODR-10 plasmid or vector-transfected cells varied between 50 and 150 nM. A 10% change in fluorescence intensity ratio corresponds to an increase of about 100 nM in Ca2+ concentration, and the highest Ca2+ concentration attained during the diacetyl response in a typical experiment was about 300 nM. Due to the inaccuracy inherent in calibrating the Ca2+ imaging system between different populations of transfected cells, we report here fluorescence ratios rather than estimated Ca2+ concentrations.
Figure 2.
Characterization of diacetyl responses in ODR-10-expressing HEK293 cells. A and B are plots of changes in fluorescence intensity ratios (340 nm/380 nm). Each plot represents an average of measurements from more than 10 individual cells. The images were collected at 5-sec intervals (represented by individual points). The duration of odorant perfusion (1 min) is marked by a horizontal bar. (A) Ten micromolar diacetyl, wt ODR-10-transfected cells. (B) Ten micromolar diacetyl, control vector-transfected cells. (C) Bar graph of numbers and percentages of cells responding to 10 μM diacetyl. (D) Diacetyl dose–response relation. Each symbol represents the average of measurements from >10 single cells from the same transfection. Error bars (SD) are also indicated. The line is a fit to the Hill equation. The calculated EC50 value from the Hill equation is 2.25 ± 0.53 μM, and the Hill coefficient is 1.12.
Figure 4.
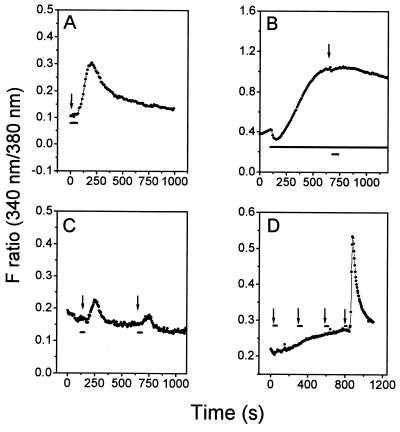
ODR-10 signaling and desensitization. Symbols and markers have the same meaning as in Fig. 2. The starting point of agonist application is indicated by arrows. Images were collected at 10-sec intervals. (A) Ten micromolar citrate, wt ODR-10-transfected cells in Ca2+-free extracellular solution. (B) Ten micromolar citrate, wt ODR-10-transfected cells treated with 10 mM caffeine. Caffeine was present before and after odorant application (long horizontal bar). Identical results were observed for diacetyl and pyruvate (10 μM; data not shown). (C) ODR-10 desensitization by low concentrations of diacetyl. Diacetyl (1 μM) was applied at 120 and 620 sec. The cells were continuously washed between diacetyl applications. (D) Effects of odorants on M1AChR-mediated Ca2+ elevation. Each arrow indicates application of a different odorant or agonist. The sequence of application was: butanone, 2,3-pentanedione, pyrazine (all at 10 μM), followed by ACh (20 μM). Diacetyl (10 μM) also had no effect on the ACh response (data not shown).
Ten micromolar diacetyl elicited transient increases in intracellular Ca2+ in ODR-10-transfected cells (Fig. 2 A and C) but never in vector-transfected, untransfected, or M1AChR-transfected cells (Figs. 2 B and C and 4D). The percentage of responding cells and the magnitude of the Ca2+ increases were higher in cells expressing wt ODR-10 (5.5%, n = 803; Fig. 2C) than in those expressing Myc-ODR-10 (2.3%, n = 692). Comparison of the percentage of Myc-ODR-10-transfected cells responding to diacetyl with the percentage expressing the Myc epitope on their surfaces suggests that cells that express Myc-ODR-10 at levels below the threshold required for separation from the untransfected population in a flow cytometric assay can still exhibit diacetyl responses in the fura-2 assay.
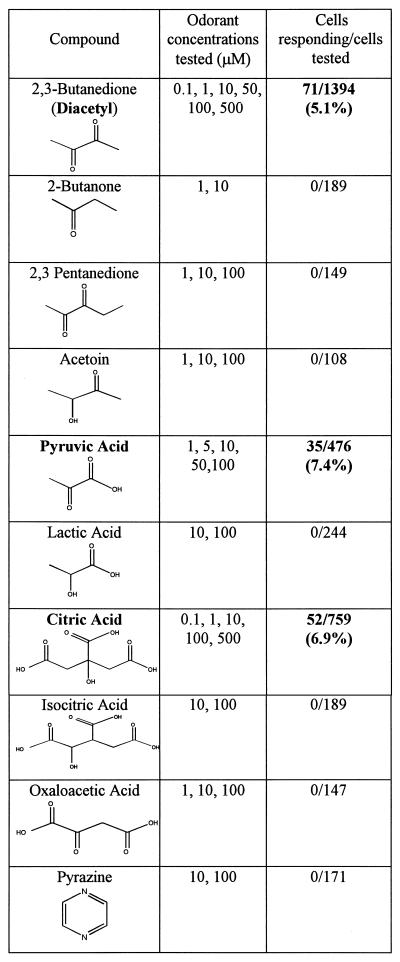
Dose-dependent responses to diacetyl were observed at concentrations of 0.1–100 μM (71/1394 wt ODR-10-transfected cells analyzed exhibited responses; Table 1). When the dose–response relationship was fitted to the Hill equation, it yielded an EC50 value of 2.3 ± 0.5 μM (Fig. 2D). The increase in Ca2+ saturates at about 100 μM diacetyl. odr-10 mutant worms respond normally to butanone and 2,3-pentanedione, which are sensed by AWC. They also respond to pyrazine, a structurally unrelated compound detected by AWA (8). None of these compounds produced a Ca2+ elevation response in ODR-10-expressing cells, even at 100 μM (Table 1). 3-Hydroxybutanone (acetoin) also did not elicit responses. We tested 44 other volatile odorants representing a variety of different chemical groups on ODR-10-expressing cell populations and found that none produced any receptor-dependent elevation in Ca2+ levels (data not shown).
Table 1.
Summary of odorant screening using Fura-2 Ca2+ imaging
Bold type identifies compounds that are agonists for ODR-10.
ODR-10 Responds to the Nonvolatile Compounds Pyruvate and Citrate.
We have been unable thus far to identify any volatile compound other than diacetyl that produces a Ca2+ elevation response in ODR-10-expressing HEK293 cells. In an effort to define another ODR-10 agonist, we also tested anionic compounds that are structurally related to diacetyl. We found that one such compound, pyruvate, produced Ca2+ elevation in ODR-10-expressing cells (35/476 cells analyzed; Table 1 and Fig. 3A) but never in vector-transfected cells (Fig. 3C). Pyruvate has a similar EC50 to diacetyl (3.2 ± 0.9 μM; Fig. 3D). Interestingly, diacetyl, which is an end product of fermentation in some species of bacteria, can be synthesized in two steps directly from pyruvate, using the enzyme diacetyl synthase. Diacetyl production is a specific signature for certain bacterial species, whereas acetoin is produced by almost all bacteria.
Figure 3.
ODR-10 responds to pyruvate and citrate. Symbols and markers have the same meaning as in Fig. 2. Images were collected at 10-sec intervals. (A) Ten micromolar pyruvate, wt ODR-10-transfected cells. (B) Ten micromolar citrate, wt ODR-10-transfected cells. (C) Bar graph of numbers and percentages of cells responding to pyruvate and citrate (10 μM). (D) Dose–response relations for pyruvate and citrate. The closed squares and open circles are data points for pyruvate and citrate, respectively. The calculated EC50 values from the Hill equation are 3.23 ± 0.9 μM for pyruvate and 0.34 ± 0.08 μM for citrate. The Hill coefficients are 0.9 and 1.28 for pyruvate and citrate, respectively. The dotted line shows the diacetyl dose–response relationship for comparison.
That ODR-10 responded to diacetyl and pyruvate, but not to the structurally related fermentation end products acetoin and lactate (Table 1), suggested that ODR-10 activation might be indicative of the presence of bacterial species that generate diacetyl via the diacetyl synthase pathway. The preferred substrate for pyruvate and diacetyl formation in some of these bacteria is citrate. Bacteria convert citrate to oxaloacetate and then to pyruvate under anaerobic conditions. In the presence of oxygen, citrate is preferentially isomerized to isocitrate by aconitase and enters the tricarboxylic acid cycle (10).
We tested whether other compounds in the diacetyl synthesis pathway might elicit ODR-10 responses and found that citrate is an agonist for ODR-10 (Fig. 3B; 52/759 cells analyzed). Again, citrate never induced Ca2+ elevation responses in vector-transfected cells (Fig. 3C). The EC50 for citrate (0.34 ± 0.08 μM) was lower than that for diacetyl itself (Fig. 3D). The citrate response is surprising, because citrate does not have a close structural relationship to diacetyl or pyruvate, and most citrate molecules bear three negative charges at neutral pH. It is specific, however, because isocitrate, which has the same negative charge distribution and differs only in the positioning of an −OH group, did not produce ODR-10 responses (Table 1).
ODR-10 Signaling and Desensitization in Human Cells.
To investigate the signaling pathway used by ODR-10 in human cells, we examined the origin of the Ca2+ signal detected in the imaging experiments. Eliminating extracellular Ca2+ had little effect on ODR-10-mediated increases in Ca2+ (Fig. 4A), suggesting that Ca2+ elevation is primarily due to release from intracellular stores. Internal Ca2+ stores whose release is mediated by G protein-coupled receptors are depleted by caffeine, which produces a slow increase in cytoplasmic Ca2+ as the stores are emptied. After caffeine treatment of transfected HEK293 cells, diacetyl, citrate, and pyruvate failed to elicit a further Ca2+ increase (Fig. 4B), suggesting that ODR-10 and caffeine affect similar calcium stores. Preincubation of transfected cells with pertussis toxin (PTX; 100 nM) had no effect on odorant-induced Ca2+ elevation (data not shown), indicating that ODR-10 is likely to couple to a PTX-resistant G protein. Although the activation of a human G protein by ODR-10 shows that the receptor is promiscuous in its coupling ability, the overall signaling mechanism used by ODR-10 may be similar in human cells and in C. elegans, because behavioral responses to diacetyl require a protein related to Drosophila Trp (11). Trp is required for rapid refilling of intracellular Ca2+ stores in fly photoreceptors (reviewed in ref. 12).
ODR-10 undergoes desensitization upon activation in HEK293 cells. When ODR-10 expressing cells were exposed to 1 μM diacetyl, a second application of diacetyl at the same concentration elicited a much smaller response (Fig. 4C). Higher concentrations of diacetyl, citrate, or pyruvate produced complete and long-lasting desensitization (data not shown). Diacetyl and other volatile odorants had no effect on subsequent ACh-induced release of Ca2+ from intracellular stores in cells expressing M1AChR (Fig. 4D).
DISCUSSION
In this paper, we have shown that the nematode seven-transmembrane domain protein ODR-10 functions as a receptor for the volatile odorant diacetyl (butanedione) when expressed in human HEK293 cells. ODR-10 responds to volatile odorants with high selectivity in human cells, and this selectivity resembles that observed for the behavioral response in vivo (8). In both systems, the receptor distinguishes between diacetyl and compounds that differ from it only by the presence of an extra methyl group (2,3-pentanedione) or by the absence of a keto group (butanone; Table 1).
The apparent affinity of ODR-10 for diacetyl observed in human cells (EC50 = 2.3 μM; Fig. 3D) is consistent with the diacetyl concentration ranges that allow efficient nematode chemotaxis. In volatile chemotaxis assays, odorant is spotted either on the surface of an agar plate or on the underside of the lid, and nematodes move across the agar and accumulate at or directly under the odorant source (4). The mean concentration of diacetyl in air in a typical assay is about 0.1 μM (J.H.C. and C.I.B., unpublished results). At this concentration of diacetyl in liquid, the ODR-10 response in 293 cells is about 5% of maximum (Fig. 2D; data not shown). The saturating concentration of diacetyl above which nematodes cannot follow a diacetyl gradient is about 100 μM, which corresponds approximately to the concentration required to saturate the response in 293 cells.
ODR-10 is very specific in its recognition of diacetyl as a ligand, and we were unable to identify any other volatile odorant that could serve as an ODR-10 agonist. We found that two anionic compounds, pyruvate and citrate, can function as ODR-10 agonists in human cells and that citrate has a lower EC50 (0.34 μM) than diacetyl (2.3 μM). Analyses of Ca2+ elevation responses in sections of olfactory epithelium show that a single mammalian olfactory receptor neuron can respond to volatile alcohols and to fatty acids, which are nonvolatile (anionic) at neutral pH (13). Thus, mammalian and invertebrate olfactory receptors can apparently interact with both volatile and nonvolatile compounds.
Although the pyruvate and citrate results are intriguing, there is no evidence at present indicating that a behavioral response to these compounds can be mediated by ODR-10. C. elegans exhibits chemotaxis to volatile pyruvic acid and soluble citrate, but these responses are also observed in odr-10 mutant worms. Moreover, the pyruvic acid response is dependent on AWC and not on AWA, so ODR-10 is unlikely to be one of several redundant receptors for this odorant (J.H.C. and C.I.B., unpublished results).
Pyruvic acid is an unusual odorant, because it exists in both neutral and anionic forms. In a volatile chemoattraction assay, pyruvic acid evaporating into the air would quickly set up two types of gradients: a pyruvic acid gradient in the air and a pyruvate gradient in the buffered agar. In principle, the worm might follow either of these gradients to reach the pyruvic acid source. That pyruvic acid chemotaxis is dependent on the volatile odorant receptor neuron AWC suggests that pyruvic acid is the species recognized by the worm during chemotaxis. In the 293 cell system, however, pyruvate is dissolved in a pH 7.4 buffer, in which the concentration of pyruvic acid is about 105-fold lower than that of pyruvate anion. This indicates that the ligand for ODR-10 in 293 cells is likely to be pyruvate rather than pyruvic acid.
Pyruvate and citrate cannot compete effectively with diacetyl for access to ODR-10 on AWA cilia, because diacetyl chemotaxis, which is completely blocked by 100 μM diacetyl in the agar, was unaffected when the agar contained 1.4 mM pyruvate or 5 mM citrate (J.H.C. and C.I.B., unpublished results). Thus, pyruvate and citrate are apparently less accessible to ODR-10 on AWA cilia than in human cells. Cilia that detect volatile odorants are encased within the amphid sheath cell, whereas neurons that sense water-soluble molecules are exposed at the tip of the nose (4, 14). One possibility is that AWA and AWC may not be able to interact efficiently with membrane-impermeable compounds such as the pyruvate and citrate anions. Alternatively, an accessory protein, posttranslational modification, or receptor conformation that affects the ability to respond to pyruvate and citrate could differ between ODR-10 expressed in HEK293 cells and ODR-10 C. elegans neurons.
Interestingly, pyruvate and citrate are direct biosynthetic precursors to diacetyl in bacteria, and citrate is the preferred carbon source used for diacetyl formation. Lactic acid bacteria generate diacetyl, which is the characteristic flavor of butter, from citrate in milk. Fungi such as Aspergillus, which produce very high levels of citrate and are used for its industrial production, provide a potential citrate source for soil bacteria. Under anaerobic conditions, citrate is broken down to pyruvate in two enzymatic steps, and pyruvate is in turn converted to diacetyl (10). These results suggest that ODR-10 activation could be a signature for the presence of bacterial species that use this metabolic pathway. ODR-10 on AWA cilia apparently cannot be activated by pyruvate and citrate. If expression of the receptor were induced in an exposed chemosensory neuron under some conditions in the natural environment, however, it is likely that ODR-10 could mediate a behavioral response to these compounds.
Acknowledgments
We thank Henry A. Lester, Norman Davidson, David J. Anderson, Barbara Imperiali, Chand Desai, Yasuhito Uezono, and the members of the Zinn and Bargmann groups for helpful discussions; Rochelle Diamond for flow cytometry; Gary Belford for advice on calcium imaging; Marc Caron for the HA-β2AdR plasmid; and Bo Yu for the M1AChR plasmid. We also thank the Caltech Cell Sorting facility for access to flow cytometry equipment and the Beckman Imaging Center for use of the imaging facility. This work was supported by grants from the National Institute of Mental Health to K.Z. and from the American Cancer Society to C.I.B. C.I.B. is an Assistant Investigator of the Howard Hughes Medical Institute. Y.Z. was supported by a National Research Service Award postdoctoral fellowship from the National Institutes of Health (National Institute on Deafness and Other Communication Disorders).
ABBREVIATIONS
- HA
hemagglutinin
- HEK293
human embryonic kidney 293
- β2AdR
β2-adrenergic receptor
- ACh
acetylcholine
- M1AChR
muscarinic M1 ACh receptor
- EC50
half-maximal effective concentration
References
- 1.Buck L B. Annu Rev Neurosci. 1996;19:517–544. doi: 10.1146/annurev.ne.19.030196.002505. [DOI] [PubMed] [Google Scholar]
- 2.Brunet L J, Gold G H, Ngai J. Neuron. 1996;17:681–693. doi: 10.1016/s0896-6273(00)80200-7. [DOI] [PubMed] [Google Scholar]
- 3.Buck L, Axel R. Cell. 1991;65:175–187. doi: 10.1016/0092-8674(91)90418-x. [DOI] [PubMed] [Google Scholar]
- 4.Bargmann C I, Hartweig E, Horvitz H R. Cell. 1993;74:515–527. doi: 10.1016/0092-8674(93)80053-h. [DOI] [PubMed] [Google Scholar]
- 5.Coburn C M, Bargmann C I. Neuron. 1996;17:695–706. doi: 10.1016/s0896-6273(00)80201-9. [DOI] [PubMed] [Google Scholar]
- 6.Komatsu H, Mori I, Rhee J S, Akaike N, Ohshima Y. Neuron. 1996;17:707–718. doi: 10.1016/s0896-6273(00)80202-0. [DOI] [PubMed] [Google Scholar]
- 7.Troemel E R, Chou J H, Dwyer N D, Colbert H A, Bargmann C I. Cell. 1995;83:207–218. doi: 10.1016/0092-8674(95)90162-0. [DOI] [PubMed] [Google Scholar]
- 8.Sengupta P, Chou J H, Bargmann C I. Cell. 1996;84:899–909. doi: 10.1016/s0092-8674(00)81068-5. [DOI] [PubMed] [Google Scholar]
- 9.Rupp R A W, Snider L, Weintraub H. Genes Dev. 1994;8:1311–1323. doi: 10.1101/gad.8.11.1311. [DOI] [PubMed] [Google Scholar]
- 10.Gottschalk G. Bacterial Metabolism. 2nd Ed. New York: Springer; 1986. [Google Scholar]
- 11.Colbert, H. A., Smith, T. L. & Bargmann, C. I. (1997) J. Neurosci., in press. [DOI] [PMC free article] [PubMed]
- 12.Ranganathan R, Malicki D M, Zuker C S. Annu Rev Neurosci. 1995;18:283–317. doi: 10.1146/annurev.ne.18.030195.001435. [DOI] [PubMed] [Google Scholar]
- 13.Sato T, Hirono J, Tonoike M, Takebayashi M. J Neurophysiol. 1994;72:2980–2989. doi: 10.1152/jn.1994.72.6.2980. [DOI] [PubMed] [Google Scholar]
- 14.Ward S, Thomson N, White J G, Brenner S. J Comp Neurol. 1975;160:313–337. doi: 10.1002/cne.901600305. [DOI] [PubMed] [Google Scholar]


