Abstract
The folding kinetics of G-CSF were determined by trp-fluorescence and far-UV circular dichroism. Folding and unfolding was achieved by rapid dilution and mixing of the denaturant, GdnHCl. G-CSF is a four-helical bundle protein with two long loops between the first and second helices and between the third and fourth helices. The entire conformational change expected by fluorescence was observed by stopped-flow technology, but due to rapid refolding kinetics only a portion was observed by circular dichroism. G-CSF contains two trp residues, and their contribution to the fluorescent-detected kinetics were deciphered through the use of single-site trp mutants. The trp moieties are probes of the local conformation surrounding their environment. One trp at residue 118 is located within the third helix while the other trp at residue 58 is part of the long loop between the first and second helices. The refolding results were most consistent with the following mechanism: U ↔ I1 ↔ I2 ↔ N; where U represents the unfolded protein, I1 represents intermediate state 1, I2 represents intermediate state 2, and N represents the native state. I1 is characterized as having approximately one-half of the native-like helical structure and none of the native-like fluorescence. I2 has 100% of the native helical structure and most of the trp-118 and little of the trp-58 native-like fluorescence. Thus refolding occurs in distinct stages with half of the helix forming first followed by the remaining half of the helix including the third helix and finally the loop between the first and second helices folds.
Keywords: Folding, fluorescence, G-CSF, intermediates, stopped-flow kinetics
The physiologic role of G-CSF is the maturation, proliferation, and differentiation of stem cell progeny to form neutrophils (Metcalf 1985; Holyoake 1996). G-CSF is normally present in the blood at picomolar concentrations, and its activity occurs through binding to the specific cell surface receptor, G-CSFR (Aritomi et al. 1999). The medicinal use of G-CSF to treat neutropenia has been a huge success. Recombinant G-CSF is produced through heterologous gene expression in Escherichia coli, and is marketed by Amgen under the trade name of Neupogen™.
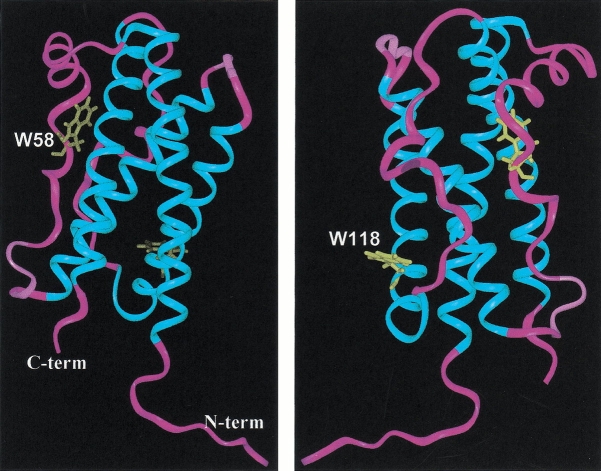
G-CSF has 174 amino acids with two disulfide bonds. G-CSF is a member of the long chain four-helical bundle structural superfamily of cytokines (Mott and Campbell 1995; Wells and de Vos 1996). The four helices are arranged in an up–up and down–down topology, with two long connecting loops between the first and second helices and between the third and fourth helices. The solution and crystal structure of G-CSF and in its receptor complex has been determined (Hill et al. 1993; Zink et al. 1994; Aritomi et al. 1999). The four long helices are contained within residues 11–39, 71–91, 100–123, and 143–172. The two long loops contain ∼20 residues and permit the above topology of the helices. G-CSF contains two trp moieties: one at residue 58 and one at 118. The fluorescence of trp58 is a spectral probe related to the folding of the first long loop and trp118 is a part of the third helix (see Fig. 1 ▶).
Fig. 1.
Depiction of the three-dimensional structure of the main chain of G-CSF as determined by NMR spectroscopy (see Zink et al. 1994). The four main helices are shown in blue and the loops in purple. The left panel shows the location of W58 within the first long loop, and for the right panel the structure was rotated 180° to illustrate the location of W118 in the third helix.
The solution dynamics of G-CSF are complex, with the existence of multiple equilibrium states as a result of changes in pH or denaturant concentrations. The conformational stability of G-CSF is greatest at pH 4 (Narhi et al. 1991) as well as its shelf-life stability. In the commercial formulation of pH 4, no aggregation problems are encountered. Attempts to stabilize wild-type G-CSF at high concentrations and neutral pH for the purpose of sustained delivery have failed due to irreversible aggregation (Oh-eda et al. 1990; Camble 1995). One or more of the equilibrium intermediate states may be implicated in the mechanism of the neutral pH aggregation phenomenon. Much interest exists to identify and characterize intermediate states of folding. Kinetic studies for the folding of disulfide containing G-CSF have not been reported. Elucidation of the folding pathway may identify aggregation prone states and contribute to the mechanism of folding for this important structural class of proteins. The only member of this structural class of proteins that has been studied by kinetic folding analysis is the growth hormones (bovine and human) (Brems et al. 1987; Youngman et al. 1995). The kinetic pathway for growth hormone folding occurs through distinct intermediate states with the helices forming prior to the tertiary structure. In addition, aggregation prone intermediate states are populated (Brems 1988).
Results
Equilibrium denaturation detected by circular dichroism and fluorescence
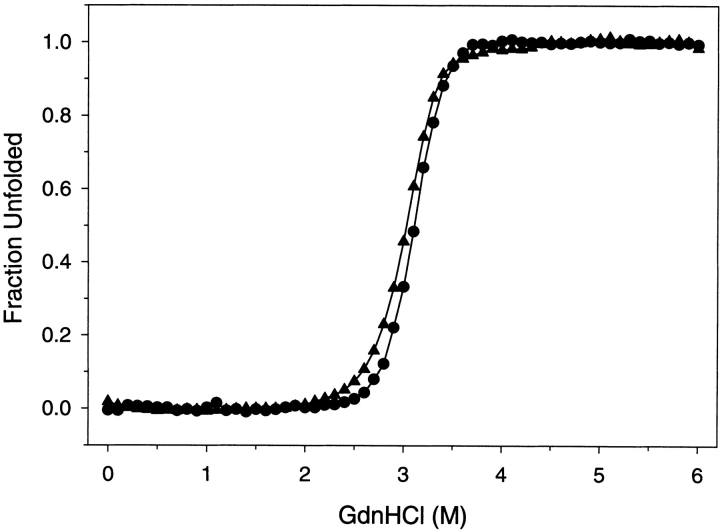
At pH 4 the intrinsic fluorescence of G-CSF is quenched and blue-shifted 8 nm compared to the unfolded state (Narhi et al. 1991; Kolvenbach et al. 1993). The equilibrium denaturation induced by GdnHCl as detected by fluorescence intensity at 340 nm and circular dichroism at 222 nm is shown in Figure 2 ▶. The results obtained by circular dichroism and fluorescence detection are very similar. These denaturation curves fit a two-state model and yield a Gibbs free energy of unfolding of 9.0 ± 0.3 kcal/mole. Circular dichroism at 222 nm is representative of the folding of the α-helices. Fluorescence intensity at 340 nm represents the combined quenching and solvent burial of the local region surrounding the two trp moieties at 58 and 118.
Fig. 2.
Equilibrium denaturation of G-CSF. Samples of G-CSF were equilibrated with varying concentrations of GdnHCl, and the fraction unfolded was determined by fluorescence (filled triangles) and by circular dichroism (filled circles). The G-CSF concentration was 25 μg/mL, pH 4, and the temperature was 20°C.
Folding kinetics as detected by fluorescence
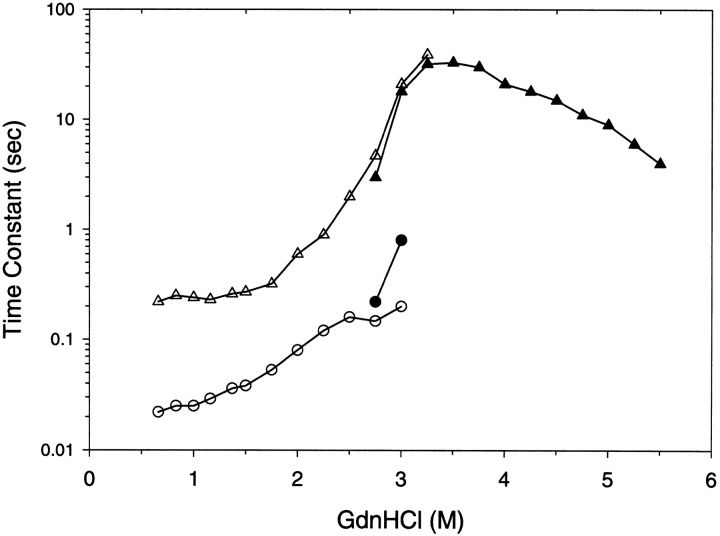
Refolding studies were achieved by diluting the unfolded protein to varying concentrations of GdnHCl and the kinetics of the fluorescence change was monitored over time (Fig. 3 ▶). Unfolding results were obtained by diluting the native protein to varying concentrations of GdnHCl and tracking the fluorescence. The refolding results for GdnHCl concentrations outside the equilibrium denaturation transition zone required two kinetic time constants to adequately fit the data. One kinetic time constant T1 occurred in the 20-msec to 100-msec time range while the second kinetic rate constant T2 was in the 200-msec to 1000-msec time range. The refolding time constants were not strongly dependent on GdnHCl concentrations outside the denaturation transition zone. For unfolding in GdnHCl concentrations outside the equilibrium denaturation transition zone a single kinetic time constant was sufficient to fit the data with a time constant corresponding to T2. The unfolding time constant was linearly dependent on GdnHCl concentration. The microscopic time constant for unfolding was extrapolated to zero concentration of GdnHCl and was 2000 sec. The refolding and unfolding time constants were strongly dependent on GdnHCl concentrations within the denaturation transition zone. Within the denaturation transition zone both unfolding and refolding for any particular denaturant concentration was overlapping with similar time constants. Similar time constants are expected for unfolding and refolding reactions that are only dependent on final denaturant concentrations.
Fig. 3.
Kinetic time constant results for G-CSF as determined by fluorescence. Refolding experiments are illustrated by the open symbols (circles, triangles) and unfolding experiments by the filled symbols (circles, triangles). The final concentrations of GdnHCl after unfolding and refolding are shown in the abscissa. Two kinetic time constants were observed; the triangles represent the slower time constant, and the circles represent the faster time constant. The kinetic results were obtained at 10°C in 20 mM acetate pH 4.0, and 0.1 mg/mL.
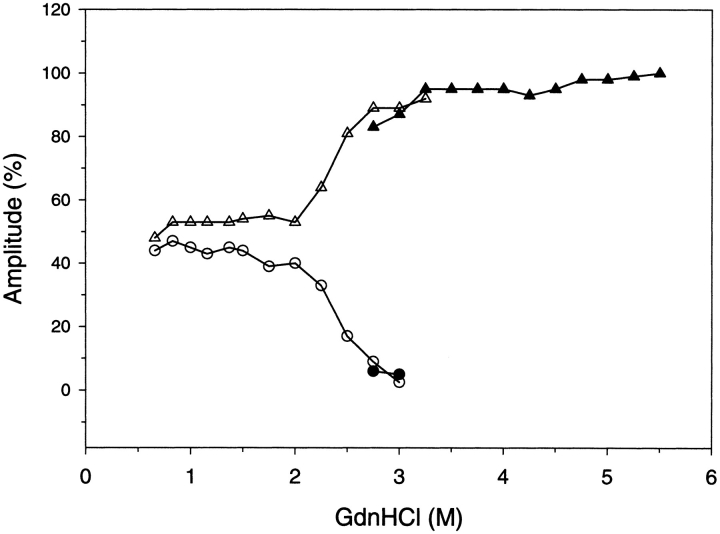
The amplitudes are the amount of spectral change associated with the two kinetic time constants, and are shown in Figure 4 ▶. The unfolding reaction in GdnHCl concentrations that are completely denaturing (>3.5 M) result in a single time constant and an amplitude that accounts for 100% of the expected fluorescence change. The refolding reaction in GdnHCl concentrations that are completely native (<2.0 M) result in two time constants with amplitudes of ∼45% for the faster reaction and ∼55% for the slower reaction. For increased GdnHCl concentrations within the transition zone of denaturation (between 2 M and 3.5 M) the faster reaction amplitude decreased and the slower reaction amplitude correspondingly increased. The amplitudes of these folding reactions conducted in GdnHCl concentrations of the denaturation transition zone show that the fast folding species was depopulated and converted into slow-folding species. The decreased amplitude of the fast folding reaction reflects the stability of this species to GdnHCl. Figure 5 ▶ demonstrates the stability of the fast folding species as determined from its kinetic amplitude compared to the equilibrium stability of the native state. The stability of the kinetic intermediate is shifted to lower GdnHCl concentrations by ∼0.5 M. Analysis of the kinetic intermediate stability curve results in a Gibbs free energy of unfolding of 7.7 kcal/mole, which is 1.3 kcal/mole less stable than the native state.
Fig. 4.
Kinetic amplitude results for G-CSF as determined by fluorescence. The closed symbols (circles, triangles) depict the amplitudes for unfolding, and the open symbols (circles, triangles) depict the amplitudes for refolding. The amplitude associated with the slower reaction is illustrated by the triangles, and the amplitude associated with the faster reaction is illustrated by the circles. The experimental conditions are the same as described in the previous figure.
Fig. 5.
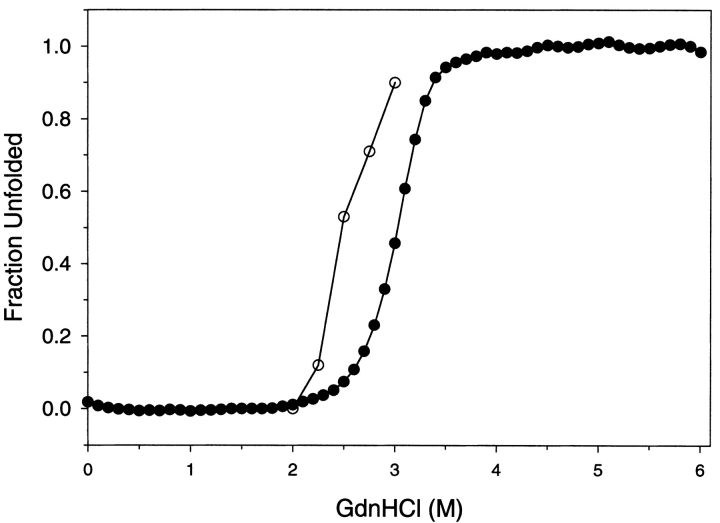
Stability of the kinetic intermediate compared to the native state. The stability of the kinetic intermediate (open circles) was determined from the GdnHCl dependence of the amplitude of the fluorescence detected fast refolding reaction. The fraction unfolded for the fast folding reaction was determined by the change in the amplitude from the pretransition baseline amplitude compared to the total change of amplitude for the fast folding reaction. The pretransition baseline amplitude was obtained from the best straight-line fit of the fast folding amplitudes below 2 M GdnHCl. The stability of the native state (filled circles) was obtained from the equilibrium denaturation results obtained by fluorescence detection as illustrated in Figure 2 ▶.
The kinetics of refolding was explored for protein concentration effects. Refolding from a GdnHCl concentration jump of 4 M to 0.66 M was observed by fluorescence detection. Final protein concentrations were varied from 0.01 mg/mL to 0.2 mg/mL. The kinetic time constants and the percent amplitudes were not affected (data not included) by the varying G-CSF concentration.
Folding kinetics as detected by circular dichroism
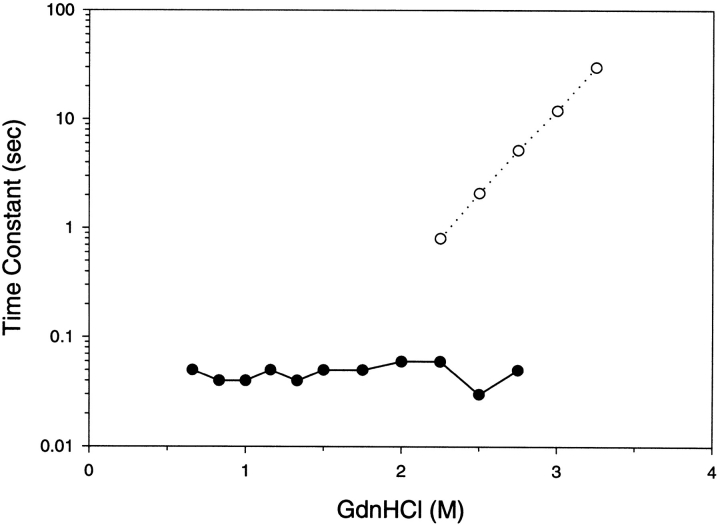
The results for the kinetic refolding as determined by circular dichroism at 222 nm are shown in Figure 6 ▶. Refolding in final denaturant concentrations of <2 M GdnHCl resulted in only one kinetic time constant of 40–70 msec that corresponded to the fast time constant of refolding observed by fluorescence. For refolding in final denaturant concentrations of >2 M GdnHCl two kinetic time constants were observed that corresponded to the fast and slow refolding reactions detected by fluorescence.
Fig. 6.
Kinetic time constant results for G-CSF refolding as determined by circular dichroism. The fast refolding time constant is represented by filled circles, and the slow refolding time constant by open circles. The final concentrations of GdnHCl after refolding is shown by the abscissa. The other conditions for refolding were identical to those described in Figure 3 ▶.
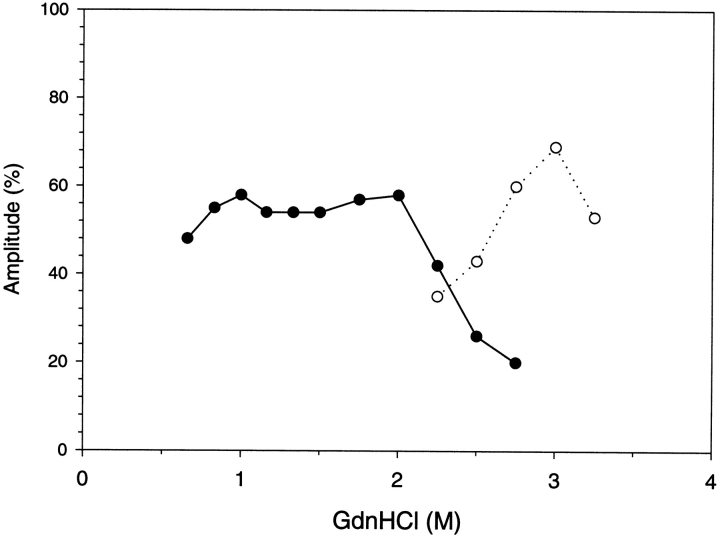
Figure 7 ▶ shows the amplitudes for the refolding kinetics determined by circular dichroism. The single observed time constant for refolding in final denaturant concentrations <2 M accounts for ∼50% of the expected change in circular dichroism. Thus, ∼50% of the circular dichroism change was not directly observed, and resulted prior to the dead time of the stopped-flow measurement. For refolding in final denaturant concentrations >2 M GdnHCl, the amplitude for the fast reaction diminished with increased denaturant while the amplitude for the slower reaction increased. The species refolding with a fast time constant was unstable to >2 M GdnHCl and folding proceeded through the slower folding pathway.
Fig. 7.
Kinetic amplitude results for G-CSF refolding as determined by circular dichroism. The amplitude associated with the faster reaction is illustrated by filled circles, and the amplitude associated with the slower reaction is illustrated by open circles. The experimental conditions are the same as described in Figure 3 ▶.
Folding kinetics of trp replacement analogs
The fluorescence detected refolding kinetic time constants for the W118F G-CSF analog and W58Q G-CSF analog were very similar to the results obtained for the wild-type G-CSF (results not shown). For both analogs, two refolding time constants were obtained: a faster and slower reaction, with similar dependencies to GdnHCl concentration as shown in Figure 3 ▶ for the wild-type.
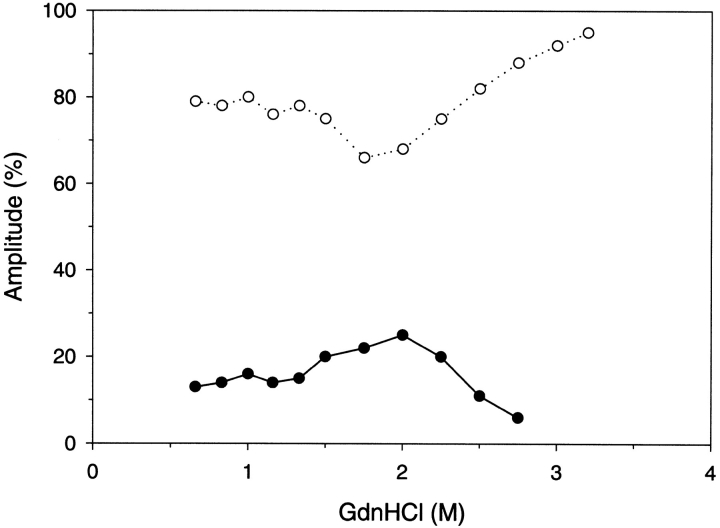
The results of the amplitudes for refolding of the trp replacement analogs were most interesting. Figure 8 ▶ demonstrates the refolding amplitude results for the W118F G-CSF analog. With a single trp present at residue 58 and for refolding of <2 M denaturant, 70%–80% of the fluorescence detected refolding occurred with the slow time constant compared to 50%–55% for the wild-type. Above 2 M denaturant and higher, the minor amount of fast folding diminished and converted to the slow folding reaction. The trp moieties are probes of the local conformation surrounding their environment and the trp 58 moiety predominantly reports the slow folding reaction. Thus, the region surrounding trp 58, the first long loop that connects the second and third helices, predominantly folds during the slow folding reaction.
Fig. 8.
Kinetic amplitude results for W118F G-CSF analog refolding as determined by fluorescence. The amplitude results for the slow folding reaction is illustrated by open circles, and the fast folding reaction by filled circles. Refolding conditions are identical to those in Figure 3 ▶.
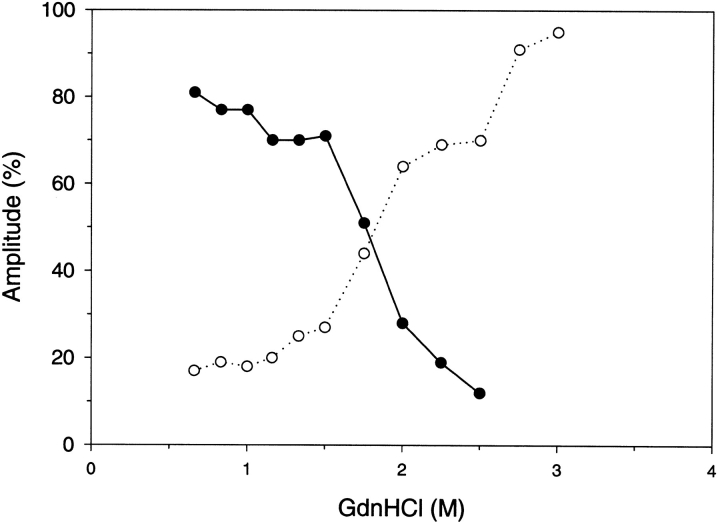
The refolding amplitudes for W58Q G-CSF analog are illustrated in Figure 9 ▶. This analog reports the fluorescence detected refolding of the single trp at 118 that is located in the C-terminal portion of the third helix. Below denaturant concentrations of 1.5 M GdnHCl, the reaction is dominated (>70%) by the fast folding reaction. All of the expected fluorescence change was observed and accounted for by the major fast folding and minor slow folding amplitudes. Thus, the third helical segment is predominantly folded during the fast folding reaction with a time constant of ∼30 msec. Above 1.5 M GdnHCl concentration and higher the amplitude of the fast folding reaction diminished and the slow folding time constant increased in amplitude. The species that fold through the fast folding reaction appear to convert into the slow folding form in the high concentration of denaturant. The decrease in the amplitude of the fast folding reaction above 1.5 M denaturant reflects the instability in the fast folding species to GdnHCl.
Fig. 9.
Kinetic amplitude results for W58Q G-CSF analog refolding as determined by fluorescence. The amplitude results for the slow folding reaction is illustrated by open circles, and the fast folding reaction by filled circles. Refolding conditions are identical to those in Figure 3 ▶.
Discussion
Equilibrium denaturation of G-CSF as determined by fluorescence or circular dichroism resulted in very similar transitions. The equilibrium denaturation transitions are cooperative and fit a two-state model with the two states being native and unfolded. According to these equilibrium results there are no detectable equilibrium intermediates. However, other methods of detection have previously identified the presence of equilibrium intermediates (Narhi et al. 1991). The ability to identify the presence of intermediate structure depends on the location and sensitivity of the reporting group. For example, GdnHCl induced equilibrium denaturation detected by other reporting groups such as, circular dichroism in the near-UV region, other fluorescent related studies, and chemical reactivity of the free cys at residue 17 have shown more complex behavior (D. Brems, unpubl.). A transition from the native to a partially denatured structure has been observed at lower concentrations of GdnHCl than the major denaturation transition shown in Figure 2 ▶.
The kinetic folding results were more complex than a two-state process. At least two exponential terms (kinetic time constants) were required to fit the refolding data. Scheme 1 is the simplest and most consistent explanation for refolding results in low concentrations of GdnHCl (<2 M). Scheme 2 is consistent with the refolding data in higher concentrations of denaturant (>2 M).
 |
Scheme 1. |
 |
Scheme 2. |
Folding reaction U ↔ I1
This reaction step was not directly observed, and was deduced from the circular dichroism detected refolding results. Whether refolding was in low or high denaturant, only 50 to 80% of the expected reaction was observed. For refolding below 2 M GdnHCl, ∼50% of the expected change in circular dichroism was consistently observed. The total expected change in circular dichroism for any concentration of GdnHCl was carefully determined through comparison of stopped-flow measurements utilizing a mix of unfolded protein with diluents of completely denaturing concentrations of GdnHCl compared to refolding concentrations of GdnHCl. The expected change in circular dichroism in refolding experiments not observed must occur too rapidly to detect by the stopped-flow technology employed. The dead-time of our instrument is estimated at 1 msec. Therefore, in low denaturant ∼50% of the helical structure was formed prior to 1 msec.
Folding reaction I1 ↔ I2
The time constant for this reaction ranged from 20 to 100 msec and corresponded to the faster refolding reaction observed by fluorescence and the observable reaction detected by circular dichroism. The remaining helical structure not formed during the earlier reaction was formed during the I1 ↔ I2 step in low denaturant concentrations or in the I1 ↔ N step for refolding in high concentrations of denaturant. Under refolding conditions of low denaturant (<2 M) 40 to 50% of the detected fluorescence change was associated with this I1 ↔ I2 reaction step. Refolding at denaturant concentrations of >2 M caused a decrease in the amplitude of the fluorescence detected I1 ↔ I2 reaction. The loss of amplitude in the fluorescence detected I1 ↔ I2 reaction is counteracted by an increase in the amplitude of the slower reaction (Fig. 4 ▶). The decrease in amplitude of the fluorescence detected I1 ↔ I2 reaction at high concentrations of denaturant reflects the instability of the I2 species. The loss of the fast-folding species and a corresponding increase in the slow-folding species as detected by fluorescence provides justification for the precursor and product relationship of I2 and N. Figure 5 ▶ compares the stability of I2 to N. I2 is 1.3 kcal/mole less stable than N. At higher concentrations of denaturant the refolding pathway proceeds in the absence of the I2 species according to Scheme 2 due to the instability I2.
G-CSF contains two trp moieties. The fluorescent-detected folding results of the analogs in which each trp was mutated provide insight into the I1 ↔ I2 reaction step (see Figs. 8,9 ▶ ▶). For both analogs the time constants for refolding were similar to the wild type, but the amplitudes for the reactions were different. At low concentrations of denaturant, the W58Q analog had 80% of refolding amplitude in the fast folding reaction compared to 45% for the wild type. This demonstrates that when the single trp at 118 is the only fluorescence probe, then the I1 ↔ I2 reaction step dominated, indicating that I1 has predominantly denatured-type fluorescence properties while I2 has mostly native-like fluorescence properties with respect to trp 118. At higher concentrations of denaturant (>1.5 M) the amplitude of the fast-folding reaction of the W58Q analog decreased and the amplitude for the slow-folding reaction increased. Again, this reflects the instability of the I2 species to higher concentrations of denaturant. Close to 100% of all the expected change in fluorescence was observed in the detectable time range for the fluorescence related refolding experiments.
Approximately 50% of the expected circular dichroism change occurred during this I1 ↔ I2 folding step. I1 is characterized as having ∼50% helical structure and denatured-like fluorescent properties. Most of the trp 118 native-like fluorescence was formed during the formation of the I2 state. Trp 118 is located within the third helix, and is a spectroscopic probe for specific folding in this region. Thus, we conclude that the third helix was formed specifically during the I1 ↔ I2 folding step. The third helix is part of the latest of the helical segments to fold.
Folding reaction I2 ↔ N
This reaction step was tracked by the slow-folding species observed by fluorescence. The time constant for this reaction was 200 sec to 1 sec (Fig. 3 ▶) for low denaturant concentrations (<2 M). At low concentrations of denaturant the amplitude for this slow reaction accounts for ∼55% of the expected fluorescence change as a result of folding (Fig. 4 ▶). Above 2 M GdnHCl and higher the I2 species was destabilized and folding proceeded predominantly through the I1 ↔ N pathway (Fig. 4 ▶) as illustrated in Scheme 2. As a result of the destabilization of I2 the observed folding eventually slowed to a time constant of 50 sec and the amplitude increased to 100% for the high concentration of denaturant.
The results of the W118F analog provide insight into this reaction. At low concentrations of denaturant 80% of the expected fluorescence change occurred with the slow folding reaction compared to 55% for the wild type. This demonstrates that when trp 58 is the only fluorescent probe, then the I2 ↔ N step became more predominate, indicating that I2 has mostly denatured-like trp 58 fluorescent properties.
Below 2 M GdnHCl the circular dichroism detected refolding results showed no change corresponding to the I2 ↔ N step. Thus, complete native-like helical structure was formed in the I2 state. The I2 state is characterized by having mostly native-like fluorescence surrounding the trp 118 moiety, mostly denatured-like fluorescence surrounding the trp 58 moiety, and native-like helicity. Trp 58 is located within the long loop between the first and second helices, and is a spectroscopic probe of the folding events of the surrounding region. Therefore, we conclude that the conformation of this long loop was the latest event observed in the folding of G-CSF.
All kinetic refolding experiments were at the acidic pH of 4.0. Under these conditions, G-CSF exists as a monomer, and there is no evidence for self-association of the native state. The refolding results were independent of protein concentration, suggesting that under acidic conditions none of the intermediates participate in aggregation reactions. However, these same intermediates may be populated under neutral pH conditions, and may contribute to the neutral pH aggregation phenomenon. A future step will be to determine the role of the acidic intermediates observed in this study to aggregation at neutral pH.
Materials and methods
Materials
Highly purified recombinant human G-CSF was produced at Amgen using heterologous expression in E. coli, and contains 174 amino acids plus an extra single methionine at the N-terminus. DNA encoding the two G-CSF mutant forms (W58Q G-CSF and W118F G-CSF) were prepared by site-directed mutagenesis of wild-type G-CSF DNA using standard protocols. Expression and isolation of these mutants were essentially identical to those used for the wild-type G-CSF. GdnHCl was of high purity grade from Pierce Chemicals, and was provided as an 8-M aqueous concentrate. All other reagents were of analytical grade, and deionized double-distilled water, Milli-Q-grade, was used exclusively. Protein concentrations were determined by absorbance at 280 nm using extinction coefficients of 0.86 for G-CSF and 0.52 for the G-CSF mutants utilizing a 1-cm pathlength and a 0.1% solution (Kolvenbach et al. 1993).
Methods
Equilibrium denaturation
Circular dichroism-detected denaturation results were collected on an Aviv 62DS spectropolarimeter at 222 nm. Fluorescence detected denaturation was obtained on an Aviv model ATF 105 spectrofluorometer with excitation at 295 nm. Samples of varying concentrations of GdnHCl were prepared using an automated titration system furnished by Aviv Associates. The system was composed of a Hamilton pump and two syringes that are programmed to deliver and mix specified volumes. One syringe was filled with concentrated GdnHCl (typically ∼6 M), protein, and buffer. The cuvette contained the same concentration of protein without denaturant. The software calculated the appropriate injection volume, and the second syringe removed an equivalent volume from the cuvette before injection of the first syringe. The entire titration was performed in this manner to facilitate a change in denaturant concentration while holding the volume in the cuvette constant. The starting material in a 1-cm pathlength cuvette contained protein at 25 μg/mL in 20 mM acetate, 20 mM MES, 50 mM Tris, and pH 4. The Hamilton syringe contained the same concentration of protein, buffer, and 6 M GdnHCl. The concentration of GdnHCl was determined by refractometry using a Milton Roy Abbe 3-L refractometer. Between titration injections the sample was stirred and allowed to equilibrate for 3 min before the spectral signal was recorded. This equilibration time has been experimentally determined to be adequate for G-CSF conformational states to reach equilibrium. The equilibrium denaturation transitions were analyzed by the linear extrapolation method of Pace et al. (1987).
Stopped-flow kinetics
The kinetics of unfolding and refolding of G-CSF and analogs were obtained using an Applied Photophysics π*-180 spectrometer. Fluorescence signals were measured with an excitation of 295 nm and an emission cutoff filter of 320 nm. Circular dichroism signals were monitored at a wavelength of 222 nm. All kinetic experiments utilized a 2-mm pathlength and were at 10°C. Kinetic refolding was achieved by first denaturing and equilibrating the protein at 0.6 mg/mL in 4 M GdnHCl, 20 mM acetate, and pH 4 followed by a rapid mixing of five parts of diluent with one part of denatured protein solution. The diluent was 20 mM acetate, pH 4, with varying concentrations of GdnHCl to obtain the desired final concentration of denaturant. Kinetic unfolding was accomplished by starting with native protein at 0.6 mg/mL in 20 mM acetate pH 4 and rapidly mixing of five parts of diluent with one part of the native protein solution. The diluent was 20 mM acetate, pH 4, with varying concentrations of GdnHCl to achieve the desired final concentration of denaturant. Circular dichroism detected curves were the average of at least three individual measurements. A single measurement was sufficient to obtain high quality fluorescent detected curves.
The obtained unfolding and refolding kinetic curves were analyzed using a data fitting program supplied by Applied Photophysics. The kinetic curves were fit to a first-order rate equation containing either one or two exponentials. The double exponential rate equation was:  , where A(t) is the experimentally observed spectroscopic signal at time t, A1 is the amplitude of the first kinetic phase, k1 is the observed rate constant for the first kinetic phase, and A2 is the amplitude of the second kinetic phase, k2 is the observed rate constant for the second kinetic phase, and C is an offset constant that represents the final signal obtained at infinite time. All kinetic rate constants were reported as time constants, which are the inverse of rate constants. Amplitudes were reported as a percentage, which is the value A1 or A2 from the rate equation divided by the total expected change in the spectroscopic signal. The total expected change in the spectroscopic signal was experimentally determined for each denaturant concentration. The total expected change for refolding experiments was the difference in signal obtained by mixing one part of the starting denatured protein solution with five parts of buffer containing the identical starting denaturant concentration compared to the final signal C. The total expected change for unfolding experiments was the difference in signal obtained by mixing one part of the starting native protein solution with five parts of buffer compared to the final signal C. These experiments in which the denaturant concentrations were not altered always resulted in a flat signal. The minimum number of exponential terms needed to fit the data were determined from the goodness of fit, and was deemed sufficient when the residual difference between the data and fit was not improved by adding an additional exponential term to the rate equation.
Acknowledgments
The author thanks Casim Sarkar of Massachusetts Institute of Technology for collecting the equilibrium denaturation data, Tom Boone and Mike Mann of Amgen for the preparation of G-CSF analogs, and Margaret Speed of Amgen for helpful discussions.
The publication costs of this article were defrayed in part by payment of page charges. This article must therefore be hereby marked "advertisement" in accordance with 18 USC section 1734 solely to indicate this fact.
Article and publication are at http://www.proteinscience.org/cgi/doi/10.1110/ps.0206202.
References
- Aritomi, M., Kunishima, N., Okamoto, T., Kuroki, R., Ota, Y., and Morikawa, K. 1999. Atomic structure of the GCSF-receptor complex showing a new cytokine-receptor recognition scheme. Nature 401 713–717. [DOI] [PubMed] [Google Scholar]
- Brems, D.N. 1988. Solubility of different folding conformers of bovine growth hormone. Biochemistry 27 4541–4546. [Google Scholar]
- Brems, D.N., Plaisted, S.M., Dougherty, Jr., J.J., and Holzman, T.F. 1987. The kinetics of bovine growth hormone folding are consistent with a framework model. J. Biol. Chem. 262 2590–2596. [PubMed] [Google Scholar]
- Camble, R. 1995. Engineering G-CSF for improved depot formulation. In Perspect. Protein Eng. Complementary Technol., Collect. Pap., Int. Symp. 3rd (eds. M.J. Geisow and R. Epton), pp. 193–196, Mayflower Worldwide, Kingswinford, UK.
- Hill, C.P., Osslund, T.D., and Eisenberg, D. 1993. The structure of granulocyte-colony stimulating factor and its relationship to other growth factors. Proc. Natl. Acad. Sci. 90 5167–5171. [DOI] [PMC free article] [PubMed] [Google Scholar]
- Holyoake, T.L. 1996. Cytokines at the research–clinical interface: Potential applications. Blood Rev. 10 189–200. [DOI] [PubMed] [Google Scholar]
- Kolvenbach, C.G., Elliott, S., Sachdev, R., Arakawa, T., and Narhi, L.O. 1993. Characterization of two fluorescent tryptophans in recombinant human granulocyte-colony stimulating factor: Comparison of native sequence protein and tryptophan-deficient mutants. J. Protein Chem. 12 229–236. [DOI] [PubMed] [Google Scholar]
- Metcalf, D. 1985. The granulocyte-macrophage colony-stimulating factors. Science 229 16–22. [DOI] [PubMed] [Google Scholar]
- Mott, H.R. and Campbell, I.D. 1995. Four-helix bundle growth factors and their receptors: Protein–protein interactions. Curr. Opin. Struct. Biol. 5 114–121. [DOI] [PubMed] [Google Scholar]
- Narhi, L.O., Kenney, W.C., and Arakawa, T. 1991. Conformational changes of recombinant human granulocyte-colony stimulating factor induced by pH and guanidine hydrochloride. J. Protein Chem. 10 359–367. [DOI] [PubMed] [Google Scholar]
- Oh-eda, M., Hasegawa, M., Hattari, K., Kuboniwa, H., Kojima, T., Orita, T., Tomonou, K., Yamazaki, T., and Ochi, N. 1990. O-linked sugar chain of human granulocyte-colony stimulating factor protects against polymerization and denaturation allowing it to retain its biological activity. J. Biol. Chem. 265 11432–11435. [PubMed] [Google Scholar]
- Pace, C.N., Shirley, B.A., and Thomson, J.A. 1987. Measuring the conformational stability of proteins. In Protein structure and function: A practical approach (ed. T.W. Creighton), chapt. 18. IRL Press, Washington, DC.
- Wells, J.A. and de Vos, A.M. 1996. Hematopoietic receptor complexes. Annu. Rev. Biochem. 65 609–634. [DOI] [PubMed] [Google Scholar]
- Youngman, K.M., Spencer, D.B., Brems, D.N., and DeFelippis, M.R. 1995. Kinetic analysis of the folding of human growth hormone. J. Biol. Chem. 270 19816–19822. [DOI] [PubMed] [Google Scholar]
- Zink, T., Ross, A., Luers, K., Cieslar, C., Rudolph, R., and Holak, T.A. 1994. Structure and dynamics of the human granulocyte-colony stimulating factor determined NMR spectroscopy. Biochemistry 33 8453–8463. [DOI] [PubMed] [Google Scholar]


