Abstract
It is important to resolve the structure of Bombyx mori silk fibroin before spinning (silk I) and after spinning (silk II), and the mechanism of the structural transition during fiber formation in developing new silk-like fiber. The silk I structure has been recently resolved by 13C solid-state NMR as a "repeated β-turn type II structure." Here, we used 13C solid-state NMR to clarify the heterogeneous structure of the natural fiber from Bombyx mori silk fibroin in the silk II form. Interestingly, the 13C CP/MAS NMR revealed a broad and asymmetric peak for the Ala Cβ carbon. The relative proportions of the various heterogeneous components were determined from their relative peak intensities after line shape deconvolution. Namely, for 56% crystalline fraction (mainly repeated Ala-Gly-Ser-Gly-Ala-Gly sequences), 18% distorted β-turn, 13% β-sheet (parallel Ala residues), and 25% β-sheet (alternating Ala residues). The remaining fraction of 44% amorphous Tyr-rich region, 22% in both distorted β-turn and distorted β-sheet. Such a heterogeneous structure including distorted β-turn can be observed for the peptides (AG)n (n > 9 ). The structural change from silk I to silk II occurs exclusively for the sequence (Ala-Gly-Ser-Gly-Ala-Gly)n in B. mori silk fibroin. The generation of the heterogeneous structure can be studied by change in the Ala Cβ peak of 13C CP/MAS NMR spectra of the silk fibroin samples with different stretching ratios.
Keywords: Bombyx mori silk fiber, antiparallel β-sheet structure, poly(Ala-Gly), 13C CP/MAS NMR, silk I and silk II, heterogeneous structure of silk fiber
Because of the exceptional strength and high toughness of Bombyx mori silk fiber, much attention has been focused on the structure determination of silk fibroin before and after spinning and the factors that contribute to the conformational change (Asakura and Kaplan 1994; Gosline et al. 1999). The remarkable properties of silk fibers are attributed to the distribution of microcrystalline and amorphous domains, which are formed in the process of spinning by protein–protein interactions. The overall composition of silk fibroin in mol% consists of glycine (42.9%), alanine (30.0%), serine (12.2%), tyrosine (4.8%), and valine (2.5%) (Shimura 1980). The complete primary structure of B. mori fibroin has been determined by Mita et al. (1994) and more recently by Zhou et al. (2000). In addition to the well-known sequence motif AGSGAG, which is the main repetitive unit in the crystalline regions of the silk fiber (Fraser et al. 1966; Strydom et al. 1977; Saito et al. 1984), the protein also contains semicrystalline repeating motifs such as AGYGAG and AGVGYGAG (Shimura 1980; Asakura et al. 1984, 2001b, 2002b; Mita et al. 1994; Zhou et al. 2000) as well as the irregular unit, GAAS (Asakura et al. 2002a) and the amorphous motifs.
Fibroin can assume two distinct structures in the solid state, namely silk I before spinning, and silk II after spinning, that is, the silk fiber. The corresponding structures have been investigated by X-ray fiber diffraction (Marsh et al. 1955; Fraser et al. 1966; Fraser and MacRae 1973; Asakura et al. 1985; Okuyama et al. 1988; Takahashi et al. 1999), electron diffraction (Lotz et al. 1974; Okuyama et al. 1988; He et al. 1999), conformational energy calculations (Lotz and Cesari 1979; Fossey et al. 1991), infrared spectroscopy (Fraser and MacRae 1973; Magoshi et al. 1979; Asakura et al. 1985), 13C and 15N crosspolarization magic angle spinning (CP/MAS) NMR (Saito et al. 1984; Asakura et al. 1985, 2001b; Nicholson et al. 1993; Demura et al. 1998), and chemical shift calculation (Zhou et al. 2001). Despite a long history of studying silk I, its structure determination was difficult because any attempt to induce a macroscopic orientation of the sample for X-ray diffraction, electron diffraction, or solid-state NMR readily causes a conversion of the silk I form to the silk II form (Saito et al. 1984; Asakura et al. 1985, 1997a, 1999; Ishida et al. 1990). Recently, we have resolved the molecular conformation of silk I as a "repeated β-turn type II", using solid-state NMR methods such as 2D spin diffusion NMR under off magic angle spinning, Rotational Echo DOuble Resonance (REDOR), and 13C chemical shift data (Asakura et al. 2001a).
Concerning the structure of silk II, Marsh et al. (1955) were the first to propose an antiparallel β-sheet model based on a fiber diffraction study of native B. mori silk fibroin fiber. Fraser et al. (1966) showed that the polypeptide sequence (AGSGAG)n exhibits a slightly greater intersheet spacing than (AG)n, but in accordance with the antiparallel β-sheet model. Subsequently, it was pointed out by Lotz et al. (1974) that (AG)n in the silk II form must possess some intrinsic structural disorder, because the intersheet Gly–Gly and Ala–Ala distances are increased and decreased, respectively, when compared to polyglycine and polyalanine by X-ray and electron diffraction. Recently, Takahashi et al. (1999) reported a more detailed X-ray fiber diffraction analysis of B. mori silk fibroin based on 35 quantitative intensities. Having analyzed four types of models for the silk II form in terms of the experimentally derived R-factor, they proposed that two antipolar antiparallel β-sheet structures are statistically stacked with different orientations, occupying the crystal site with a ratio of 1:2 (Takahashi et al. 1999). Even though the local protein conformation is still the basic β-sheet as proposed by Marsh et al., the refined silk II model accounts for the stacking of the β-sheet planes in two different arrangements.
X-ray diffraction is a powerful approach to obtain structural information on the crystalline regions of the silk fiber, which predominantly consist of the repeated sequence (AGSGAG)n and which can be reliably modeled by the polypeptide (AG)n. However, diffraction methods cannot yield any results on the amorphous domains of silk II, in which the repeated Ala–Gly sequences are known to contain interspersed Tyr and Val residues. Solid-state NMR spectroscopy, on the other hand, provides direct structural information about individual amino acid sites, especially when coupled with stable isotope labeling of B. mori silk fibroin and synthetic model peptides.
In our previous solid state 13C and 15N and 2H NMR analyses of silk II (Nicholson et al. 1993; Asakura et al. 1997b; Demura et al. 1998), we have determined the orientations of specific molecular bonds with respect to the fiber axis, by analyzing the anisotropic spin interactions in labeled B. mori silk fibers that were prepared as uniaxially aligned samples. That way the torsion angles φ and ξ could be determined for Ala and Gly, yielding essentially the same β-sheet conformation as proposed by Marsh et al. It was furthermore possible to discriminate the signals from well-oriented crystalline regions from those of nonoriented amorphous domains in the fibers (Asakura et al. 1997b). In addition, we recently found that the Ala Cβ peak in the 13C CP/MAS NMR spectrum of B. mori silk fibroin is broad and asymmetric in the silk II form, and we demonstrate that this reflects the heterogeneous structure of the fiber in terms of backbone conformation as well as side-chain packing (Asakura et al. 2002c).
In this article, we will determine the detailed heterogeneous structure of B. mori silk fibroin in the silk II form, based on a detailed assignment of the Ala Cβ peak by solid-state 13C NMR. In the primary structure of B. mori silk fibroin the Ala residues are located in different sequence motifs along the chain, and they are furthermore distributed among the heterogeneous domains of the fiber. We will show that the asymmetric peak of the Ala Cβ carbons consists of several contributions from Ala residues in different environments, and we are able to discriminate among (A) different sequence motifs of silk fibroin, (B) different side-chain packing environments, and (C) crystalline and amorphous domains. Next we will examine the generation of the heterogeneous silk fibroin structure. For this purpose, the model peptides (AG)n with different lengths and the silk fibroin samples with different stretching ratios were prepared. The structural analysis of the 13C CP/MAS NMR gives the aspects of the generation of heterogeneous structure of B. mori silk fibroin.
Results and Discussion
13C CP/MAS NMR spectra of (AG)15, (AGSGAG)5, Cp fraction, and B. mori silk fibroin in the silk II form
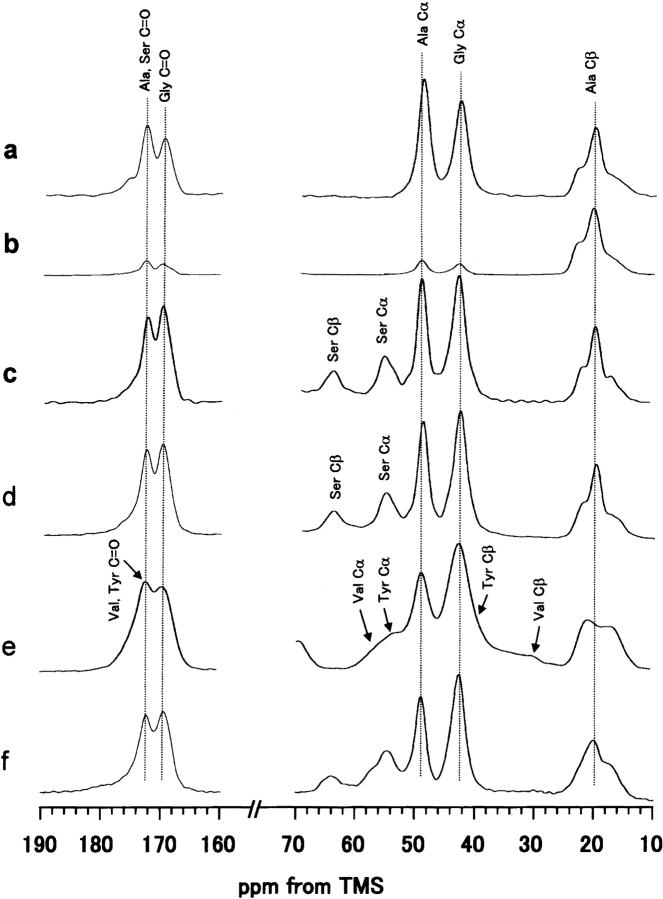
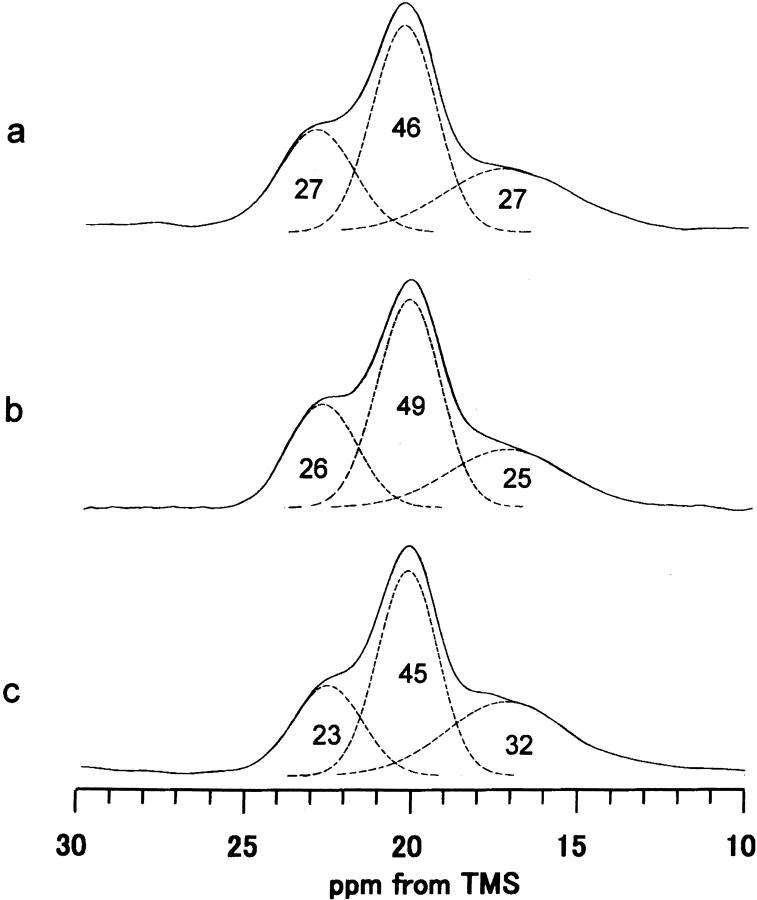
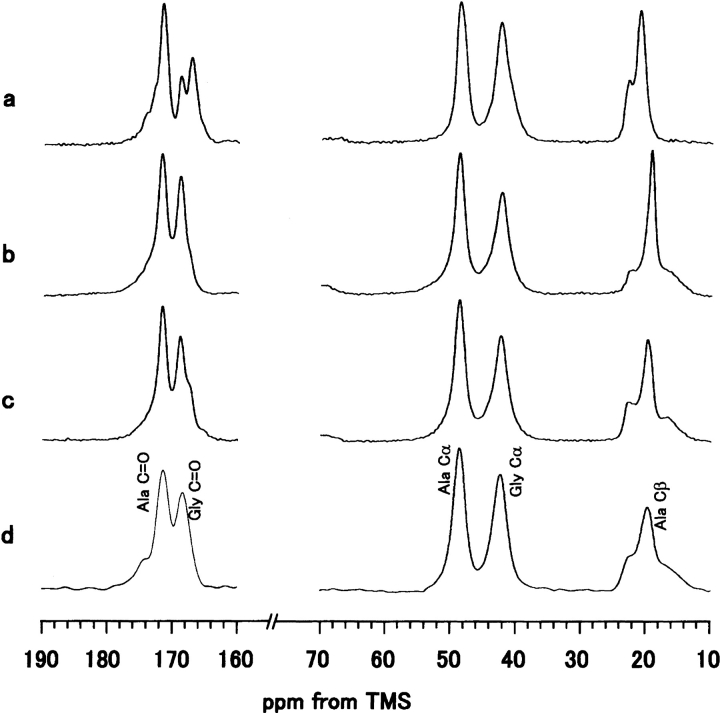
Figure 1 ▶ shows the 13C CP/MAS NMR spectra and peak assignments of various model peptides of B. mori silk fibroin in the silk II form and B. mori silk fiber. The spectrum of the Cp fraction, which constitutes 56% of the total silk fibroin and mainly consists of the repeated sequence (AGSGAG)n (Lucas et al. 1956) is also shown. The conformation-dependent chemical shifts of the three Ala carbons (Cα, Cβ, and carbonyl) are known as characteristic markers, sufficient to identify the silk I and silk II forms of B. mori silk fibroin and the model peptides (Saito et al. 1984; Asakura et al. 1985; Ishida et al. 1990). As seen in Figure 1 ▶ and summarized in Table 1, the 13C chemical shifts of the Ala and Gly carbons in the Cp fraction are in excellent agreement with those of (AG)15 and (AGSGAG)5 in silk II forms, within experimental error. Therefore, the abundance of Ser residues in the characteristic sequence motif (AGSGAG)n of the Cp fraction does not lead to any structural differences compared to the basic sequence of the simple (AG)n copolymer. Hence, the polypeptide (AG)15 is a valid model to imitate the structure of the Cp fraction. It is noted that Ala Cβ peaks are asymmetric and broad in the 13C CP/MAS spectra of (AG)15 (Fig. 1a ▶), (AGSGAG)5 (Fig. 1c ▶) and the Cp fraction (Fig. 1d ▶), although the Cα and carbonyl peaks of Ala and Gly residues still look sharp. This means that the methyl side chains of Ala are more sensitive to the intermolecular chain arrangement than the backbone carbons. The basic antiparallel β-sheet conformation of silk II has been demonstrated both for silk fibroin as well as the model peptide (AG)15, which was in turn shown to be equivalent to the Cp fraction of B. mori silk fibroin and to the sequence (AGSGAG)n. With these models in mind, we are now able to analyze the heterogeneous structure of natural silk fibers in more detail. As shown in Figure 1 ▶, the Ala Cβ signals of all samples that were prepared in the silk II form consist of three peaks. A deconvolution assuming Gaussian line shapes was performed to determine their relative areas (Fig. 2 ▶). The spectrum of (AG)15 yields the three isotropic chemical shifts of 22.2, 19.6, and 16.7 ppm, with relative fractions of 27%, 46%, and 27%, respectively. The data are almost the same for the Cp fraction in the silk II form, namely 22.1 ppm (23%), 19.5 ppm (45%) and 16.5 ppm (32%).
Fig. 1.
13C CP/MAS NMR spectra of (a) (AG)15, (b) (AG)14[3-13C]AG, (c) (AGSGAG)5, (d) Cp fraction, (e) (AG)3YG(AG)2VGYG(AG)3 YG(AG)3, and (f) B. mori silk fibroin fiber in the silk II forms. The chemical shifts are represented in ppm downfield from TMS. The Ser carbonyl peak was superimposed on the Ala carbonyl peak. The experimental condition is described in the text.
Table 1.
13C CP/MAS NMR chemical shifts of the sequential model peptides and B. mori silk fibroins in the silk II forms (ppm from TMS)
| G(AG)3 | (AG)9 | (AG)12 | (AG)15 | Cpa | (AGSGAG)5 | Silk fiber | (AG)3Y1Vb | |
| Gly Cα | 42.3 | 42.3 | 42.4 | 42.4 | 42.5 | 42.6 | 42.5 | 42.6 |
| C=O | 167.4 | |||||||
| 169.1 | 169.0 | 169.0 | 169.1 | 169.2 | 169.5 | 169.3 | 169.5 | |
| Ala Cα | 48.6 | 48.7 | 48.6 | 48.7 | 48.8 | 48.9 | 48.9 | 48.8 |
| Cβ | 16.6 | 16.5 | 16.7 | 16.5 | 16.7 | 16.7 | 16.5 | |
| 20.6 | 19.2 | 19.5 | 19.6 | 19.5 | 19.9 | 19.9 | 21.1 | |
| 22.5 | 22.3 | 22.4 | 22.2 | 22.1 | 22.1 | 22.1 | ||
| C=Oc | 171.8 | 171.9 | 171.8 | 171.8 | 172.0 | 172.1 | 172.2 | 172.2 |
| Ser Cα | — | — | — | — | 54.9 | 55.0 | 54.6 | — |
| Cβ | — | — | — | — | 63.8 | 63.9 | 63.9 | — |
a Precipitated fraction after chymotrypsin cleavage of B. mori silk fibroin.
b (AG)3Y1V means the peptide, (AG)3YG(AG)2VGYG(AG)3YG(AG)3.
c The Ser carbonyl peak was superimposed with the Ala carbonyl peak.
Fig. 2.
Expanded Ala Cβ peaks of 13C CP/MAS NMR spectra of (a) (AG)15, (b) (AG)14[3-13C]AG, and (c) Cp fraction in the silk II forms. The spectral deconvolution was performed by assuming Gaussian.
At this point it is critical to clarify whether the composite nature of the Ala Cβ peak, which reflects different local environments, arises either from different Ala positions within one chain or instead from the presence of different types of chains with differing conformations (but exhibiting a uniform chemical shift along one chain). This question was addressed using a specifically 13C-labeled model peptide, (AG)14[3-13C]AG, in which only the Cβ carbon of the 29th Ala residue was labeled. If the local conformation of the Ala residues near the chain end would differ from the Ala conformation in the central parts in the chain, then only a single Cβ peak is expected to appear at 16.7 ppm. However, as shown in Figure 1b ▶, the shape of the selectively labeled Ala Cβ peak is asymmetric and broad, being essentially the same as the natural abundance 13C NMR signal of unlabeled (AG)15. This observation suggests that (AG)15 in the silk II form maintains the same local conformation at every site throughout one molecular chain. In other words, if the Ala residues in the central part in the chain assume an antiparallel β-sheet structure, the 29th Ala residue also takes an antiparallel β-sheet structure.
Assignment of the Ala Cβ peak of the B. mori silk fibroin fiber
To assign the heterogeneous peak of Ala Cβ carbon of B. mori silk fibroin fiber, we will first try to assign the three deconvoluted Ala Cβ signals of (AG)15 and the Cp fraction in Figure 2 ▶ to specific conformations of the silk II form. Especially the peak at 16.7 ppm deserves attention, because it occurs at the same position as the Ala Cβ signal in the genuine silk I form (Saito et al. 1984). If a fraction of the Ala residues in (AG)15 (prepared as silk II) had indeed retained a genuine silk I structure, then the corresponding Cα and carbonyl carbons should produce a sharp peak at 50.7 and 176.8 ppm, respectively (Asakura et al. 2001a). However, such sharp peaks are not observed in Figure 1a ▶, and weak broad signals are detected instead (especially in the carbonyl region). The considerable linewidth of the Ala Cβ peak at 16.7 ppm suggests that the torsion angles are distributed over a wide range of values, but with an average that corresponds approximately to the torsion angles of the silk I form. Therefore, we assigned the broad Ala Cβ component at 16.7 ppm in Figure 2 ▶ to a "distorted β-turn" structure. In our previous article (Asakura et al. 1985), we had already pointed out this broad peak and had simply called it "random coil." However, we should use the more appropriate term "distorted β-turn" conformation.
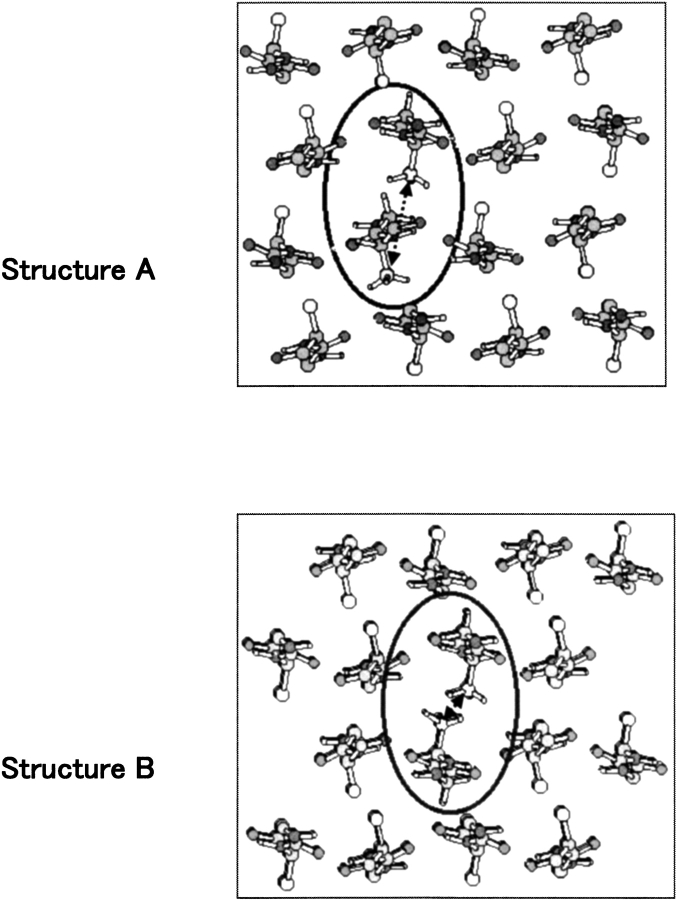
The other two peaks observed at 19.6 and 22.2 ppm in the Ala Cβ region can be readily assigned to an antiparallel β-sheet conformation, based on recent X-ray diffraction results of the silk II structure of B. mori silk fibroin. Takahashi et al. (1999) have proposed a detailed intermolecular arrangement of alternating (AG)n copolymer chains, as illustrated by the two structures in Figure 3 ▶. These are the views of cross-sections of intersheet arrangements. In the structure model A, all methyl groups of Ala residues point towards the same direction, whereas in the structure model B the methyl groups alternately point to opposite directions in the adjacent sheets. The ratio of the two structures, A and B, was determined to be 1:2 from the R-factor, assuming that they are statistically distributed in the crystal structure of silk II. Because of the two different ways of stacking the adjacent β-sheets, the Ala methyl groups along the b axis (across the intersheet distance) experience different environments in the two cases A and B. This composite structural model allows us to assign the two peaks of the Ala Cβ carbons in the 13C CP/MAS NMR spectra. The 13C chemical shifts of Ala Cβ carbon were calculated by ab initio molecular orbital methods for the two molecular models, A and B, previously to assign the two Ala Cβ peaks observed at 22.2 and 19.6 ppm (Asakura et al. 2002c). The calculated 13C shielding of the Ala Cβ carbon was 174.8 ppm in model A and 177.3 ppm in model B. The peak at 22.2 ppm is therefore assigned to the Ala methyl carbons in Structure A, and the peak at 19.6 ppm is assigned to Structure B of Figure 3 ▶. The relative intensities of these two peaks were determined as 27% and 46%, respectively, as mentioned above, which is in good agreement with the ratio of 1:2 proposed by Takahashi et al. from the X-ray diffraction data within experimental error. Thus, the Ala side chains are more sensitive to the subtle differences in intermolecular packing than the backbone carbons, and the Ala Cβ peaks can thus be used to assess both the β-sheet stacking as well as the local conformation.
Fig. 3.
Two kinds of the structures, structure A and B, of poly(AG) in the silk II forms proposed by Takahashi et al. (Takahashi et al. 1999) with X-ray diffraction analysis. The torsion angles of both structures are φ = −140°, ξ = 153° for Gly and φ = −141°, ξ = 152° for Ala, but the packing of the chains is different between the structures A and B: All the methyl groups of Ala residues have the same direction, which is perpendicular to the sheet planes in structure A and the methyl groups alternately point to the reverse directions in the adjacent sheets, which are also perpendicular to the sheet planes in structure B. Only Ala residues in circles are shown with three methyl protons and others without methyl protons.
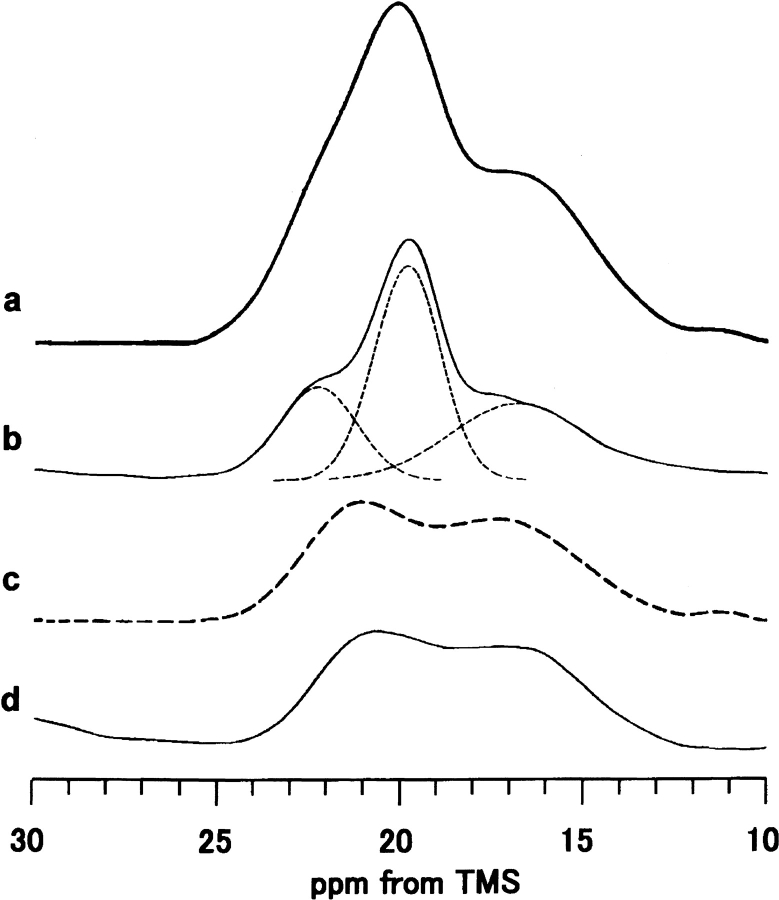
It should be noted that the Ala Cβ peak of B. mori silk fibroin fiber (Fig. 1f ▶) is also asymmetric and broad, but its line shape is slightly different to those of (AG)15, (AGSGAG)5 and Cp fraction in silk II form (Fig. 1a–d ▶). By taking into account the content of the Cp fraction (56%), the difference spectrum (Fig. 4c ▶, dashed line) was obtained by subtracting the spectrum of the Cp fraction with silk II form (Fig. 4b ▶) from the spectrum of B. mori silk fibroin fiber (Fig. 4a ▶). Next, we will assign this difference spectrum.
Fig. 4.
Expanded Ala Cβ peaks of 13C CP/MAS NMR spectra of (a) B. mori silk fibroin fiber, (b) Cp fraction, (c) the difference spectrum, (a)–(b) shown as dashed line. The expanded Ala Cβ peak of (d) (AG)3YG(AG)2VGYG(AG)3YG(AG)3 is also shown.
B. mori silk fibroin has a heterogeneous primary structure as described in the Abstract. Other than the repeated sequences, AGSGAG (Cp fraction), there are many repeated sequences such as AGYGAG and AGVGYGAG (Zhou et al. 2000). To know 13C CP/MAS NMR spectra of these latter sequences, a model peptide, (AG)3YG(AG)2VGYG (AG)3Y(AG)3, was synthesized. The formic acid treatment of this peptide was performed, which was the same treatment as the preparation of silk II form for (AG)15, and the amorphous WAXS pattern was obtained as reported previously (Asakura et al. 2001b). The 13C CP/MAS spectrum is shown in Figure 1e ▶, and the Ala Cβ region is expanded in Figure 4d ▶ (Asakura et al. 2002c). The line shape, broad double, of the Ala Cβ peak is similar to the difference spectrum (Fig. 4c ▶). Thus, the Ala Cβ peaks indicate that there are both distorted β-sheet (21.1 ppm) and distorted β-turn (16.5 ppm) conformations. Finally, the heterogeneous structure of the silk fiber was determined as follows: for the Cp fraction (56% of silk fiber), 18% distorted β-turn, 13% β-sheet (parallel Ala), 25% β-sheet (alternating Ala); for the 44% amorphous Tyr-rich region, 22% in both distorted β-turn and distorted β-sheet.
Generation of heterogeneous structure by changing the length of (AG)n
Figure 5 ▶ shows the 13C CP/MAS NMR spectra of (AG)n with different n values (n = 9, 12, and 15) together with the G(AG)3 sample. The conformation-dependent chemical shifts of the three Ala carbons (Cα, Cβ, and carbonyl carbons) and the Gly Cα carbon indicate that the structures of these peptides are basically silk II form, antiparallel β-sheet structure, although the Gly carbonyl peaks are slightly complicated in the case of G(AG)3. In our previous article (Kameda et al. 2002), rotational echo double-resonance NMR spectroscopy is applied for the determination of Ala intra- and intermolecular structures of pentapeptide, G(AG)2. Even in the case of such a short peptide, the structure was an antiparallel β-sheet. When the same distances between two interpleated sheets were assumed, the distance was calculated to be 5.3 Å. Thus, it seems valid that the longer peptides than G(AG)2 used here are basically antiparallel β-sheet structure. It is noted that the asymmetric peak in the Ala Cβ region appears for the peptides longer than (AG)9. Namely, the broad peak at 16.7 ppm, which was assigned to the distorted β-turn structure, does not appear for G(AG)3. This means that such a shorter peptide tends to form an exclusively antiparallel β-sheet structure and is difficult to form a β-turn structure. Other than the 16.7 ppm peak, the double peak at the lower field was also observed for (AG)n (n = 9 and 12), which could be assigned to the Ala methyl carbons in Structure A (22.2 ppm) and to Structure B (19.6 ppm). The ratio of the two structures, A and B, was approximately 1:2 for (AG)12, as well as (AG)15; but the ratio is slightly different for (AG)9. This means that the heterogeneous structure including the intermolecular arrangements is slightly different in (AG)9 compared with the case of (AG)12 and (AG)15.
Fig. 5.
13C CP/MAS NMR spectra of (a) G(AG)3, (b) (AG)9, (c) (AG)12, and (d) (AG)15 in the silk II forms. The chemical shifts are represented in ppm downfield from TMS. The experimental condition is described in the text.
Generation of heterogeneous structure by changing the stretching ratio
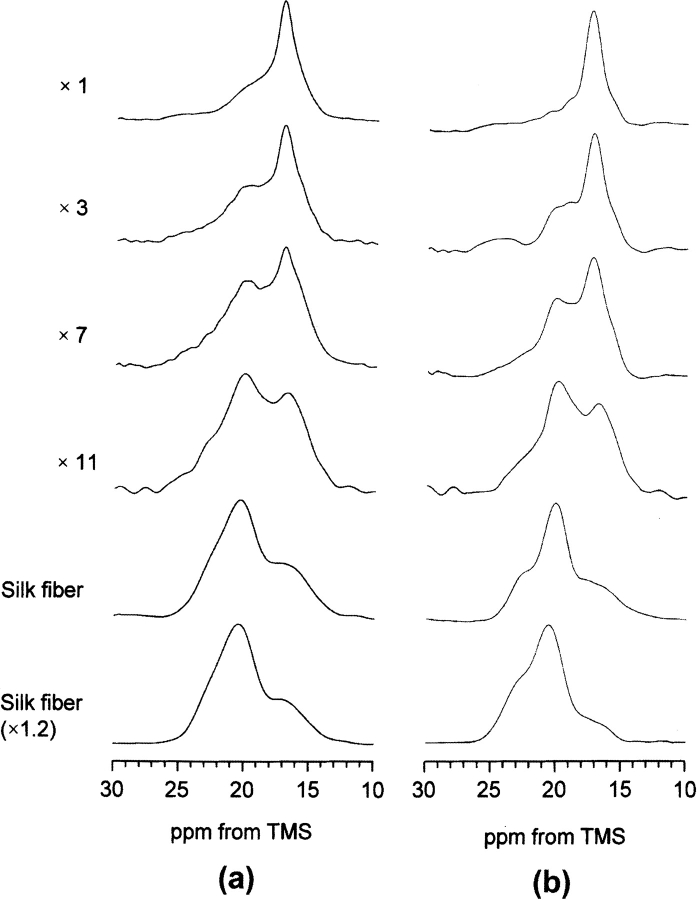
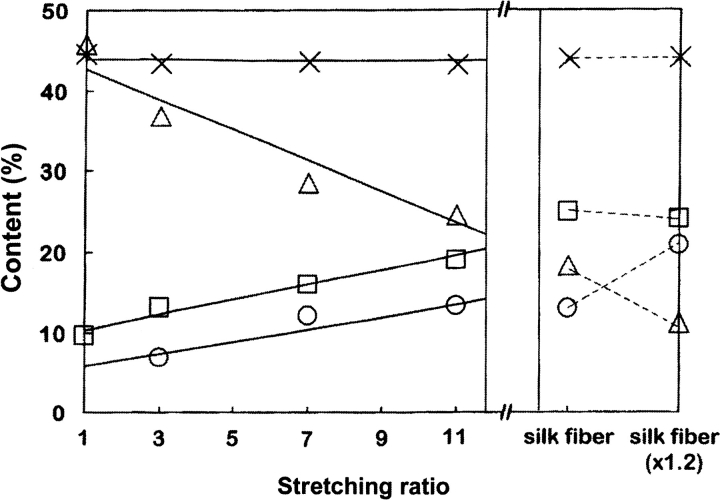
The structural change from silk I to silk II of B. mori silk fibroin prepared from the liquid silk stored in the middle silkgland could be monitored on the basis of the Ala Cβ peaks assigned by us. Figure 6a ▶ shows change in the Ala Cβ peak in the 13C CP/MAS NMR spectra of B. mori silk fibroins with different stretching ratio. The silk fibroin samples were obtained carefully from the gel-like liquid silk stored in the middle silkgland of the fifth larval stage B. mori silkworm and then dried. As shown in Figure 6a ▶ (×1), the Ala Cβ peak of the silk fibroin sample without stretching indicates that this sample is in the silk I form because of the presence of main peak at 16.7 ppm. However, there is also a shoulder on the lower-field side of the main peak. As described above, the Cβ peaks of Ala residues in the semicrystalline domain (44%), which contains Tyr and Val residues, are overlapped with those of the crystalline domain such as (AGSGAG)n, and the former broad double peak was assigned to both distorted β-sheet (21.1 ppm) and distorted β-turn (16.5 ppm) conformations. Thus, it is clear that both the sharp peak (AGSGAG)n in the silk I structure and the broad peak from Tyr-containing regions are present in the silk fibroin sample with silk I form (×1). With increasing the stretching ratio of B. mori silk fibroin, the relative intensity of the peaks at around 19.9 ppm increases, and that at around 16.7 ppm decreases simultaneously. These changes in the spectra correspond to conformational change from silk I to silk II. The Ala Cβ peak from the peptide, (AG)3YG(AG)2VGYG(AG)3Y(AG)3, which is one of the model peptides of the semicrystalline domain, does not change significantly after the silk I and silk II treatments (Asakura et al. 2001b). This means that the spectral changes after stretching occur exclusively in the crystalline domain such as (AGSGAS)n. Thus, we obtained the difference spectra (Fig. 6b ▶) after subtracting Figure 4c ▶ from each spectrum of Figure 6a ▶. The peak at 16.7 ppm becomes broader in Figure 6b ▶. This indicates increases in the distribution of the torsion angles, although the averaged torsion angles maintain those of the silk I form. The increase of the peak intensity at both 22.1 and 19.9 ppm was also observed, although these peaks look like one broad peak. This means the appearance of the heterogeneous silk II form. To clarify the structural change with increasing the stretching ratio quantitatively, the spectral simulation by assuming Gaussian was performed. The results are summarized in Figure 7 ▶. It is noted that the fraction of the peaks at 22.1 and 19.9 ppm increases gradually with keeping the ratio of relative intensities, 2:1, while that of the peak at 16.7 ppm decreases. By further stretching from the silk fiber, the intensity of the peak at 16.7 ppm decreases slightly and the intensities of the peaks at the lower field increase. More than 20% elongation of the silk fiber induces the break of the fiber.
Fig. 6.
(a) Expanded Ala Cβ peaks in the 13C CP/MAS NMR spectra of B. mori silk fibroins with different stretching ratio (×1, ×3, ×7, ×11), native B. mori silk fiber and the stretched sample (×1.2) of the native silk fiber; and (b) the difference spectra (dashed lines) obtained after subtraction of the Ala Cβ peaks of the peptide, (AG)3YG(AG)2VGYG(AG)3YG (AG)3 from the original spectra (a) by assuming the peak area of (AG)3YG(AG)2V GYG(AG)3YG (AG)3 is 44% of total silk fibroin.
Fig. 7.
Change in the content of each proposed secondary structural component in B. mori silk fibroin with stretching. Each symbol represents as follows: ×, distorted β-sheet and distorted β-turn structure such as (AG)3YG(AG)2VGYG(AG)3YG(AG)3; open triangle, distorted β-turn structure of (GAGAGS)n; open squares, β-sheet structure of (GAGAGS)n (alternating Ala methyl group arrangement); and open circles, β-sheet structure of (GAGAGS)n (parallel Ala methyl group arrangement). The detailed interpretation on the latter two cases is given in the text.
Materials and methods
Materials
Model peptides
Model peptides of different sequence motifs of B. mori silk fibroin: (AG)15, (AG)14[3-13C]AG, (AGSGAG)5, (AG)3YG(AG)2 VGYG(AG)3YG(AG)3, GAGAGAG, (AG)9, (AG)12 were synthesized by the F-moc solid-phase method (Pioneer Peptide Synthesizer Co. Ltd ). The samples were obtained as powders by dissolving the peptides in 9 M LiBr and then dialyzing against water for 4 d, followed by lyophilization of peptide solutions. The powders were then dissolved in formic acid and dried to change the structure of the samples to silk II structure (Asakura et al. 1985).
Cp fraction of B. mori silk fibroin
The Cp fraction of B. mori silk fibroin was prepared from regenerated silk fibroin solution as described elsewhere (Strydom et al. 1977; Asakura et al. 1984, 1985). Chymotrypsin (40 mg, Seikagaku Kogyo Co.), dissolved in a few milliliters of water, was added to an aqueous solution of about 4 g of fibroin buffered with Na2HPO4•12H2O and NaH2PO4•2H2O at pH 7.8. The solution (200 mL) was incubated at 40°C for 24 h, and the precipitate that formed (Cp fraction) was separated by centrifuging at 10,000 rpm followed by washing with 0.03 N HCl to inactivate the enzyme reaction. Then the precipitate was washed several times with distilled water, ethyl alcohol, and ethyl ether. Finally, the precipitate was dried in vacuum, yielding 56% of the original fibroin. The structure of this Cp fraction is silk II (Saito et al. 1984; Asakura et al. 1985).
Preparation of silk fibroin with different stretching ratios
B. mori larvae were reared in our laboratory. To obtain silk fibroin with the silk I form, the 8-day-old fifth instar larva was anesthetized in ice-cold water for 10 min. The posterior division of silk glands was pulled out with forceps from a small incision on the abdominal side of the bead-thorax intersegment. The pure silk fibroin was collected by the removal of swelled tissues and washing it repeatedly with ice-cold 1.15% KCl aqueous solution. After immersing it in 0.1% acetic acid for 10 min, the silk sample was stretched gently to the different stretching ratios. The ends of the stretched silk samples were fixed on the stretching apparatus to prevent the relaxation, and dried at room temperature for 1 d prior to the NMR observation.
Preparation of B. mori silk fibroin fiber samples (Demura et al. 1998) was achieved by first loosening the threads on the cocoons by placing them in 100°C water for 5 min. The ends of the cocoon fibers were located, bundled together, and wound onto a glass tube. To remove sericin, the silk fibers were treated with 0.5 w/v% Marseilles soap solution at 100°C for 30 min while on the glass tube and then washed with distilled water prior to drying. The stretching of silk fibroin fiber was carried out after immersing it in water. To prevent the fiber relaxation, the stretched fibers were fixed on the apparatus and dried at room temperature for 1 d.
NMR observation
Solid-state 13C CP/MAS NMR spectra were acquired on a Chemagnetics CMX-400 spectrometer operating at 100 MHz, with a CP contact time of 1 msec, TPPM decoupling, and magic angle spinning at 5 kHz. A total of 10,000–25,000 scans were collected over a spectral width of 60 kHz, with a recycle delay of 3 sec. Chemical shifts are reported relative to TMS as a reference.
Acknowledgments
The authors acknowledge Prof. Anne S. Ulrich at Friedrich-Schiller-Universität Jena, Germany, for stimulating discussions, and support from the Program for Promotion of Basic Research Activities for Innovative Biosciences, Japan.
The publication costs of this article were defrayed in part by payment of page charges. This article must therefore be hereby marked "advertisement" in accordance with 18 USC section 1734 solely to indicate this fact.
Article and publication are at http://www.proteinscience.org/cgi/doi/10.1110/ps.0221702.
References
- Asakura, T. and Kaplan, D.L. 1994. Silk production and processing. In Encyclopedia of agricultural science (ed. C.J. Arutzen), vol. 4, pp. 1–11. Academic Press, New York.
- Asakura, T., Watanabe, Y., and Itoh, T. 1984. NMR of silk fibroin. 3. Assignment of carbonyl carbon resonances and their dependence on sequence and conformation in Bombyx mori silk fibroin using selective isotopic labeling. Macromolecules 17 2421–2426. [Google Scholar]
- Asakura, T., Kuzuhara, A., Tabeta, R., and Saito, H. 1985. Conformational characterization of B. mori silk fibroin in the solid state by high-frequency 13C cross polarization-magic angle spinning NMR, X-ray diffraction and infrared spectroscopy. Macromolecules 18 1841–1845. [Google Scholar]
- Asakura, T., Demura, M., Miyashita, N., Ogawa, K., and Williamson, M.P. 1997a. NMR study of silk I structure of B. mori silk fibroin with 15N- and 13C-NMR chemical shifts contour plots. Biopolymers 41 193–203. [Google Scholar]
- Asakura, T., Minami, M., Shimada, R., Demura, M., Osanai, M., Fujito, T., Imanari, M., and Ulrich, A.S. 1997b. 2H-labeling of silk fibroin fibers and their structural characterization by solid-state 2H NMR. Macromolecules 30 2429–2435. [Google Scholar]
- Asakura, T., Iwadate, M., Demura, M., and Williamson, M.P. 1999. Structural analysis of silk using 13C NMR chemical shift contour plots. Int. J. Biol. Macromol. 24 167–171. [DOI] [PubMed] [Google Scholar]
- Asakura, T., Ashida, J., Yamane, T., Kameda, T., Nakazawa, Y., Ohgo, K., and Komatsu, K. 2001a. A Repeated β-turn structure in Poly (Ala-Gly) as a model for silk I of Bombyx mori silk fibroin studied with two-dimensional spin-diffusion NMR under off magic angle spinning and rotational echo double resonance. J. Mol. Biol. 306 291–305. [DOI] [PubMed] [Google Scholar]
- Asakura, T., Yamane, T., Nakazawa, Y., Kameda, T., and Ando, K. 2001b. Structure of Bombyx mori silk fibroin before spinning in solid state studied with wide angle X-ray scattering and 13C cross-polarization magic angle spinning NMR. Biopolymers 58 521–525. [DOI] [PubMed] [Google Scholar]
- Asakura, T., Sugino, R., Okumura, T., and Nakazawa, Y. 2002a. The role of irregular unit, GAAS, on the secondary structure of Bombyx mori silk fibroin studied with 13C CP/MAS NMR and wide angle X-ray scattering. Protein Sci. 11 1873–1877. [DOI] [PMC free article] [PubMed] [Google Scholar]
- Asakura, T., Sugino, R., Yao, J., Takashima, H., and Kishore, R. 2002b. Structural analysis of semi-crystalline Bombyx mori silk fibroin chain with Silk I and Silk II forms by 13C, 15N and 2H stable isotope labeling, conformation-dependent chemical shifts and solid state NMR spectroscopy. Biochemistry 41 4415–4424. [DOI] [PubMed] [Google Scholar]
- Asakura, T., Yao, J., Yamane, T., Umemura, K., and Ulrich, A. S. 2002c. Heterogeneous structure of silk fibers from Bombyx mori resolved by 13C solid-state NMR. J. Am. Chem. Soc. 124 8794–8795. [DOI] [PubMed] [Google Scholar]
- Demura, M., Minami, M., Asakura, T., and Cross, T.A. 1998. Structure of B. mori silk fibroin based on solid state NMR orientational constraints and fibre diffraction unit cell parameter. J. Am. Chem. Soc. 120 1300–1308. [Google Scholar]
- Fossey, S.A., Nemethy, G., Gibson, K.D., and Scheraga, H.A. 1991. Conformational energy studies of β-sheets of model silk fibroin peptides. I. Sheets of poly(AG) chains. Biopolymers 31 1529–1541. [DOI] [PubMed] [Google Scholar]
- Fraser, R.D.B., and MacRae, T.P. 1973. Conformations of fibrous proteins and related synthetic polypeptides. Academic Press, New York.
- Fraser, R.D.B., MacRae, T.P., and Stewart, F.H.C. 1966. Poly-l-alanylglycyl-l- alanylglycyl-l-serylglycine: A model for the crystalline regions of silk fibroin. J. Mol. Biol. 19 580–582. [DOI] [PubMed] [Google Scholar]
- Gosline, M.J., Guerette, A.P., Ortlepp, S.C., and Savage, N.K. 1999. The mechanical design of spider silk: From fibroin sequence to mechanical function. J. Exp. Biol. 202 3295–3303. [DOI] [PubMed] [Google Scholar]
- He, S.J., Valluzzi, R., and Gido, S.P. 1999. Silk I structure in Bombyx mori silk foams. Int. J. Biol. Macromol. 24 187–195. [DOI] [PubMed] [Google Scholar]
- Ishida, M., Asakura, T., Yokoi, M., and Saito, H. 1990. Solvent- and mechanical-treatment-induced conformational transition of silk fibroin studied by high-resolution solid-state 13C NMR spectroscopy. Macromolecules 23 88–94. [Google Scholar]
- Kameda, T., Nakazawa, Y., Kazuhara, J., Yamane, T., and Asakura, T. 2002. Determination of intermolecular distance of Bombyx mori silk fibroin, GAGAG, with rotational echo double resonance. Biopolymers 64 80–85. [DOI] [PubMed] [Google Scholar]
- Lotz, B. and Cesari, F.C. 1979. The chemical structure and the crystalline structures of Bombyx mori silk fibroin. Biochimie 61 205–214. [DOI] [PubMed] [Google Scholar]
- Lotz, B., Brack, A., and Spach, G. 1974. β structure of periodic copolypeptides of L-alanine and glycine. Their relevance to the structure of silks. J. Mol. Biol. 87 193–203. [DOI] [PubMed] [Google Scholar]
- Lucas, F., Shaw, J.T.B., and Smith, S.G. 1956. Amino-acid sequence in a fraction of Bombyx silk fibroin. Nature 178 861. [Google Scholar]
- Magoshi, J., Mizuide, M., Magoshi, Y., Yakahashi, K., Kubo, M., and Nakamura, S. 1979. Physical properties and structure of silk. VI. Conformational changes in silk fibroin induced by immersion in water at 2 to 130 °C. J. Polym. Sci. Polym. Phys. Ed. 17 515–520. [Google Scholar]
- Marsh, R.E., Corey, R.B., and Pauling, L. 1955. An investigation of the structure of silk fibroin. Biochim. Biophys. Acta 16 1–34. [DOI] [PubMed] [Google Scholar]
- Mita, K., Ichimura, S., and James, T.C. 1994. Highly repetitive structure and its organization of the silk fibroin gene. J. Mol. Evol. 38 583–592. [DOI] [PubMed] [Google Scholar]
- Nicholson, L.K., Asakura, T, Demura, M., and Cross, T.A. 1993. A method for studying the structure of uniaxially aligned biopolymers using solid state 15N-NMR: Application to Bombyx mori silk fibroin fibers. Biopolymers 33 847–861. [DOI] [PubMed] [Google Scholar]
- Okuyama, K., Takanashi, K., Nakajima, Y., Hasegawa, Y., Hirabayashi, K., and Nishi, N. 1988. Analysis of silk I structure by x-ray and electron diffraction methods. J. Seric. Sci. Jpn. 57 23–30. [Google Scholar]
- Saito, H., Tabeta, R., Asakura, T., Iwanaga, Y., Shoji, A., Ozaki, T., and Ando, I. 1984. High-resolution 13C NMR study of silk fibroin in the solid state by the cross-polarization-magic angle spinning method. Conformational characterization of silk I and silk II type forms of B. mori fibroin by the conformation-dependent 13C chemical shifts. Macromolecules 17 1405–1412. [Google Scholar]
- Shimura, K. 1980. Chemical structure of silk fibroin. In Zoku Kenshi no Kozo (Structure of silk fibers) (ed. N. Hojyo), pp. 335–352. Shinshu University, Ueda, Japan.
- Strydom, D.J., Haylett, T., and Stead, R.H. 1977. The amino-terminal sequence of silk fibroin peptide CP—A reinvestigation. Biochem. Biophys. Res. Commun. 3 932–938. [DOI] [PubMed] [Google Scholar]
- Takahashi, Y., Gehoh, M., and Yuzuriha, K. 1999. Structure refinement and diffuse streak scattering of silk (Bombyx mori). Int. J. Biol. Macromol. 24 127–138. [DOI] [PubMed] [Google Scholar]
- Zhou, C.-Z., Confalonieri, F., Medina, N., Zivanovic, Y., Esnault, C., Yang, T., Jacquet, M., Janin, J., Duguet, M., Perasso, R., and Li, Z.-G. 2000. Fine organization of Bombyx mori fibroin heavy chain gene. Nucleic Acids Res. 28 2413–2419. [DOI] [PMC free article] [PubMed] [Google Scholar]
- Zhou, P., Li, G., Shao, Z., Pan, X., and Yu, T. 2001. Structure of Bombyx mori silk fibroin based on the DFT chemical shift calculation. J. Phys. Chem. B. 105 12469–12476. [Google Scholar]


