Abstract
Aberrations of p53 occur in most, if not all, human cancers. In breast cancer, p53 mutation is the most common genetic defect related to a single gene. Immortalized human mammary epithelial cells resemble the earliest forms of aberrant breast tissue growth but do not express many malignancy-associated phenotypes. We created a model of human mammary epithelial tumorigenesis by infecting hTERT-HME1 immortalized human mammary epithelial cells expressing wild-type p53 with four different mutant p53 constructs to determine the role of p53 mutation on the evolution of tumor phenotypes. We demonstrate that different mutant/wild-type p53 heterozygous models generate loss of function, dominant negative activity, and a spectrum of gain of function activities that induce varying degrees of invasive potential. We suggest that this model can be used to elucidate changes that occur in early stages of human mammary epithelial tumorigenesis. These changes may constitute novel biomarkers or reveal novel treatment modalities that could inhibit progression from primary to metastatic breast disease.
Introduction
Inactivation of the tumor suppressor gene p53 occurs in most human cancers [1]. In breast cancer, loss of one p53 allele occurs in 47% to 64% of tumor tissues with no evidence of homozygous deletion and no significant correlation with mutation of the remaining allele [2–5]. Mutation of the p53 gene occurs in 15% to 30% of breast cancers, making this the most common genetic defect related to a single gene [6–9]. Mutation of p53 causes accumulation of the protein that can be detected in tissue by immunohistochemistry [4]. Because the mutant p53 protein is retained and accumulated, it has been hypothesized that it plays a functional role in tumorigenesis.
The role of p53 mutation has often been analyzed in malignantly transformed cancer cell lines that are p53 wild-type or p53 null. These studies have shown that DNA binding domain mutations of p53 produce three possible consequences: loss of wild-type p53 function, dominant negative activity, and gain of function. Mutant p53 was shown to bind DNA less efficiently than wild-type p53, demonstrating a loss of function phenotype [10,11]. Coinfection studies of wild-type and mutant p53 in a p53 null background showed reduced expression of wild-type p53 target genes, which was linked to a concomitant decrease in DNA binding demonstrating a dominant negative activity [12]. Gain of function for mutant p53 was demonstrated in p53 null cancer cell lines through increased growth in soft agar and tumorigenicity in mouse xenografts, which were likely due in part to changes in gene expression caused by the mutant p53 protein [13–19].
Two recent studies have examined the effect of p53 mutant/wild-type heterozygosity on tumor development in mice [20,21]. Knock-in of two mutant p53 alleles, R172H or R270H, in a wild-type p53 background demonstrated specific accumulation of p53 in tumor tissues that did not occur in surrounding normal tissue. Loss of the remaining wild-type p53 allele did occur but was not universal among all tumor types. Although the mutant p53 knock-in mice displayed similar tumor development and organism survival rates to p53 heterozygous knockout mice, there was an increase in osteosarcomas, premalignant epithelial lesions, and carcinomas in response to the mutant p53. Finally, the osteosarcomas and epithelial tumors of these mice were locally invasive or frequently metastasized compared to the p53 heterozygous knockout mice, which completely lacked metastases. Thus, mutant p53 specifically accumulated in tumor tissues, and accumulation was associated with the development of a metastatic phenotype often, despite the presence of a functional wild-type p53 allele.
In the present study, we extend these findings to human mammary epithelial cells (HMEC) by the introduction of four mutant p53 proteins (R175H, R273H, R280K, and R249S) into wild-type p53, hTERT-immortalized HMEC, hTERT-HME1 (HME1), using a lentiviral delivery system. Human mammary epithelial cell culture and immortalization has been studied extensively [22–24]. Ectopic expression of the hTERT gene can rapidly convert postselection HMEC to full immortalization [25]. Recent studies of the continuum of HMEC cultures suggest that immortalized HMEC do resemble some of the earliest forms of aberrant breast tissue growth, but they do not display malignant phenotypes [26]. Culture models suggest that addition of oncogenes such as ZNF217 and activated RAS confer many of the malignancy-associated phenotypes missing in immortalized HMEC [27,28]. Similarly, we used this cell culture model to analyze the effect of mutant/wild-type p53 heterozygosity on malignant phenotypes.
We show that accumulation of exogenous mutant p53 is accompanied by an equivalent increase in wild-type p53 in the HME1 cells. We demonstrate that dominant negative activity of mutant p53 is sufficient to inhibit wild-type p53 binding to DNA and to alter patterns of wild-type p53 target gene expression. Furthermore, we show that accumulation of each mutant p53 results in unique changes in gene expression and a spectrum of increased invasive potential of these cells. The results of our model system agree with previously described functional consequences of p53 mutation and extend the increased invasiveness and metastatic potential of p53 mutant/wild-type heterozygous status to human mammary epithelial cells. This model will be useful for determining how p53 mutation drives the progression of a noninvasive primary tumor to metastatic breast cancer in humans.
Materials and Methods
Cell Culture and Doxorubicin Treatment
The cell lines hTERT-HME1, MDA-MB-468, MDA-MB-231, and BT549 were purchased from the American Type Culture Collection (Rockville, MD). 293FT cells were purchased from Invitrogen (Carlsbad, CA). The hTERT-HME1 cells were grown in mammary epithelial cell growth medium (Cell Applications, San Diego, CA). 293FT cells were grown according to Invitrogen's protocols. The others were cultured as previously described [29]. Doxorubicin (Sigma-Aldrich, St. Louis, MO) was added for 18 hours to the cell culture media at a final concentration of 500 nM.
Adenoviral Infections
Adenovirus containing wild-type p53 with GFP, R175H mutant p53 with GFP, or with GFP alone was the kind gift of Bert Vogelstein and was propagated as previously described [29]. Adenovirus was added to the growth media at 100 plaque-forming units per cell for 24 hours.
Nucleic Acid Isolation
Total RNA was isolated using the RNeasy Mini Kit (Qiagen, Valencia, CA). Genomic DNA was isolated using a DNeasy Blood and Tissue Kit (Qiagen).
Mutant p53 Cloning
Four mutant p53 sequences were isolated from MDA-MB-231 (R280K), MDA-MB-468 (R273H), BT549 (R249S) or the R175H adenovirus. Extensive genomic sequencing analysis of MDA-MB-231 cells conducted by our laboratory show they express only mutant p53 R280K. According to the International Agency for Research on Cancer mutant p53 database, the MDA-MB-468 cells lost the wild-type allele and expressed only mutant p53 R273H. BT549 harbors the mutant p53 R249S, and the status of the other allele is unknown. The p53 sequences were reverse-transcribed using a gene-specific primer and the Superscript III kit (Invitrogen). Blunt-ended polymerase chain reaction (PCR) fragments of the p53 constructs were generated by the Platinum Pfx DNA polymerase kit (Invitrogen). Primer sequences are available on request.
Lentiviral Particle and Stable Cell Line Generation
The four mutant p53 PCR products were cloned into the pLenti6/V5-D-Topo vector (Invitrogen). Each construct was validated for the correct p53 mutation by DNA sequencing. Lentiviral particles were generated by individually transfecting 293FT cells with the four mutant p53 pLenti6/V5 constructs and the ViraPower Packaging Mix with Lipofectamine 2000 according to the manufacturer's protocol (Invitrogen). Stable mutant p53-expressing HME1 cells were generated by infection with lentiviral particles at a 1:100 dilution in growth media with 6 µg/ml polybrene (Sigma-Aldrich). Selection of stably expressing mutant p53 cell lines was conducted with 2 µg/ml blasticidin (Invitrogen).
Immunoprecipitation and Western Blot Analyses
Protein was isolated in radio immunoprecipitation assay buffer and was quantitated by the Bio-Rad Protein Assay (Bio-Rad Laboratories, Hercules, CA). Total protein (1 mg) was precleared. A total of 2 µg of α-V5 (Invitrogen) or IgG2a isotype control antibody (Calbiochem, San Diego, CA) was added and rotated overnight at 4°C. Protein A/G beads (Santa Cruz Biotechnology, Inc., Santa Cruz, CA) were added to each sample for 1 hour, and beads were washed four times in radio immunoprecipitation assay buffer and twice in phosphate-buffered saline (PBS). Immunoprecipitates or 30 µg of total protein lysates was loaded into 7.5% Tris.HCl Ready Gels (Bio-Rad Laboratories), except the V5 Western blot in Figure 1, which was loaded into 10% Tris-HCl Ready Gels (Bio-Rad Laboratories). Blots were incubated with either α-V5 HRP-conjugated antibody (Invitrogen) or α-p53 HRP-conjugated antibody clone DO-1 (Santa Cruz Biotechnology, Inc.) and α-actin clone AC40 (Sigma-Aldrich). For actin, a goat anti-mouse HRP secondary antibody (Santa Cruz Biotechnology, Inc.) was used for detection. Blots were incubated with ECLWestern Blotting Detection Reagents (Amersham Biosciences, Piscataway, NJ) and were exposed to BioMax XAR film (Kodak, Rochester, NY). Western blots from three independent immunoprecipitations were captured and quantitated using the Gel Logic 200 Imaging System and associated software (1D v3.6.4; Kodak).
Figure 1.
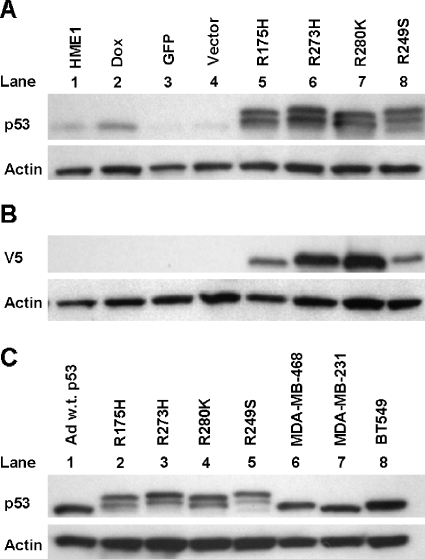
Endogenous wild-type p53 accumulates in response to mutant p53 accumulation. Western blots were conducted with either anti-V5 or anti-p53 clone DO-1 and anti-actin as a loading control. (A) One representative Western blot from three independent experiments shows p53 levels in parental (HME1), doxorubicintreated (DOX), GFP only control (GFP), vector only control (Vector), and mutant p53-expressing HME1 cell lines (R175H, R273H, R280K, and R249S). The double band for p53 in lanes 5 to 8 represents the exogenous V5-tagged mutant p53 as the larger protein and the endogenous wild-type p53 as the smaller protein. (B) One representative Western blot from three independent experiments demonstrates the relative accumulation of the V5-tagged exogenous mutant p53 in each of the mutant p53-expressing HME1 cell lines; labels are the same as panel A. (C) One representative Western blot from three independent experiments of adenoviral wild-type p53 (Ad w.t. p53), mutant p53-expressing HME1 stable cell lines (R175H, R273H, R280K, and R249S), MDA-MB-468, MDAMB-231, and BT549 breast cancer cell lines. The double band for p53 in lanes 2 to 5 represents the exogenous V5-tagged mutant p53 and the endogenous wild-type p53.
Subcellular Localization of p53
Cells grown on coverslips were fixed with 4% paraformaldehyde in PBS, permeabilized with 0.2% Triton X-100, and blocked with 5% BSA. Fixed cells were incubated for 1 hour with α-p53 primary antibody AB-6 clone DO-1 (Calbiochem). Cells were then stained for 1 hour with anti.mouse IgG Cy3 secondary antibody (Sigma-Aldrich). Nuclei were visualized with 4′,6-diamidino-2-phenylindole (Molecular Probes, Inc., Eugene, OR). Coverslips were mounted on glass slides, and stained cells were analyzed using fluorescent microscopy.
Real-Time Reverse Transcription-Polymerase Chain Reaction
Real-time reverse transcription.polymerase chain reaction (RT-PCR) was conducted for WIG1, p21, MDM2, and GAPDH according to the Applied Biosystems (Foster City, CA) protocol as previously described [29]. For TP53I3, STAU-2, E2F5, CDH11, TFPI2, and β-actin, primers were designed for use with the Human Universal Probe Library Set (Roche Diagnostics, Indianapolis, IN) and conducted on an ABI Prism 7000 Sequence Detection System (Applied Biosystems) with a 95°C denaturation for 3 minutes followed by 40 cycles of 95°C for 15 seconds and 60°C for 45 seconds. All experiments were conducted in triplicate from three independent RNA isolations. Primer sequences are available on request.
13k Human Promoter Microarray
Primers were obtained from the Whitehead Institute [30]. Microarray probes were generated from a pooled sample of human mononuclear genomic DNA by PCR (ABgene, Rochester, NY). Products were analyzed by the E-Gel 96 system (Invitrogen), purified using the QIAquick 96 PCR Purification Kit (Qiagen), and quantified using the ND-1000 spectrophotometer (Nanodrop Technologies, Wilmington, DE). DNA was lyophilized and resuspended in 10 µl of 3x SSC for printing onto Ultra GAPS slides (Corning, Lowell, MA) using an OmniGrid robot (GeneMachines, San Carlos, CA). Slides were hydrated and UV cross-linked. Slides were preincubated with 1% BSA, 4x SSC, 0.5% SDS at 42°C, followed by incubation in 1% SDS, 0.25% sodium borohydride at 42°C. Slides were washed in 0.06x SSC, 0.1% SDS, then in 0.06x SSC, and then in double-distilled water.
Microarray Detection of p53 Binding
p53-Specific chromatin immunoprecipitation (ChIP) was performed using antibody clone DO-1 (AB-6; Calbiochem) as previously described, except that the final purification was done using a QIAquick PCR purification kit (Qiagen) [31]. Immunoprecipitated DNA was quantified using PicoGreen dye (Invitrogen). Equal amounts of ChIP and input DNA were amplified using the BioPrime DNA Labeling System (Invitrogen). Second-round amplification was conducted with Cy3 and Cy5 dyes for labeling (GE healthcare, Piscataway, NJ). Labeled DNA was purified using a QIAquick PCR purification kit (Qiagen). Labeled targets were mixed with 20 µg of human Cot-1 DNA (Invitrogen) and 40 µg of yeast tRNA (Invitrogen), dried under vacuum, dissolved in Domino Oligo Hybridization Buffer DMH-25 (Gel Company, San Francisco, CA), and denatured. Samples were hybridized to processed slides in an ArrayBooster (Advalytix AG, Concord, MA) at 42°C for 16 hours. Hybridized slides were washed in 2x SSC, 0.1% SDS, then 0.06x SSC, 0.1% SDS, and finally 0.06x SSC. Slides were scanned using an Axon GenePix 4000 (Axon Instruments, Inc., Foster City, CA). Experiments were done in triplicate using dye swap resulting in six slides per cell line. The data were analyzed using limma package for R [32]. Arrays were normalized using loess function for within array normalization and quantile function for between array normalization. A linear model fit was calculated using input as a common reference. The elements referred to as bound by p53 within this paper were enriched in cell treatments over parental at P value ≤ .01.
Real-Time PCR Verification of ChIP-Chip Analysis
p53-Specific ChIP was performed as described for the microarray in previous paragraphs. Immunoprecipitated DNA was quantified using PicoGreen dye (Invitrogen) and a BioTek FLx800 Multi-Detection Microplate Reader (BioTek Instruments, Winooski, VT). Equal amounts (100 pg) of ChIP and input DNA were used for real-time PCR analysis. Enrichment was calculated as previously described [31]. Primer sequences are available on request. Mutant p53 inhibited binding to an extent that very little DNA was yielded compared to the wild-type p53 infection. The yield from the mutant p53 cell lines was so miniscule it was not possible to assay them with this real-time PCR method.
Microarray Expression Analysis
Total RNA was processed according to the protocol recommended by Affymetrix (Santa Clara, CA). In all, 20 µg of labeled cRNA from each sample was hybridized to the GeneChip Human Genome U133A Plus 2.0 Array (Affymetrix). The expression data were analyzed using GeneSpring GX 7.3.1 (Agilent Technologies, Santa Clara, CA). Data were normalized per chip to the 50th percentile then to the hTERT-HME1 reference cell lines (HME1 parental, vector only lentivirally infected, and GFP adenovirally infected). Gene lists were generated using a two-fold cutoff for both of two replicates of each p53 treatment studied compared to the GFP cell lines for wild-type p53 and vector only for mutant p53.
Flow Cytometry
Parental HME1, vector only control, mutant p53-expressing cell lines, adenoviral GFP, and wild-type p53-infected cells were analyzed in duplicate by flow cytometry. For serum deprivation experiments, parental HME1, vector only control, and mutant p53-expressing cell lines were exposed to basal growth media for 24 hours then subjected to flow cytometry analysis in duplicate. Cells were harvested, washed, and incubated overnight with 95% ethanol. Cells were pelleted and resuspended in PBS, treated with RNase A, and stained with propidium iodide (Sigma-Aldrich). Flow cytometric analysis was performed using a FACScan flow cytometer (BD Biosciences, San Jose, CA) equipped with an air-cooled 15-mW argon ion laser tuned to 488 nm. List mode data files consisting of 10,000 events gated on forward scatter versus side scatter were acquired and analyzed using CellQuest PRO software (BD Biosciences) at a rate of 200 to 400 events per second. Curve fit analysis was prepared using ModFit LT version 3.1 (BD Biosciences).
Cell Proliferation Assay
HME1, vector only, and mutant p53-expressing cells were counted on a Vi-CELL (Beckman Coulter, Inc., Fullerton, CA), and 60,000 cells were plated in T-25 flasks in triplicate at day 0. Cells were counted on a Vi-CELL (Beckman Coulter, Inc.) at days 1, 3, and 5 in triplicate.
Clonogenic Assay
HME1, vector only, and mutant p53-expressing cells were counted on a Vi-CELL (Beckman Coulter, Inc.) and were plated in triplicate at 125, 63, and 31 cells/well dilutions. The cells were grown for 2 weeks and were stained with 500 µl of 0.5% crystal violet in 20% methanol. Colonies were counted manually in triplicate.
Anchorage-Independent Growth
HME1, vector only, mutant p53-expressing cells, and MDA-MB-231 cells were counted on a Vi-CELL (Beckman Coulter, Inc.). A total of 5000 cells were grown in semisolid media consisting of 0.2% agar noble (BD Biosciences) in triplicate for 3 weeks. Cells were stained with 3-(4,5-dimethylthiazol-2-yl)-2,5-diphenyltetrazolium bromide (Sigma-Aldrich) and were counted in triplicate.
Migration and Invasion Assays
Cells were counted on a Vi-CELL (Beckman Coulter, Inc.) and plated in both uncoated and BD BioCoat growth factor.reduced matrigel chambers (BD Biosciences) in quadruplicate for each cell line. A total of 50,000 cells were placed in each chamber and incubated for 48 hours. For the wild-type p53 and GFP control, adenovirus was added 24 hours before counting and plating. The chambers were stained with 50 µl of 0.5% crystal violet in 20% methanol for 1 minute then swabbed on the inside to remove noninvasive cells, washed twice in distilled water, and quantitated. Images of 14 fields, representing 85% of the total surface area, were captured using a x10 objective with a x1.5 optivar on an Olympus IMT-2 microscope (Olympus America Inc., Center Valley, PA), a Hamamatsu ORCA- 100 grayscale CCD camera (Hamamatsu USA, Bridgewater, NJ), and a Ludl motorized XY stage (Ludl Electronic Products, Hawthorne, NY). SimplePCI software version 6.2 (Compix, Inc., Sewickley, PA) controlled the camera and stage, created a binary image, and measured the image for the area. Significance was measured with a one-sided Student's t test comparing vector control and each mutant treatment to the parental cell line.
Results
Generation of Human Mammary Epithelial Model of Tumorigenesis
Four human mutant p53 cDNAs R175H, R273H, R280K, and R249S were cloned, sequence-validated, and packaged as lentiviral particles. These mutations represent the most common point mutations of p53 in breast tissue. Stable HME1 cell lines expressing vector only or cytomegalovirus promoter-driven mutant p53 were created by lentiviral infection and blasticidin selection. The transduced mutant p53 constructs were V5 epitope-tagged to discriminate between exogenous mutant p53 and endogenous wild-type p53 protein in the HME1 cells.
Stably Expressed Mutant p53 Causes Accumulation of the Endogenous Wild-Type Protein
Western blot demonstrated that HME1 parental cells express low but detectable levels of wild-type p53, and control viral infections did not alter this level (Figure 1A). p53 levels in parental HME1 cells increased with doxorubicin treatment, indicating that the endogenous wild-type p53 response is functional (Figure 1A). In addition, mutant p53 accumulated in the transduced HME1 cell lines (Figure 1, A and C, top bands). As expected, no proteins were detected in the HME1, DOX, GFP, and Vector cell lines using the anti-V5 antibody (Figure 1B). The levels of exogenous V5-tagged mutant p53 protein were variable in the HME1 cell lines (Figure 1B). The R273H and R280K mutant protein levels were about 1.5 times higher than the R175H and R249S. The endogenous wild-type p53 protein in the same cells was also accumulated (Figure 1, A and C, bottom bands). Infection with a wild-type p53 adenovirus produced accumulation of the protein to a similar level seen in the mutant p53 stably infected HME1 cell lines (Figure 1C). In the p53 heterozygous HME1 cell lines, mutant p53 accumulates to similar levels as the mutant protein in three breast cancer cell lines (Figure 1C). Taken together, the stable HME1 cell lines highly accumulate mutant p53 to a level seen in breast cancer cell lines, and in response to the mutant protein accumulation, the endogenous wild-type p53 accumulates to a level that can be recapitulated by adenoviral infection of wild-type p53 alone.
Exogenous Mutant and Endogenous Wild-Type p53 Protein Interact
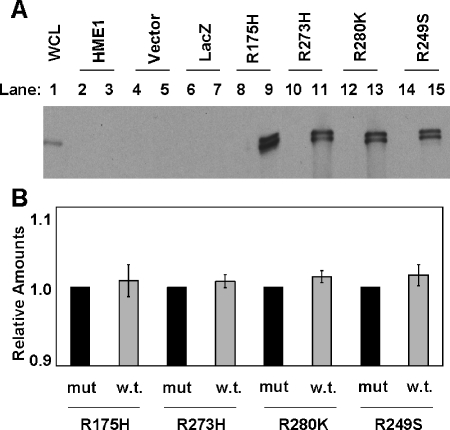
We immunoprecipitated mutant p53 from cell lysates with an antibody against the V5 tag to examine p53 interactions in the HME1 cells. The protein complexes were separated by SDS-PAGE and were probed with p53 antibody. Mutant p53-infected cells revealed an interaction between the exogenous mutant and endogenous wild-type p53 proteins (Figure 2A). Quantification demonstrated equal amounts of mutant and wild-type p53 protein in each immunocomplex, suggesting that they bound in a stoichiometric manner (Figure 2B, compare mut to w.t. for each mutant cell line).
Figure 2.
Endogenous wild-type p53 interacts with accumulated exogenous mutant p53. Immunoprecipitations were conducted with a non-specific antibody, or an anti-V5 antibody that recognizes the exogenous mutant p53 protein. Western blots of the immunoprecipitates were conducted with an anti-p53 clone DO-1 antibody that recognizes both mutant and wild-type p53. (A) One representative Western blot from three independently immunoprecipitated samples. Lane 1 is 30 µg of whole cell lysate (WCL) from HME1 as a positive control for p53. Even lanes 2 to 14 are immunoprecipitates of the nonspecific antibody control. Odd lanes 3 to 15 are V5 antibody-specific immunoprecipitates. (B) Levels of wild-type p53 relative to the mutants in each HME1 mutant p53-expressing cell line. The quantification and standard error of the mean were calculated from Western blots of three independent experiments and show the amounts of wild-type p53 (w.t.) relative to the mutant p53 (mut) in each of the HME1 mutant p53-expressing cell lines (R175H, R273H, R280K, and R249S).
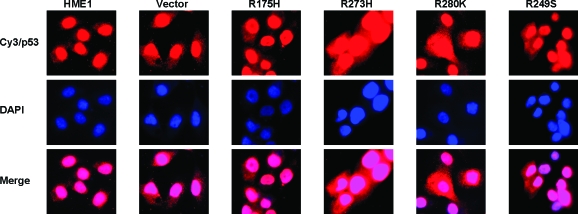
We examined subcellular localization of mutant and wild-type p53. Results showed that mutant and wild-type p53 enter the nucleus in each cell line tested (Figure 3). Taken together, these data show the mutant p53 proteins are not defective either in tetramerization or in nuclear trafficking.
Figure 3.
Mutant p53 does not inhibit nuclear localization of wild-type p53 in HME1 cells. Parental (HME1), vector only control (Vector), and mutant p53 (R175H, R273H, R280K, and R249S) stably expressing HME1 cells were assayed by immunofluorescence for subcellular localization of p53. Cells were stained for p53 with Cy3 (top row, red). Nuclei were counterstained with 4′,6-diamidino-2-phenylindole (middle row, blue). Images were merged to show nuclear localization of p53 in all cell lines (bottom row, pink).
Microarray Expression Analysis Supports the Dominant Negative Activity of Mutant p53
We conducted microarray expression analyses to determine the effect of mutant p53 accumulation on gene expression in HME1 cells. Because wild-type p53 was accumulated in the heterozygous mutant/wild-type p53 HME1 cell lines, HME1 parental cells were also transiently infected with wild-type p53 adenoviruses to produce a comparable level of p53 protein and induce a wild-type-only response [33]. We then compared gene expression changes between wild-type p53 only, and mutant/wild-type p53-expressing HME1 cells. Two independent RNA samples from adenoviral wild-type p53 and the four lentiviral mutant p53-infected cell lines were hybridized to the GeneChip Human Genome U133A Plus 2.0 Array (Affymetrix). Genes were selected as up or down regulated by filtering for genes that showed a two-fold change in both of the duplicate hybridizations relative to the GFP only control for wild-type and vector only control for mutant/wild-type p53-expressing cell lines. Entire gene lists are available on request.
Induction of wild-type p53 from adenoviral infection of HME1 cells caused an increase in the expression of 599 genes (Table 1), including known p53 targets such as p21, MDM2, WIG1, TP53I3, TP53I5, TP73, TP53INP1, CSPG2, PIG11, PIG12, TP53TG1, POLH, PCAF, MASPIN, and APAF1. Wild-type p53 also caused a reduction in the expression of 748 genes (Table 1), such as FEN1, PFS2, CSPG6, CDC2, MCM2, MCM6, MCM7, MSH2, and MSH6, which has been previously demonstrated [34].
Table 1.
Wild-Type p53 Target Gene Changes in Mutant p53-Expressing Cells Compared to Wild-Type p53 Response.
| Wild-Type Changes | Similarity to Wild-Type, n (%) |
||||
| R175H | R273H | R280K | R249S | ||
| Up | 599 | 24 (4.0) | 33 (5.5) | 22 (3.7) | 19 (3.2) |
| Down | 748 | 46 (6.1) | 67 (9.0) | 26 (3.5) | 29 (3.9) |
| Total | 1347 | 70 (5.2) | 90 (6.7) | 48 (3.6) | 48 (3.6) |
The total number of gene changes in HME1 cells in response to wild-type p53 is represented on the left. Similar gene changes in the mutant p53-expressing HME1 cells are presented under each mutation. The percentage of the similar changes relative to wild-type p53 induction is presented in parentheses. The bottom line shows the overall total of up and down gene changes.
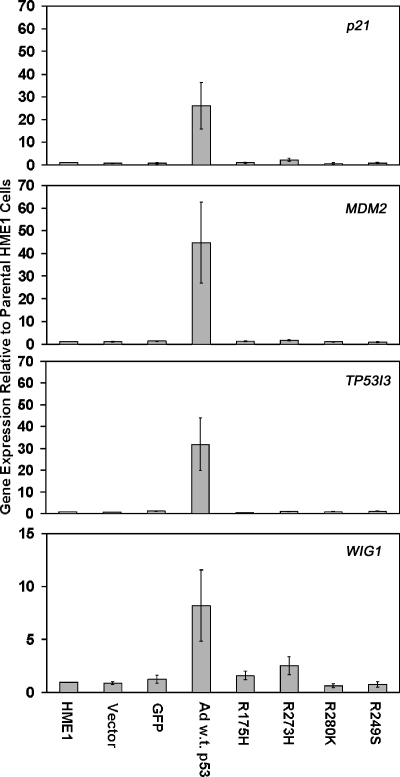
Although there is an equivalent level of wild-type p53 in adenoviralinfected and mutant p53 lentiviral-infected HME1 cells (Figure 1C), mutant p53 blocked changes in expression of the majority of wild-type p53 target genes. Only a small fraction (3.6% to 6.7%) of the genes affected by wild-type p53 was also targeted in the mutant/wild-type p53 HME1 cell lines (Table 1). Real-time RT-PCR confirmed the microarray results for the induction of p21, MDM2, TP53I3, and WIG1 by wild-type p53, and the ability of mutant p53 to block their induction (Figure 4). The gene expression results demonstrated induction of wild-type p53 target genes in cells in response to wild-type p53 alone, but not in cells expressing wild-type and mutant p53. Thus, these data confirm that mutant p53 induces a dominant negative effect on wild-type p53 resulting in a lack of responsiveness of wild-type p53 target genes.
Figure 4.
Real-time RT-PCR confirms dominant negative activity of mutant p53. The bar graphs represent average fold change in expression and standard error of the mean relative to parental HME1 cells for the vector only control, GFP control, wild-type adenoviral p53 (Ad w.t. p53), and the mutant p53-expressing HME1 cell lines (R175H, R273H, R280K, and R249S).
Chromatin Immunoprecipitation Analysis Confirms the Dominant Negative Activity of Mutant p53
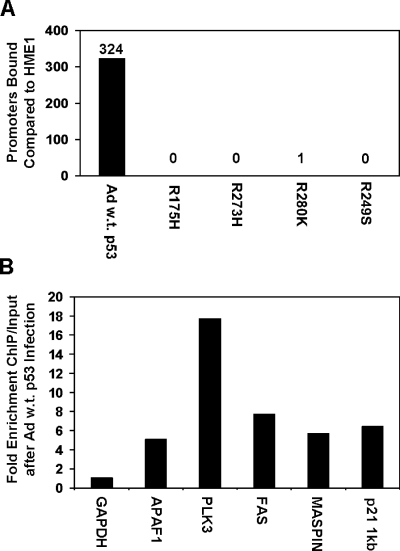
We used chromatin immunoprecipitation (ChIP) coupled to a human promoter microarray to determine genome-wide DNA binding of p53 in our cell lines. DNA-protein complexes were immunoprecipitated with p53 antibody, and then DNA was recovered, fluorescently labeled, and hybridized to a 13,000-element human promoter array. We found that 324 gene promoters were bound by p53 after infection with wild-type p53 adenovirus (Figure 5A). Of these, well-described p53 target genes PCNA, FAS, PLK3, TP53INP1, CSPG2, PIG11, PIG12, TP53TG1, POLH, MASPIN, and APAF1 were identified. The gene expression microarray analysis for wild-type p53 confirmed that TP53INP1, CSPG2, PIG11, PIG12, TP53TG1, POLH, MASPIN, and APAF1 promoter binding resulted in increased expression.
Figure 5.
Mutant p53 inhibits DNA binding of endogenous wildtype p53. (A) Chromatin immunoprecipitation of p53 coupled to a human gene promoter microarray was used to determine p53 binding throughout the genome. Data were analyzed from three independent experiments plus dye swap. The bar graph represents the number of elements bound by p53 in adenoviral wild-type p53-infected HME1 cells (Ad w.t. p53) and the mutant p53-expressing HME1 cells (R175H, R273H, R280K, and R249S) compared to the parental HME1 cells. Differentially bound promoters were determined as explained in materials and methods. (B) Real-time PCR confirms binding of adenoviral wild-type p53 to its target genes. The bar graph represents the fold enrichment over input of the six genes in response to adenoviral wild-type p53 infection. GAPDH is a control that is not bound by p53, as evidenced by no enrichment of ChIP versus input. The other genes confirm the ability of wild-type p53 to bind the promoter regions of these genes in hTERT-HME1 cells after wildtype p53 adenoviral infection.
ChIP coupled to real-time PCR confirmed the promoter microarray analysis. The p53 protein was found binding to the promoters of the identified genes APAF1, PLK3, FAS, and MASPIN in HME1 cells infected with wild-type p53 adenovirus (Figure 5B). GAPDH, a non-p53 target gene, was used as a negative control, and the known p53 target gene p21 was used as a positive control. These data demonstrate that induced wild-type p53 resulted in specific DNA binding of wild-type p53 to the promoters of its target genes, and confirms the specificity of p53 binding determined by the promoter array hybridizations.
Each mutant p53 physically interacts with wild-type p53 and inhibits its binding to p53 target gene promoters (Figures 2A and 5A). Overall, we saw a greater than 99% reduction of DNA binding in HME1 cell lines expressing mutant and wild-type p53 (Figure 5A). Therefore, mutant p53 protein accumulation is sufficient to block specific wild-type p53-DNA interactions. These data explain and complement the expression data, demonstrating a dominant negative activity of mutant p53.
Microarray Expression Analysis Demonstrates Gain of Function for Mutant p53
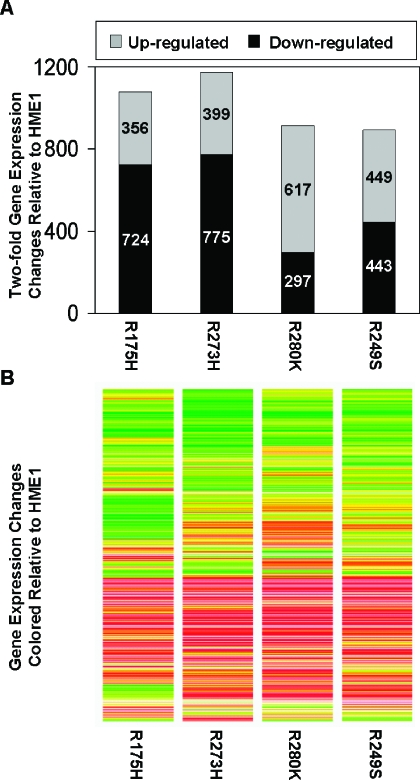
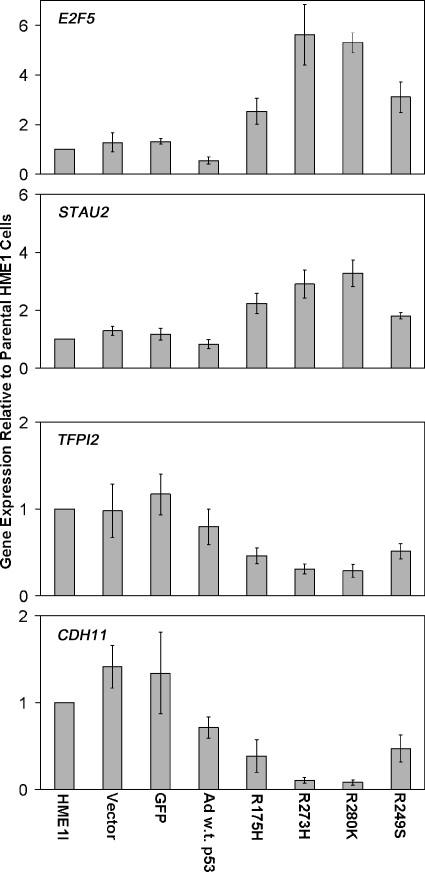
Although mutant p53 diminished the expression of wild-type p53 targets, each mutant p53 induced novel gene expression differences (Figure 6A). The total number and direction of two-fold gene expression changes induced by each mutant p53 were variable (Figure 6A). However, the trends of gene expression changes among the mutant p53-expressing cell lines were very similar (Figure 6B). Each mutant p53 caused an overlapping but unique spectrum of gene expression changes compared to each other, as has been previously reported [13,14]. STAU2 and E2F5 are two examples of genes upregulated in all of the mutant p53-expressing cell lines, but not in wild-type p53-induced cells. Real-time RT-PCR confirmed increases in the expression of these genes in response to mutant p53 accumulation (Figure 7). CDH11 and TFPI2 are two examples of genes downregulated by mutant p53, and real-time RT-PCR verified their decreased expression (Figure 7). These changes are possibly indirect effects of mutant p53 accumulation, because we did not detect p53 binding on the promoter array for any genes in response to mutant p53. These data demonstrate that even in the presence of wild-type p53, the mutant protein can induce novel gene expression changes that support a gain of function role for the mutant p53 proteins. Entire gene lists are available on request.
Figure 6.
Mutant p53 alters patterns of gene expression in HME1 cells. Microarray expression analysis was conducted to determine gene expression changes in response to mutant p53 accumulation in HME1 cells. (A) The bar graph represents the number of genes whose expression changed at least two-fold in response to mutant p53-expressing HME1 cell lines (R175H, R273H, R280K, and R249S). The top of each bar represents elements that were increased in expression. The bottom of each bar represents elements that were decreased in expression. The actual numbers of increased and decreased elements are embedded in the corresponding area of the graphs. (B) The heat map represents the trends in gene expression in response to mutant p53. It shows the expression levels in each mutant p53 cell line of every gene that was found differentially expressed in at least one treatment from panel A. Red and green indicate increases and decreases in expression, respectively.
Figure 7.
Real-time RT-PCR confirms novel expression changes induced by mutant p53. The bar graphs represent average fold change in expression and standard error of the mean relative to parental HME1 cells for the vector only control, GFP control, wild-type adenoviral p53 (Ad w.t. p53), and the mutant p53-expressing HME1 (R175H, R273H, R280K, and R249S) cell lines.
Mutant p53 Does Not Induce Many Malignant Properties in HME1 Cells
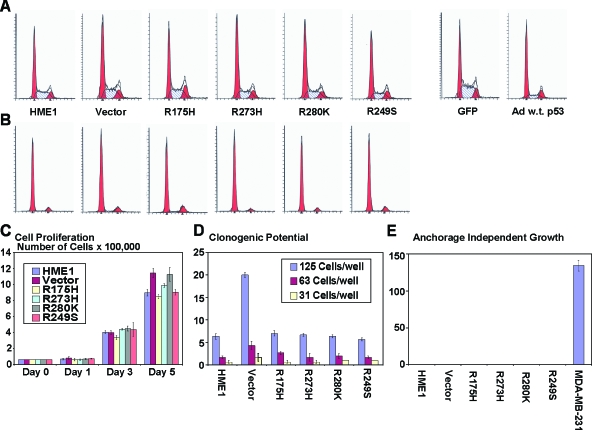
We conducted extensive analyses with the HME1 cells expressing mutant p53 to test the acquisition of hallmark malignant phenotypes in these cells. Flow cytometric analysis revealed that although there was more wild-type p53 in the mutant p53-expressing cell lines they were not susceptible to G1 arrest that is induced by wild-type p53 accumulation alone (Figure 8A). Additionally, in response to serum deprivation, all cell lines arrested in G1 regardless of the expression of mutant p53 (Figure 8B). Cell proliferation of HME1 cells was not affected by accumulation of mutant p53, because each cell line tested showed similar growth rates (Figure 8C). A dilution series of the HME1 cell lines also demonstrated no difference between the parental HME1 cells and cell lines with accumulated mutant p53 protein (Figure 8D). Finally, none of the HME1 cell lines grew in semisolid media, as opposed to MDA-MB-231 cells, which readily formed colonies (Figure 8E). Taken together, the mutant p53 expressed in HME1 cells did not increase cell proliferation, clonogenic potential, anchorage-independent growth, or cell cycle distribution in an untreated or serum-deprived state. These results suggest that mutant p53 when expressed with wild-type p53 in HMEC does not confer many of the properties associated with malignant transformation.
Figure 8.
Mutant p53 has no effect on a variety of phenotypes associated with tumor cells. (A) One representative depiction of cell cycle distribution demonstrates that the accumulation of different mutant p53 proteins has no effect on the cell cycle. Addition of wild-type p53 induces a G1 arrest. (B) One representative depiction of cell cycle distribution following serum deprivation demonstrates G1 arrest in all samples. Labels are the same from panel A. (C) The bar graph represents the average cell number and standard error of the mean for each cell line at the indicated days. The y-axis is cell number x 100,000. (D) The bar graph represents the average number of colonies and the standard error of the mean for each cell line at the indicated cell dilutions. (E) The bar graph represents the average and standard error of the mean of colonies grown in semisolid media for each cell line. MDA-MB-231 cells were used as a positive control.
Mutant p53 Increases Migration and the Invasive Potential of hTERT-HME1 Cells
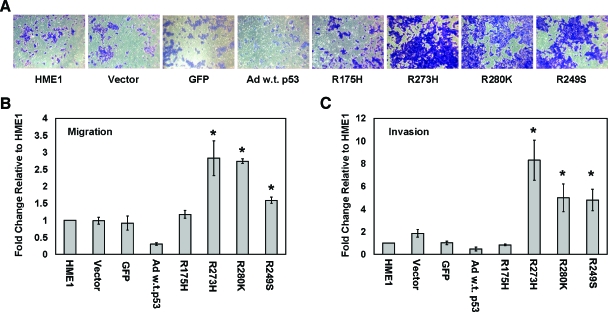
Although mutant p53 did not alter many phenotypes associated with malignant transformation, it did change the migratory and invasive potential of the HME1 cells. We conducted transwell assays to determine the migratory and invasive potential of the parental and vector control HME1 cells compared to the stably expressing mutant p53 HME1 cell lines. Cells expressing three of the four mutant p53 constructs, R273H, R280K, and R249S demonstrated increased migration (Figure 9A). On uncoated transwells, the R273H-, R280K-, and R249S-expressing HME1 cells migrated three-, three-, and two-fold, respectively, more than HME1 parental cells, P value < .03 (Figure 9B). On matrigel-coated transwells, the R273H-, R280K-, and R249S-expressing HME1 cell lines demonstrated an eight-, five-, and five-fold increase, respectively, in invasive potential compared to the parental HME1 cells, which was statistically significant, P value < .02 (Figure 9C). The parental, vector control, and R175H HME1 cell lines demonstrated minimal and insignificant differences in migration and invasion (Figure 9, B and C). The differences in migration and invasive potential may be a result of the unique spectrum of gene expression differences caused by the different mutant p53 proteins. Wild-type p53 caused a reduction in both migration and invasion compared to the parental and GFP adenovirally infected control cells (Figure 9, A–C). This reduction likely occurs because of the cell cycle arrest and cell death induced by the accumulation of wild-type p53 within the time frame of the assay.
Figure 9.
Mutant p53 accumulation causes an increase in migration and invasiveness of hTERT-HME1 cells. Migration assays using uncoated inserts and invasion assays using matrigel-coated inserts were performed on the parental HME1 cell line (HME1), vector only control HME1 cell line (Vector), adenoviral GFP control (GFP), adenoviral infected wild-type p53 (Ad w.t. p53), and mutant p53-expressing HME1 cell lines (R175H, R273H, R280K, and R249S). (A) Representative pictures of cells that migrated through the pores of the uncoated inserts visualized by staining with crystal violet. (B) The bar graph represents the average fold difference of migration relative to the parental HME1 cells through uncoated inserts. (C) The bar graph represents the average fold difference of invasion relative to the parental HME1 cells through matrigel-coated inserts. The cell lines were assayed in quadruplicate transwells for each experiment, and the averages were graphed with the standard error of the mean. The asterisks indicate that R273H, R280K, and R249S showed a statistically significant increase from the parental cell lines, P value < .05.
Discussion
A multitude of previous studies have suggested a number of functions for mutant p53 by expressing it in a variety of malignantly transformed cells that were p53 null or wild-type. We have created a unique model by stably infecting nonmalignantly transformed, immortalized HMEC with mutant p53 to determine the role of p53 heterozygosity in tumorigenesis and malignancy acquisition. In this model, accumulation of mutant p53 protein levels was similar to that seen in three breast cancer cell lines. Interestingly, each mutant p53 in the cancer cell lines was slightly different in size, consistent with differences found previously [8]. The mutant p53 consistently maintained the differences in size when expressed in the HME1 cell lines. The change in size likely reflects differing posttranslational modifications that are unique to each mutant and occur when that protein is expressed in any cell. Because we show that the mutant and wild-type p53 proteins interact, the wild-type protein also likely receives the same posttranslational modification as the mutant p53 protein. Therefore, the wild-type p53 protein is consistently different in size from the exogenous mutant by the size of the V5 tag, but among the HME1 mutant p53-expressing cell lines, each mutant and wild-type p53 protein are slightly different. Interestingly, the elevated levels of mutant p53 protein were matched by a concomitant increase in the endogenous wild-type p53.
We demonstrated that cellular p53 immunocomplexes were composed of equal amounts of wild-type and mutant p53, consistent with earlier studies [35]. We predict that the resultant accumulation of endogenous wild-type p53 was likely due to the stabilization induced by the interaction with the constitutively expressed exogenous mutant protein. Additionally, we demonstrated by immunofluorescence that the mutant/wild-type p53 complexes were capable of entering the nucleus. Thus, the missense mutation in the selected mutant p53 proteins does not inhibit tetramerization or nuclear localization.
We compared genome-wide DNA binding and gene expression profiles of the wild-type p53-induced and mutant p53-expressing HME1 cell lines. We showed that induction of wild-type p53 alone causes binding to a multitude of promoter regions in the genome that are associated with expression changes of wild-type p53 target genes. Mutant p53 inhibited the ability of wild-type p53 to bind the DNA of promoters of wild-type p53 target genes, and this inhibition was recapitulated by changes in expression of only a small percentage of wild-type p53 target genes in the mutant/wild-type heterozygous cell lines. Therefore, the mutant p53 protein is unable to bind DNA and blocks the ability of wild-type p53 present in the same cells from binding the response elements of target genes and changing their level of expression. These results confirm the dominant negative activity of mutant p53 and suggest that the accumulated endogenous wild-type p53 is tolerated in the HME1 cells through the inhibitory effects of the exogenous mutant p53.
Although the ChIP analysis demonstrated that DNA binding was inhibited by mutant p53, each mutant p53 in the modeled heterozygous state caused gene expression changes in the stably expressing cell lines. It is possible that these gene changes reflect interference of wild-type p53 by each mutant, but most of the genes that are changed are not influenced by wild-type p53. Thus, the mutant p53 enacts gene expression changes unique from inhibition of wild-type p53, and without detectable DNA binding at the relevant control regions. It is possible that the promoter array was not sensitive enough to detect mutant p53 binding, but this is unlikely because it easily detected binding by wild-type p53. An alternative hypothesis is that mutant p53 enacts gene expression changes through an indirect interaction with promoters by protein-protein interactions with other transcription factors. Indeed, previous studies have demonstrated that mutant p53 binds the transcription factors ETS, SP1, and NF-Y influencing their activity [36–38]. The cross-linking used in this analysis was not optimized to detect this type of protein-protein-DNA interaction. These results confirm mutant p53 gain of function demonstrated previously in p53 null cancer cells and show that mutant p53 gain of function can be demonstrated in a cellular background that contains wild-type p53.
Interestingly, we demonstrated that mutant p53 accumulation in HME1 had no effect on cell proliferation, clonogenicity, anchorage-independent growth, or cell cycle distribution. Mutant p53 has been shown to influence these malignant properties in other cell types and models, but often the mutant p53 was expressed in previously transformed cells in a p53 null background. Our data suggest that, at least in nonmalignant HMEC expressing wild-type p53, the mutant p53 has no affect on these phenotypes. It may be that other defects common to malignant transformation are necessary to complement the p53 mutation, the remaining wild-type p53 allele must be lost to gain these additional phenotypes, or that the effects of p53 mutation are tissue- and cell type-specific.
Although many malignant phenotypes were not acquired, we found that introduction of mutant p53 increases the migratory and invasive potential of human mammary epithelial cells harboring wild-type p53. Interestingly, each mutant conferred differing levels of invasive potential from none (R175H) to high (R273H), possibly paralleling the unique gene expression changes induced by each mutant. In each mutant p53-expressing HME1 cell lines, the genes TFPI-2, TPM1, and CLCA2 were downregulated. In pancreatic ductal adenocarcinomas, the TFPI-2 gene is silenced by epigenetic inactivation, and reexpression of the gene in Panc1 cells reduces migration and invasion [39]. TPM1 gene expression was previously found reduced in MDA-MB- 231 cells in response to cytosine methylation, and reexpression of the gene reduced migration in the MDA-MB-231 cells [40]. CLCA2 expression is lost in malignant MDA-MB-231 and MDA-MB-468 cells, and reintroduction of this gene in MDA-MB-231 cells reduces in vitro matrigel invasion and metastatic tumors in nude mice [41]. Because these genes were downregulated in all of the mutant p53-expressing cell lines, they cannot fully explain the acquisition of migration and invasion, because all of the cell lines should have changed and the R175H did not. It is interesting to note that the R175H cell line had the most differences in expression compared to the other mutant p53 cell lines (Figure 6B). It may be that other gene changes induced a compensatory mechanism in the R175H cell line or that other changes that are needed to become migratory and invasive were absent in this cell line. Thus, each mutant p53 may have caused differing levels of migration and invasiveness because each caused a unique spectrum of gene expression changes. Alternatively, mutant p53 protein may interact with other proteins differently than its wild-type counterpart causing changes in invasive potential. Previous studies with p53 null human cancer cells exogenously expressing mutant p53 have shown increased invasion and metastasis in mouse xenograft models [17–19]. Recent studies demonstrated that R273H mutant p53 can increase migration and invasion of wild-type p53-expressing endometrial cancer HHUA cells [42]. Mouse mutant p53 knock-in models also suggest a role for mutant p53 in metastasis and invasion [20,21]. These results taken with ours suggest that, even in the presence of wild-type p53, certain p53 mutations can increase cellular invasiveness.
In conclusion, we have developed a novel model system using nonmalignant cells that is in agreement with the previously described functional consequences of mutant p53 elucidated in malignant cells and extends the increased invasiveness and metastatic potential of p53 mutant/wild-type heterozygous status found in knock-in mouse models to human mammary epithelial cells. Future studies will be aimed at the elucidation of interactions of mutant p53 protein with other protein partners and the mechanism of gene expression changes induced by mutant p53. This model represents the earliest stages of tumorigenesis and will be useful for determining how p53 mutation drives the progression of noninvasive primary to metastatic breast cancer in humans to create more effective treatment modalities to block this important, early step in tumorigenesis.
Acknowledgments
We thank the ARL Division of Biotechnology Cytometry Core Facility for generating the flow cytometry data (http://cytometry.arl.arizona.edu).
Abbreviations
- APAF1
apoptotic peptidase activating factor 1
- CDH11
cadherin 11
- ChIP
chromatin immunoprecipitation
- CSPG2
versican
- E2F5
E2F transcription factor 5
- FAS
TNF receptor superfamily member 6
- GAPDH
glyceraldehyde-3-phosphate dehydrogenase
- GFP
green fluorescent protein
- HME1
hTERT-immortalized human mammary epithelial cells
- HMEC
human mammary epithelial cells
- MASPIN
mammary serine protease inhibitor
- MDM2
mouse double minute
- p21
cyclin-dependent kinase inhibitor 1A
- PIG11
p53-induced gene 11
- PIG12
p53-induced gene 12
- PLK3
Polo-like kinase 3
- POLH
polymerase (DNA-directed) eta
- STAU-2
staufen RNA binding protein homolog 2
- TFPI2
tissue factor pathway inhibitor 2
- TP53I3
p53-inducible protein 3
- TP53INP1
p53-inducible nuclear protein 1
- TP53TG1
p53 target gene 1
- WIG1
wild-type p53-induced gene 1
Footnotes
We thank Bert Vogelstein for the control and p53 adenoviruses. We thank Douglas W. Cromey, M.S. of the Department of Cell Biology & Anatomy and the Southwest Environmental Health Sciences Center/National Institute of Environmental Health Sciences (NIEHS) grant ES06694 for microscopy. We thank José Muñoz-Rodríguez for generating microarray data at the University of Arizona Genomics Shared Service supported by NIEHS grant ES06694, National Institutes of Health (NIH) grant CA23074, and the Bio-5 Institute. D.J. J. was supported in part by a Cancer Biology Training grant CA09213 and an Integrative Graduate Education and Research Traineeship grant NSF DGE 0114420. B.W. F. was supported by NIH grant CA65662. The Arizona Cancer Center also supported this work.
References
- 1.Vogelstein B, Lane D, Levine AJ. Surfing the p53 network. Nature. 2000;408:307–310. doi: 10.1038/35042675. [DOI] [PubMed] [Google Scholar]
- 2.Chen LC, Neubauer A, Kurisu W, Waldman FM, Ljung BM, Goodson W, III, Goldman ES, Moore D, II, Balazs M, Liu E, et al. Loss of heterozygosity on the short arm of chromosome 17 is associated with high proliferative capacity and DNA aneuploidy in primary human breast cancer. Proc Natl Acad Sci USA. 1991;88:3847–3851. doi: 10.1073/pnas.88.9.3847. [DOI] [PMC free article] [PubMed] [Google Scholar]
- 3.Chen YH, Li CD, Yap EP, McGee JO. Detection of loss of heterozygosity of p53 gene in paraffin-embedded breast cancers by non-isotopic PCR-SSCP. J Pathol. 1995;177:129–134. doi: 10.1002/path.1711770205. [DOI] [PubMed] [Google Scholar]
- 4.Deng G, Chen LC, Schott DR, Thor A, Bhargava V, Ljung BM, Chew K, Smith HS. Loss of heterozygosity and p53 gene mutations in breast cancer. Cancer Res. 1994;54:499–505. [PubMed] [Google Scholar]
- 5.Singh S, Simon M, Meybohm I, Jantke I, Jonat W, Maass H, Goedde HW. Human breast cancer: frequent p53 allele loss and protein overexpression. Hum Genet. 1993;90:635–640. doi: 10.1007/BF00202481. [DOI] [PubMed] [Google Scholar]
- 6.Elledge RM, Allred DC. The p53 tumor suppressor gene in breast cancer. Breast Cancer Res Treat. 1994;32:39–47. doi: 10.1007/BF00666204. [DOI] [PubMed] [Google Scholar]
- 7.Iacopetta B, Grieu F, Powell B, Soong R, McCaul K, Seshadri R. Analysis of p53 gene mutation by polymerase chain reaction-single strand conformation polymorphism provides independent prognostic information in node-negative breast cancer. Clin Cancer Res. 1998;4:1597–1602. [PubMed] [Google Scholar]
- 8.Runnebaum IB, Nagarajan M, Bowman M, Soto D, Sukumar S. Mutations in p53 as potential molecular markers for human breast cancer. Proc Natl Acad Sci USA. 1991;88:10657–10661. doi: 10.1073/pnas.88.23.10657. [DOI] [PMC free article] [PubMed] [Google Scholar]
- 9.Sjogren S, Inganas M, Norberg T, Lindgren A, Nordgren H, Holmberg L, Bergh J. The p53 gene in breast cancer: prognostic value of complementary DNA sequencing versus immunohistochemistry. J Natl Cancer Inst. 1996;88:173–182. doi: 10.1093/jnci/88.3-4.173. [DOI] [PubMed] [Google Scholar]
- 10.Kern SE, Kinzler KW, Baker SJ, Nigro JM, Rotter V, Levine AJ, Friedman P, Prives C, Vogelstein B. Mutant p53 proteins bind DNA abnormally in vitro. Oncogene. 1991;6:131–136. [PubMed] [Google Scholar]
- 11.Steinmeyer K, Deppert W. DNA binding properties of murine p53. Oncogene. 1988;3:501–507. [PubMed] [Google Scholar]
- 12.Willis A, Jung EJ, Wakefield T, Chen X. Mutant p53 exerts a dominant negative effect by preventing wild-type p53 from binding to the promoter of its target genes. Oncogene. 2004;23:2330–2338. doi: 10.1038/sj.onc.1207396. [DOI] [PubMed] [Google Scholar]
- 13.O'Farrell TJ, Ghosh P, Dobashi N, Sasaki CY, Longo DL. Comparison of the effect of mutant and wild-type p53 on global gene expression. Cancer Res. 2004;64:8199–8207. doi: 10.1158/0008-5472.CAN-03-3639. [DOI] [PubMed] [Google Scholar]
- 14.Scian MJ, Stagliano KE, Ellis MA, Hassan S, Bowman M, Miles MF, Deb SP, Deb S. Modulation of gene expression by tumor-derived p53 mutants. Cancer Res. 2004;64:7447–7454. doi: 10.1158/0008-5472.CAN-04-1568. [DOI] [PubMed] [Google Scholar]
- 15.Tepper CG, Gregg JP, Shi XB, Vinall RL, Baron CA, Ryan PE, Desprez PY, Kung HJ, deVere White RW. Profiling of gene expression changes caused by p53 gain-of-function mutant alleles in prostate cancer cells. Prostate. 2005;65:375–389. doi: 10.1002/pros.20308. [DOI] [PubMed] [Google Scholar]
- 16.Weisz L, Zalcenstein A, Stambolsky P, Cohen Y, Goldfinger N, Oren M, Rotter V. Transactivation of the EGR1 gene contributes to mutant p53 gain of function. Cancer Res. 2004;64:8318–8327. doi: 10.1158/0008-5472.CAN-04-1145. [DOI] [PubMed] [Google Scholar]
- 17.Dittmer D, Pati S, Zambetti G, Chu S, Teresky AK, Moore M, Finlay C, Levine AJ. Gain of function mutations in p53. Nat Genet. 1993;4:42–46. doi: 10.1038/ng0593-42. [DOI] [PubMed] [Google Scholar]
- 18.Hsiao M, Low J, Dorn E, Ku D, Pattengale P, Yeargin J, Haas M. Gain-of-function mutations of the p53 gene induce lymphohematopoietic metastatic potential and tissue invasiveness. Am J Pathol. 1994;145:702–714. [PMC free article] [PubMed] [Google Scholar]
- 19.Shaulsky G, Goldfinger N, Rotter V. Alterations in tumor development in vivo mediated by expression of wild type or mutant p53 proteins. Cancer Res. 1991;51:5232–5237. [PubMed] [Google Scholar]
- 20.Lang GA, Iwakuma T, Suh YA, Liu G, Rao VA, Parant JM, Valentin-Vega YA, Terzian T, Caldwell LC, Strong LC, et al. Gain of function of a p53 hot spot mutation in a mouse model of Li-Fraumeni syndrome. Cell. 2004;119:861–872. doi: 10.1016/j.cell.2004.11.006. [DOI] [PubMed] [Google Scholar]
- 21.Olive KP, Tuveson DA, Ruhe ZC, Yin B, Willis NA, Bronson RT, Crowley D, Jacks T. Mutant p53 gain of function in two mouse models of Li-Fraumeni syndrome. Cell. 2004;119:847–860. doi: 10.1016/j.cell.2004.11.004. [DOI] [PubMed] [Google Scholar]
- 22.Stampfer MR, Yaswen P. Culture models of human mammary epithelial cell transformation. J Mammary Gland Biol Neoplasia. 2000;5:365–378. doi: 10.1023/a:1009525827514. [DOI] [PubMed] [Google Scholar]
- 23.Stampfer MR, Yaswen P. Human epithelial cell immortalization as a step in carcinogenesis. Cancer Lett. 2003;194:199–208. doi: 10.1016/s0304-3835(02)00707-3. [DOI] [PubMed] [Google Scholar]
- 24.Yaswen P, Stampfer MR. Molecular changes accompanying senescence and immortalization of cultured human mammary epithelial cells. Int J Biochem Cell Biol. 2002;34:1382–1394. doi: 10.1016/s1357-2725(02)00047-x. [DOI] [PubMed] [Google Scholar]
- 25.Stampfer MR, Garbe J, Levine G, Lichtsteiner S, Vasserot AP, Yaswe P. Expression of the telomerase catalytic subunit, hTERT, induces resistance to transforming growth factor beta growth inhibition in p16INK4A(-) human mammary epithelial cells. Proc Natl Acad Sci USA. 2001;98:4498–4503. doi: 10.1073/pnas.071483998. [DOI] [PMC free article] [PubMed] [Google Scholar]
- 26.Li Y, Pan J, Li JL, Lee JH, Tunkey C, Saraf K, Garbe JC, Whitley MZ, Jelinsky SA, Stampfer MR, et al. Transcriptional changes associated with breast cancer occur as normal human mammary epithelial cells overcome senescence barriers and become immortalized. Mol Cancer. 2007;6:7. doi: 10.1186/1476-4598-6-7. [DOI] [PMC free article] [PubMed] [Google Scholar]
- 27.Nonet GH, Stampfer MR, Chin K, Gray JW, Collins CC, Yaswen P. The ZNF217 gene amplified in breast cancers promotes immortalization of human mammary epithelial cells. Cancer Res. 2001;61:1250–1254. [PubMed] [Google Scholar]
- 28.Rao K, Alper O, Opheim KE, Bonnet G, Wolfe K, Bryant E, O'Hara Larivee S, Porter P, McDougall JK. Cytogenetic characterization and H-ras associated transformation of immortalized human mammary epithelial cells. Cancer Cell Int. 2006;6:15. doi: 10.1186/1475-2867-6-15. [DOI] [PMC free article] [PubMed] [Google Scholar]
- 29.Oshiro MM, Watts GS, Wozniak RJ, Junk DJ, Munoz-Rodriguez JL, Domann FE, Futscher BW. Mutant p53 and aberrant cytosine methylation cooperate to silence gene expression. Oncogene. 2003;22:3624–3634. doi: 10.1038/sj.onc.1206545. [DOI] [PubMed] [Google Scholar]
- 30.Odom DT, Zizlsperger N, Gordon DB, Bell GW, Rinaldi NJ, Murray HL, Volkert TL, Schreiber J, Rolfe PA, Gifford DK, et al. Control of pancreas and liver gene expression by HNF transcription factors. Science. 2004;303:1378–1381. doi: 10.1126/science.1089769. [DOI] [PMC free article] [PubMed] [Google Scholar]
- 31.Wozniak RJ, Klimecki WT, Lau SS, Feinstein Y, Futscher BW. 5-Aza-2′-deoxycytidine-mediated reductions in G9A histone methyltransferase and histone H3 K9 di-methylation levels are linked to tumor suppressor gene reactivation. Oncogene. 2007;26:77–90. doi: 10.1038/sj.onc.1209763. [DOI] [PubMed] [Google Scholar]
- 32.Smyth GK. Limma: linear models for microarray data. In: Gentleman R, Dudoit S, Irizarry R, Huber W, editors. Bioinformatics and Computational Biology Solutions Using R and Bioconductor. New York: Springer; 2005. pp. 397–420. [Google Scholar]
- 33.He TC, Zhou S, da Costa LT, Yu J, Kinzler KW, Vogelstein B. A simplified system for generating recombinant adenoviruses. Proc Natl Acad Sci USA. 1998;95:2509–2514. doi: 10.1073/pnas.95.5.2509. [DOI] [PMC free article] [PubMed] [Google Scholar]
- 34.Spurgers KB, Gold DL, Coombes KR, Bohnenstiehl NL, Mullins B, Meyn RE, Logothetis CJ, McDonnell TJ. Identification of cell cycle regulatory genes as principal targets of p53-mediated transcriptional repression. J Biol Chem. 2006;281:25134–25142. doi: 10.1074/jbc.M513901200. [DOI] [PubMed] [Google Scholar]
- 35.Milner J, Medcalf EA. Cotranslation of activated mutant p53 with wild type drives the wild-type p53 protein into the mutant conformation. Cell. 1991;65:765–774. doi: 10.1016/0092-8674(91)90384-b. [DOI] [PubMed] [Google Scholar]
- 36.Chicas A, Molina P, Bargonetti J. Mutant p53 forms a complex with Sp1 on HIV-LTR DNA. Biochem Biophys Res Commun. 2000;279:383–390. doi: 10.1006/bbrc.2000.3965. [DOI] [PubMed] [Google Scholar]
- 37.Di Agostino S, Strano S, Emiliozzi V, Zerbini V, Mottolese M, Sacchi A, Blandino G, Piaggio G. Gain of function of mutant p53: the mutant p53/NF-Y protein complex reveals an aberrant transcriptional mechanism of cell cycle regulation. Cancer Cell. 2006;10:191–202. doi: 10.1016/j.ccr.2006.08.013. [DOI] [PubMed] [Google Scholar]
- 38.Sampath J, Sun D, Kidd VJ, Grenet J, Gandhi A, Shapiro LH, Wang Q, Zambetti GP, Schuetz JD. Mutant p53 cooperates with ETS and selectively upregulates human MDR1 not MRP1. J Biol Chem. 2001;276:39359–39367. doi: 10.1074/jbc.M103429200. [DOI] [PubMed] [Google Scholar]
- 39.Sato N, Parker AR, Fukushima N, Miyagi Y, Iacobuzio-Donahue CA, Eshleman JR, Goggins M. Epigenetic inactivation of TFPI-2 as a common mechanism associated with growth and invasion of pancreatic ductal adenocarcinoma. Oncogene. 2005;24:850–858. doi: 10.1038/sj.onc.1208050. [DOI] [PubMed] [Google Scholar]
- 40.Varga AE, Stourman NV, Zheng Q, Safina AF, Quan L, Li X, Sossey-Alaoui K, Bakin AV. Silencing of the Tropomyosin-1 gene by DNA methylation alters tumor suppressor function of TGF-beta. Oncogene. 2005;24:5043–5052. doi: 10.1038/sj.onc.1208688. [DOI] [PubMed] [Google Scholar]
- 41.Gruber AD, Pauli BU. Tumorigenicity of human breast cancer is associated with loss of the Ca2+-activated chloride channel CLCA2. Cancer Res. 1999;59:5488–5491. [PubMed] [Google Scholar]
- 42.Dong P, Tada M, Hamada JI, Nakamura A, Moriuchi T, Sakuragi N. p53 dominant-negative mutant R273H promotes invasion and migration of human endometrial cancer HHUA cells. Clin Exp Metastasis. 2007;24:471–483. doi: 10.1007/s10585-007-9084-8. [DOI] [PubMed] [Google Scholar]


