

Abstract
Calmodulin and other members of the EF-hand protein family are known to undergo major changes in conformation upon binding Ca2+. However, some EF-hand proteins, such as calbindin D9k, bind Ca2+ without a significant change in conformation. Here, we show the importance of a precise balance of solvation energetics to conformational change, using mutational analysis of partially buried polar groups in the N-terminal domain of calmodulin (N-cam). Several variants were characterized using fluorescence, circular dichroism, and NMR spectroscopy. Strikingly, the replacement of polar side chains glutamine and lysine at positions 41 and 75 with nonpolar side chains leads to dramatic enhancement of the stability of the Ca2+-free state, a corresponding decrease in Ca2+-binding affinity, and an apparent loss of ability to change conformation to the open form. The results suggest a paradigm for conformational change in which energetic strain is accumulated in one state in order to modulate the energetics of change to the alternative state.
Keywords: Conformational change, EF-hand, calmodulin, calbindin, solvation, buried polar, calcium
Conformational changes are intrinsic to the function of a variety of proteins. The changes in structure are typically triggered by a change in environment such as pH, phosphorylation state, or ligand-binding status (Schachman 1987; Ackers et al. 1992; Bullough et al. 1994; Ikura 1996). EF-hand proteins such as calmodulin are known to change conformation upon calcium (Ca2+) binding and often are termed Ca2+-sensor proteins. However, EF-hand proteins that appear to be Ca2+-buffering or -transporter proteins, such as calbindin D9k, exhibit only subtle changes in conformation (Skelton et al. 1994; Chazin 1995; Ikura 1996). A number of three-dimensional structures of EF-hand proteins have been determined in the Ca2+-saturated and -free forms (Herzberg and James 1985; Flaherty et al. 1993; Kordel et al. 1993; Gagne et al. 1995; Kuboniwa et al. 1995; Skelton et al. 1995; Slupsky and Sykes 1995; Drohat et al. 1996, 1998; Sastry et al. 1998). The recent progress of atomic-resolution structural analysis has provided valuable information about Ca2+-induced conformational change in EF-hand proteins.
Several groups have made important contributions in this direction through structure determination, mutational and structural analysis, and comparative studies (Skelton et al. 1994, 1995; Chazin 1995; Ikura 1995, Ikura 1966; Slupsky and Sykes 1995; Biekofsky et al. 1998; Julenius et al. 1998; Nelson and Chazin 1998a, b). Other studies have focused on individual Ca2+-ligating residues that have key roles in transducing the Ca2+-binding event into structural change (Evenas et al. 1997, 1998; Gagne et al. 1997). Despite this wealth of information about the structural differences in this family, the fundamental reasons for the disparate abilities of EF-hand proteins to change conformation have yet to be fully elucidated.
In calmodulin-like Ca2+-sensor proteins, the change in structure to the activated open-state (Fig. 1 ▶) results in the energetically unfavorable exposure of a large nonpolar surface. The increased affinity of Ca2+ for the open state provides the essential driving force to overcome this significant difference in energy. However, other factors may also make crucial contributions to the balance of energetics between structural forms. We used structures of the N-terminal domain of calmodulin (N-cam) in its Ca2+-free and -saturated forms, the structure of calbindin in its Ca2+-free form, and a model of calbindin in a hypothetical open-state structure to estimate the contributions of individual amino acids to the differential solvation energetics of conformational change. Based on the analysis, we hypothesized that the burial of polar groups in the closed form of N-cam serves to modulate the energetics of conformational change.
Fig. 1.

Ca2+-induced conformational changes in the N-terminal domain of calmodulin. (A) Ribbon diagrams show the differences in the conformations of Ca2+-free N-Cam (Kuboniwa et al. 1995); (B) Ca2+-saturated N-cam (Chattopadhyaya et al. 1992); and (C) Ca2+-saturated calbindin D9k (Svensson et al. 1992). The residues Gln41 and Lys75 in N-Cam examined in this study, as well as Leu38 and Ile73 in calbindin D9k, are displayed. Green spheres represent the Ca2+ ions. The figures were made with MOLSCRIPT (Kraulis 1991) and Raster 3D (Merrit and Bacon 1997).
Consistent with this hypothesis, mutation of two key polar groups at positions 41 and 75 in N-cam to the corresponding nonpolar groups from calbindin resulted in the stabilization of the closed form of calmodulin, such that it no longer changes conformation to the open form when saturated with Ca2+.
Results
Partial burial of polar groups in the closed form of calmodulin
Figure 2A ▶ shows an alignment of several EF-hand domain sequences, including N-cam. Interestingly, positions 41 and 75 of the N-cam protein contain the polar amino acids Gln and Lys, whereas calbindin contains the nonpolar residues Leu and Ile at structurally equivalent positions. Other EF-hand domains that change conformation also tend to contain polar groups at these positions. Observation of the structural orientation of these residues in N-cam reveals that they are partially buried at the top of the cleft of the domain, as shown in Figure 2B ▶.
Fig. 2.

Partially buried polar groups in EF-hand proteins. (A) Alignment of EF-hand domain sequences: the N- and C-terminal domains of calmodulin (N-cam, C-cam), the regulatory domain of skeletal troponin C (N-tnC), the regulatory domain of cardiac troponin C (N-ctnC), and calbindin D9k (clb). The numbering scheme is based on the full-length calmodulin sequence. The positions that are the focus of this work are highlighted in black. The ability to change conformation (y) or not (n) is listed for each domain. (B) Close-ups of buried polar groups in Ca2+-free structures of N-cam and the regulatory domain of troponin C (N-tnc). Calbindin (clb), in contrast, contains nonpolar groups at structurally equivalent positions.
The extent of burial of the glutamine and lysine functional groups at positions 41 and 75 in N-cam is unexpectedly high and energetically unfavorable. Surface-area calculations performed on the deposited ensemble of NMR structures (1cfc; Kuboniwa et al. 1995) reveal that the extent of burial varies widely within the ensemble. In some of the structures, the burial is complete, whereas in others it is modest. The expected unfavorable energetics could stem directly from the desolvation cost of the polar moieties or indirectly through the reduction in conformational entropy associated with an inability to solvate a large number of side-chain configurations. In any event, their presence may have an important contribution to the balance of energetics involved in the ability of N-cam to change conformation, particularly because they become fully exposed to solvent in the open-state structure (Fig. 1B ▶).
Our first indication of the presence of partially buried polar groups in N-cam came from analysis of the extent of nonpolar surface area exposed when changing conformation. Changes in nonpolar accessible surface area calculated from structures of N-cam in its Ca2+-free (Kuboniwa et al. 1995) and -saturated states (Babu et al. 1988) revealed a significant increase at several positions.
Comparison of these changes to those expected for a similar conformational change in calbindin (see Materials and Methods) reveals some disparity between the two proteins at a number of positions, as shown in Figure 3 ▶. In particular, the change in nonpolar surface exposure at positions 41 and 75 in N-cam is markedly reduced compared to the change at equivalent positions in calbindin. The difference largely stems from the fact that N-cam contains polar groups at these positions, whereas calbindin contains nonpolar groups, as discussed above. Below, we present a mutational analysis to investigate the importance of the buried polar groups to conformational change.
Fig. 3.

Position-specific changes in nonpolar surface area (ΔnpSA). (A) Change in npSA of N-cam residues, plotted as the difference in accessible surface areas calculated from the Ca2+-saturated and -free structures. (B) Predicted change in npSA for a hybrid protein clb-EF1, constructed in order to model a hypothetical open state for calbindin (see Materials and Methods). Positions 41 and 75 from N-camY are highlighted, as are their counterparts in the clb-EF1 sequence.
Model system
To facilitate our study of conformational change in N-cam (calmodulin residues 1–78), we introduced a single mutation from Phe to Tyr at position 19 to yield the protein N-camY. This protein is more spectroscopically active than N-cam and has been determined to have thermal and chemical stability and Ca2+-binding affinity similar to that of N-cam (Tables 1, 2). In addition, preliminary chemical shift assignments of N-camY in the apo and holo states (A. Ababou and J.R. Desjarlais, unpubl.) reveal a precise correlation with the published assignments for N-cam (Ikura et al. 1990, 1991; Kuboniwa et al. 1995; Zhang et al. 1995; Elshorst et al. 1999). The N-camY protein is used throughout this study as a wild-type reference. All variants described are constructed in this background.
Table 1.
Thermodynamic parameters for unfolding experiments
| Thermal denaturation | Chemical denaturation | ||||||
| Protein | ΔHm(kcal/mol)a | Tm(°C)a | ΔC°p (kcal/mol K)b | Cm (M)c | mGdmCl (kcal/mol M)a | ΔG°NU (kcal/mol)a | ΔΔG°NU (kcal/mol) |
| N-Cam | 53.1 ± 5.1 | 63.2 ± 0.5 | 1.3 | 2.4 | 1.9 ± 0.2 | 4.6 ± 0.6 | 0.0 |
| N-CamY | 53.9 ± 3.4 | 62.3 ± 0.4 | 1.3 | 2.3 | 2.0 ± 0.1 | 4.6 ± 0.3 | — |
| Q41L | 54.8 ± 5.3 | 71.3 ± 1.1 | 1.2 | 3.3 | 1.8 ± 0.1 | 5.9 ± 0.3 | 1.3 |
| K75I | 60.9 ± 4.9 | 67.7 ± 0.5 | 1.4 | 3.2 | 2.0 ± 0.1 | 6.3 ± 0.5 | 1.7 |
| Q41L–K75I | 57.5 ± 6.5 | 77.8 ± 2.0 | 1.2 | 4.0 | 1.8 ± 0.2 | 7.4 ± 0.9 | 2.8 |
| Q41A | 49.8 ± 4.1 | 63.2 ± 0.7 | 1.2 | 2.4 | 1.9 ± 0.1 | 4.5 ± 0.2 | −0.1 |
| K75A | 54.6 ± 5.8 | 63.7 ± 0.7 | 1.3 | 2.7 | 1.9 ± 0.2 | 5.2 ± 0.6 | 0.6 |
| Q41A–K75A | 57.2 ± 5.2 | 67.0 ± 0.6 | 1.3 | 2.9 | 2.0 ± 0.1 | 5.7 ± 0.5 | 1.0 |
a Data were well fitted to a two-state model, and the errors are given as ± confidence intervals at the 68.3% level.
b These values are poorly determined and are listed for completeness only.
Table 2.
Calcium-binding parameters and fluorescence spectra changes of ANS in the presence of apo- and holo-proteins
| Protein | Log K1a | Log K2a | Log K1K2 | ΔG°2Ca (kcal/mol) | ESSb | Δλmax | Imax(+ Ca2+)/Imax(− Ca2+) |
| N-Cam | 4.84 | 5.14 | 9.98 | −13.7 | 1.04 10−5 | ||
| N-CamY | 4.97 | 5.17 | 10.14 | −13.9 | 1.27 10−5 | 29 | 5.1 |
| Q41L | 4.87 | 4.95 | 9.82 | −13.5 | 3.27 10−6 | 21 | 3.9 |
| K75I | 4.76 | 4.55 | 9.31 | −12.8 | 1.76 10−5 | 11 | 1.4 |
| Q41L–K75I | 4.45 | 4.73 | 9.18 | −12.6 | 1.31 10−5 | 5 | 1.2 |
| Q41A | 5.05 | 5.16 | 10.21 | −14.0 | 1.27 10−4 | 26 | 2.6 |
| K75A | 4.97 | 4.55 | 9.52 | −13.1 | 6.48 10−5 | 9 | 1.8 |
| Q41A–K75A | 4.69 | 4.77 | 9.46 | −13.0 | 1.28 10−5 | 16 | 1.7 |
a K1 and K2 are in molar concentration units.
b Error squared sum of the fit (see Materials and Methods).
Stability of the apo-proteins
If the buried polar groups in the closed state of N-camY are indeed unfavorable, we expect that their replacement with nonpolar groups will result in the stabilization of the folding of the apo state and a decrease in Ca2+-binding affinity. Substitution at the same positions with alanine might be expected to have an intermediate effect on the stability of the domain, because they will relieve the effect of polar burial but will not contribute a greater amount of hydrophobicity.
Folding stabilities of the apo state of N-camY and its variants were monitored by thermal and chemical denaturation (GdmCl) using circular dichroism (CD) to monitor the extent of unfolding. The results from the two experiments reveal the same qualitative trends in stability, as seen in Figure 4 ▶. Indeed, the melting temperatures (Tm) correlate extremely well with the midpoints of unfolding determined from chemical denaturation (Cm). The stabilities that we determine for N-cam (cam 1–78) are higher than values reported previously using slightly different conditions and protein fragments (cam 1–75; Sorensen and Shea 1998; Masino et al. 2000). It appears to be possible that the few extra amino acids contained in our constructs significantly influence the stability of the domain.
Fig. 4.
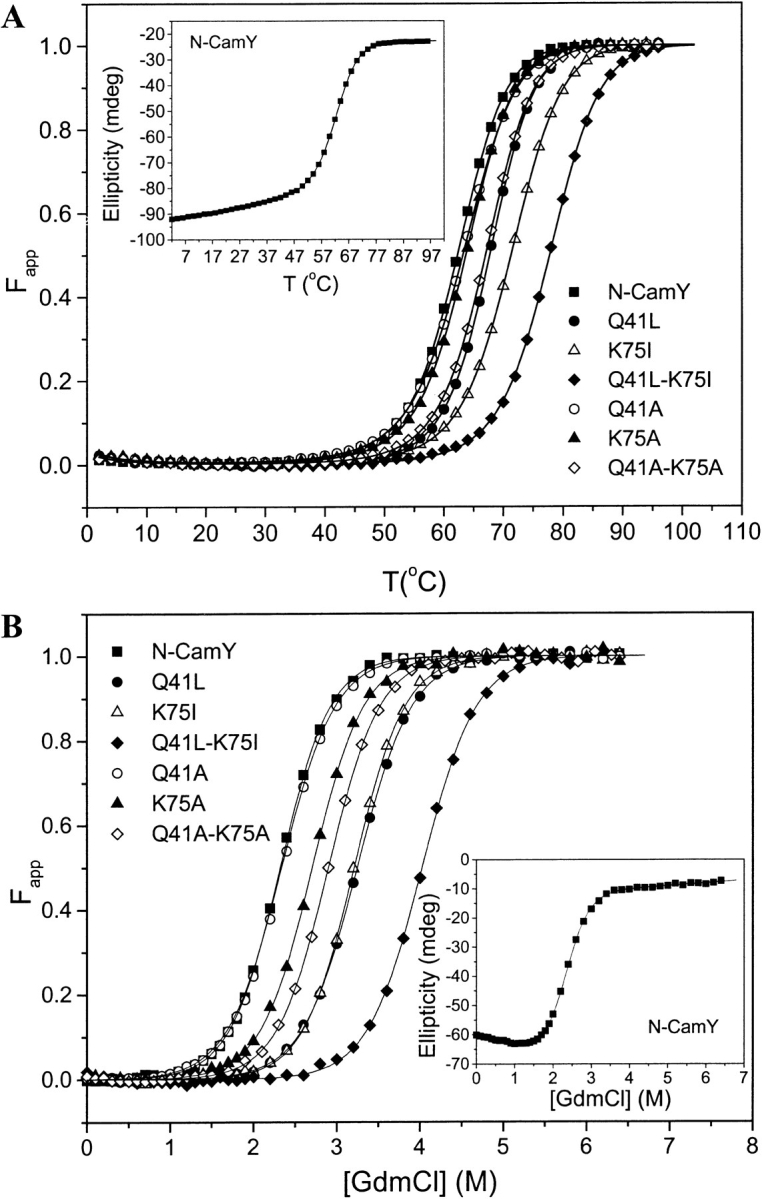
Stability of Ca2+-free N-camY variants. (A) Thermal Denaturation. The apparent fraction of unfolded protein Fapp for N-CamY and the variants is plotted as a function of temperature. The extent of unfolding was monitored by circular dichroism (CD) at a wavelength of 222 nm. (B) Chemical Denaturation. The Fapp as a function of GdmCl concentration is shown for each variant. The unfolding was monitored by far-UV CD at a wavelength of 232 nm. For each figure, the inset shows the uncorrected denaturation data and initial fits for the N-camY protein.
The substitution of the buried polar residues with nonpolar residues had significant effects on the stability of the apo state (Fig. 4 ▶; Table 1). The most dramatic effects are observed for the double-mutant Q41L-K75I, in which the polar residues are replaced by similarly sized nonpolar residues. This variant has an increase of Tm of 16°C and an increase in Cm of 1.7 M. Smaller but significant increases in stability are also observed for the single mutations Q41L and K75I. As expected, the alanine variants show an intermediate stability between N-camY and the nonpolar variants.
Chemical denaturation data using GdmCl fit well with a two-state model as shown in Figure 4B ▶ (see Materials and Methods). The free energies of unfolding in the absence of denaturant, ΔG°NU(H2O), the transition midpoint Cm, and the change in free energy ΔΔG°NU relative to N-camY are summarized in Table 1. The double-mutant Q41L-K75I is the most significantly stabilized variant with an increase in unfolding free energy of 2.8 kcal/mole relative to N-camY.
Measurement of the folding stabilities of the Ca2+-saturated states of each variant would be extremely informative. However, such experiments are impractical due to the already high stability of N-camY and the dependence of Ca2+-binding affinity on ionic strength (Linse et al. 1991a, b).
Ca2+-binding affinities
An increase in stability of the apo/closed state relative to the unfolded state is likely to coincide with an increase in stability of the apo state relative to the Ca2+-bound open state. Because Ca2+ binding in N-camY is coupled to the change in conformation, changes in the relative stability of closed and open states should have a direct effect on Ca2+-binding affinity (in the absence of any more direct effects on Ca2+ binding).
The titration of N-CamY and variants with Ca2+ in the presence of the chromophoric chelator 5-nitro-BAPTA (5NBAPTA) is shown in Figure 5 ▶. A clear competition for Ca2+ binding between protein and the 5NBAPTA is observed in all cases, indicating that all of the variants retain significant affinity for Ca2+. Analysis of the data indicates that N-CamY binds two Ca2+ ions with a free energy of ΔG°2Ca = −13.9 kcal/mole, in close agreement with previously published results (Linse et al. 1991a). Substitution of buried polar groups (Q41, K75) with nonpolar groups (L41, I75) leads to a decrease in Ca2+-binding affinity, consistent with the stabilization of the closed state relative to the open state. The double-mutant Q41L-K75I has the lowest Ca2+ affinity, with a Ca2+-binding free energy of –12.6 kcal/mole. This corresponds to an increase in Ca2+-binding free energy of 1.3 kcal/mole relative to N-camY. Interestingly, this represents roughly half of the effect of the double substitution on the unfolding free energy. The macroscopic Ca2+-binding constants for all of the variants are summarized in Table 2. Again, as expected, the alanine variants have intermediate effects on Ca2+-binding affinity.
Fig. 5.

Ca2+-binding assays for representative N-camY variants. Logarithmic representations of the normalized Ca2+ competition curves of N-CamY and the mutants monitored by the absorbance of 5NBAPTA (5-nitro-BAPTA) at 430 nm. The symbols are the experimental data and the curves through the points are the least-squares fits. Binding parameters determined from the fits are listed in Table 2.
There are three possible explanations for an observed decrease in Ca2+-binding affinity. First, the substitutions could have a direct effect on the structure of the Ca2+-binding loops. We view this possibility as unlikely, because the sites of mutation are far removed from the Ca2+-binding loops. Alternatively, the substitutions could lead to a relative stabilization of the closed form, with the open state still being formed in the presence of Ca2+. In this case, Ca2+ binding is coupled to conformational change; thus, the Ca2+ affinity should decrease as the stability of the closed state increases. Finally, if the open form is destabilized to the extent that the Ca2+-saturated closed state is predominant, the measured Ca2+-binding affinity will approach the intrinsic affinity of the closed form.
Characterization of conformational changes
A hallmark of conformational change in calmodulin like proteins is the Ca2+-dependent binding of the hydrophobic fluorophore 8-anilino-1-naphthalene-sulfonic acid (ANS; Bayley et al. 1984), which presumably binds in the large hydrophobic pocket formed by the open state. The fluorescence emission of ANS in the presence of the apo-proteins was compared to that in the presence of the holo-proteins. In the case of N-CamY, the ANS fluorescence shows a large increase in intensity and a significant decrease of λmax in the presence of Ca2+ (Fig. 6 ▶). Similar effects are observed for the Q41L, the Q41A, and modestly for the other alanine variants (Table 2). However, the K75I and the Q41L-K75I variants show little to no change in the ANS fluorescence intensity upon addition of high concentrations of Ca2+. Assuming that ANS-binding capacity is indicative of the presence of the open-state structure, the data suggest that these variants no longer adopt an open-state structure. However, we note that ANS binding is a qualitative assay in which a change in fluorescence intensity can reflect a change in conformational equilibrium or a change in ANS-binding affinity for the open-state structure.
Fig. 6.

Conformational changes measured by ANS binding. Fluorescence emission spectra of ANS in the presence of protein as illustrated in the case of N-CamY and Q41L-K75I, in the absence of Ca2+ (dashed line), normalized to unity, and its relative fluorescence enhancement in the presence of Ca2+ (solid line). Table 2 lists the relative ANS intensity for all of the variants in the presence or absence of Ca2+.
Close packing of aromatic groups in native protein cores gives rise to near-UV CD spectra that are dependent on the solvent and the proximity of other functional groups (Tawell and Manning 1994). To investigate the local structure and environment of aromatic residues, we have recorded the near-UV CD spectra of the apo- and holo-proteins, as shown in Figure 7 ▶. All apo-proteins have identical spectral shapes and, within the limits of experimental error, identical extremum values. Two minima at 263 nm and 270 nm, characteristic of phenylalanine spectra, are prominent. For a subset of the variants, the addition of saturating concentrations of Ca2+ results in the rise of a broad minimum between 275 nm and 290 nm characteristic of tyrosines. This result clearly indicates that the environment of Tyr19 changes in response to Ca2+ binding in such a way that it is highly packed in the core of the protein and most probably with the cluster of phenylalanines at positions 12, 65, and 68, as expected from the experimentally determined structure of Ca2+-saturated calmodulin (Babu et al. 1988). The effect is strong in the case of N-CamY, Q41L, and the alanine variants. It is seen only weakly in the case of K75I and is completely absent in the case of the double-mutant Q41L-K75I. These spectra appear to be a signature of the difference in conformation between Ca2+-saturated N-CamY and Q41L-K75 and suggest clearly that the double mutant is trapped in a closed structure. In contrast to the ANS assay, the near-UV CD spectra are likely to be a more direct measure of the equilibrium between two conformations.
Fig. 7.

Conformational changes measured by near-UV CD spectra. Spectra of all of the variants were collected with 0.1 mM EDTA (A) or 1 mM CaCl2(B).
Importantly, the results from the ANS fluorescence and near-UV CD directly parallel each other. The double-mutant Q41L-K75I loses ANS-binding capacity and has no near-UV spectral change, strongly suggesting that it no longer adopts an open-state structure. However, the variant clearly binds Ca2+ as seen in Figure 5 ▶. Ca2+ binding to this variant is further supported by the large chemical shift perturbations observed for protons in the vicinity of both Ca2+-binding sites, as listed in Table 3. Hence, for this protein, Ca2+ binding is apparently uncoupled from a major conformational change, as is the case for calbindin D9k.
Table 3.
Selected chemical shifts in the calcium binding loopsa
| N-CamY (− Ca2+) | Q41L–K75I (− Ca2+) | |||
| Residue | NH | αH | NH | αH |
| Gly25 | 10.15 | 4.23 ; 3.79 | 10.18 | 4.23 ; 3.79 |
| Ile27 | 8.17 | ND | 8.22 | ND |
| Gly61 | 9.99 | 4.10 ; 3.84 | 9.83 | 4.07 ; 3.89 |
| Ile63 | 8.85 | 4.54 | 8.87 | 4.62 |
| N-CamY (− Ca2+) | Q41L–K75I (− Ca2+) | |||
| a Chemical shifts are listed at 298 K with respect to the water line at 4.70 ppm. ND, not determined. | ||||
| Gly25 | 10.61 | 4.31 ; 3.63 | 10.53 | 4.30 ; 3.62 |
| Ile27 | 9.77 | 4.96 | 9.57 | 5.02 |
| Gly61 | 10.57 | 4.15 ; 3.42 | 10.52 | 4.14 ; 3.44 |
| Ile63 | 8.90 | 5.14 | 9.01 | 5.19 |
The Ca2+-induced change in the near-UV CD spectra of the Q41L and alanine variants is approximately half of that observed for N-camY. In light of this reduced spectral change and the stability and Ca2+-binding data, we speculate that these variants exist in equilibrium between closed and open states in the presence of Ca2+. Precedence for this phenomenon has been reported for Ca2+-binding-loop substitutions (Evenas et al. 1997, 1998).
NMR spectroscopy
NMR spectroscopy has been used to further investigate the conformational changes in these proteins upon Ca2+ binding. We have collected NMR data for N-CamY and the double-mutant Q41L-K75, which has exhibited the most dramatic differences from N-camY and is apparently trapped in a closed form in the presence of Ca2+. The spectra collected for the Ca2+-free form of Q41L-K75I are extremely similar to those of apo-N-camY (data not shown). In contrast, the spectra of the Ca2+-saturated form of Q41L-K75I differ considerably from those of Ca2+-saturated N-camY. These differences are prominent in the aromatic regions of the NOESY spectra, as shown in Figure 8 ▶. In particular, Tyr19, whose aromatic resonances were assigned using COSY and TOCSY data, has several NOE cross-peaks to other aromatic resonances in the Ca2+-saturated form of N-camY. These include the aromatic protons from Phe68, consistent with the structure of Ca2+-saturated calmodulin, as well as published assignments (Ikura et al. 1990, 1991; Elshorst et al. 1999). In contrast, only a single weak crosspeak between Tyr19 and another aromatic resonance (unassigned) is observed in the spectrum of the Q41L-K75I variant. Furthermore, several significant chemical shift differences between the two spectra are apparent. These observations, together with the fluorescence and CD data, suggest the Ca2+-saturated Q41L-K75I variant exists in a structural form that is significantly different from the canonical open-state structure expected for a Ca2+-saturated domain.
Fig. 8.
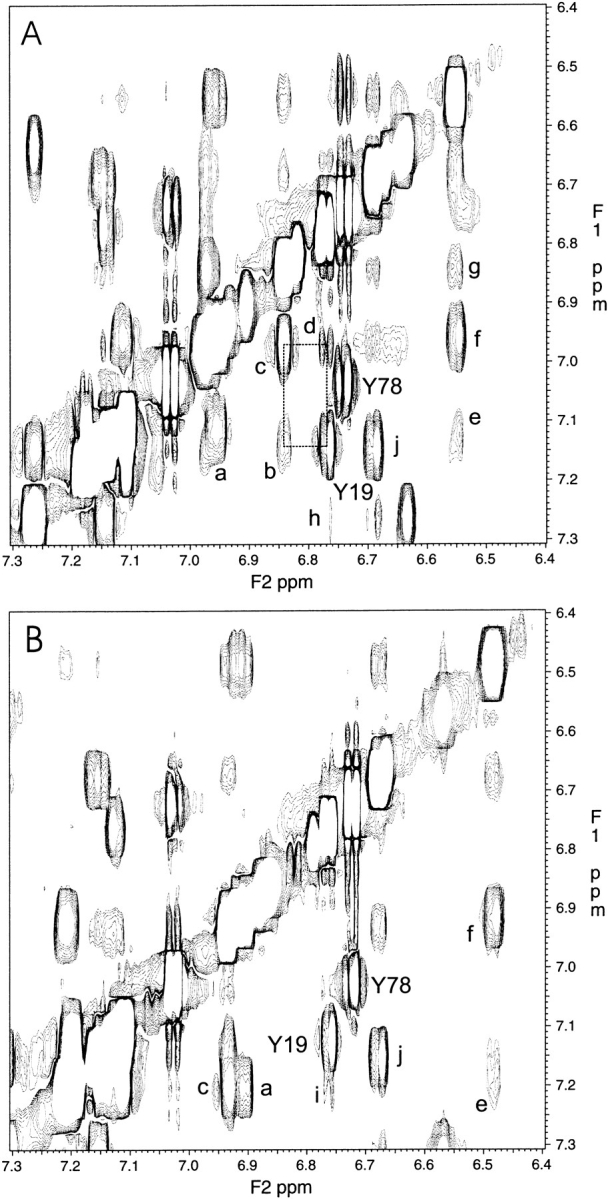
Aromatic regions of 1H-1H NOESY spectra. Spectra are shown for Ca2+-saturated N-camY (A) and Ca2+-saturated Q41L-K75I (B). As expected from the open-state structure of N-cam, several cross-peaks between Tyr19 and other aromatics are observed (dashed box). These cross-peaks are not expected for the closed form. Assignments—based on COSY, TOCSY, and NOESY correlations, similarities with published assignments (Ikura et al. 1990, 1991; Elshorst et al. 1999), and consistency with the know structures—are as follows. For (A) Y19, Y19 (Hɛ, 6.77) to (Hδ, 7.14); Y78, Y78 (Hɛ, 6.74) to (Hδ, 7.05); a, F16 (Hɛ, 6.96) to (Hζ, 7.11); b, F68 (Hɛ, 6.84) to Y19 (Hδ, 7.14); c, F68 (Hɛ, 6.84) to (Hζ, 6.97); d, Y19 (Hɛ, 6.77) to F68 (Hζ, 6.97); e, F16 (Hδ, 6.55) to (Hζ, 7.11); f, F16 (Hδ, 6.55) to (Hɛ, 6.96); g, F16 (Hδ, 6.55) to F68 (Hɛ, 6.84); h, Y19 (Hɛ, 6.77) to F65* j, F65* (H*, 6.69) to F65* (Hɛ, 7.15). For (B) Y19, Y19 (Hɛ, 6.76) to (Hδ, 7.13); Y78, Y78 (Hɛ, 6.72) to (Hδ, 7.02); a, F16 (Hɛ, 6.92) to (Hζ, 7.21); c, F68 (H*, 6.93) to (H*, 7.21); e, F16 (Hδ, 6.48) to (Hζ, 7.21); f, F16 (Hδ, 6.48) to (Hɛ, 6.92); i, Y19 (Hɛ, 6.76) to (*); j, F65* (H*, 6.68) to F65* (Hɛ, 7.15). *Not determined or uncertainty in the assignment.
Discussion
The results described above support a view in which suboptimal stability has evolved into the Ca2+-free, closed form of the N-terminal domain of calmodulin in order to mitigate the unfavorable energetics associated with adopting the functionally activated open-state structure. The results of our mutational analysis are consistent with the concept of a careful balance of solvation energetics between structural forms. Perturbations of this balance lead to deficiencies in the ability to change conformation and/or the ability to bind Ca2+ with high affinity.
Mutational analysis indicates that a major requirement for conformational change in N-cam is the absence of large hydrophobic groups at positions 41 and 75. Mutation of Q41 and K75 to Leu and Ile, respectively, leads to a dramatic stabilization of the apo state of N-camY and a reduction of Ca2+-binding affinity. Finally, spectroscopic analysis strongly suggests that for this variant, the equilibrium between Ca2+-saturated closed and open forms is perturbed to an extent such that the Ca2+-saturated closed form dominates.
Comparison of the results of alanine mutations at positions 41 and 75 versus the substitutions with larger nonpolar groups indicates that the burial of polar groups is important but not essential for conformational change. However, the presence of the polar groups of Gln and Lys does appear to be a significant factor for retaining appropriate levels of Ca2+-binding affinity and a more complete conversion of the protein population to the open-state structure. Interestingly, several other N-cam-related domains, including the C-terminal domain of calmodulin and the regulatory N-terminal domain of troponin C, also contain polar groups at these positions, as shown in Figure 2 ▶. Inspection of a high-resolution structure of the N-terminal domain of troponin C (Gagne et al. 1995) reveals that the polar moieties from two glutamine residues are indeed partially buried in its Ca2+-free form (Fig. 2B ▶). We speculate that the inclusion of buried polar groups is an important energetic factor in many other EF-hand proteins of the Ca2+ sensor class.
As shown in Figure 9 ▶, data from the set of variants reveal a correlation between the Ca2+-binding and -unfolding free energies. For many of the variants, the correlation is roughly linear because Ca2+ binding is coupled to conformational change. However, as observed for the double-mutant Q41L-K75I, if the protein does not change conformation, the Ca2+-binding free energy no longer increases with increased folding stability, because the intrinsic Ca2+ affinity for the closed state has been reached. Any further increases in the closed-state stability should have little effect on Ca2+ affinity.
Fig. 9.

Relationship between calcium-binding and -unfolding free energies. For proteins that change conformation, a linear correlation might be expected, denoted by the solid line. However, as the closed state becomes stabilized to the extent that calcium binding does not induce a conformational change, the free energies will become uncoupled. At this point, the calcium-binding free energy will approach the intrinsic affinity of the closed state, as denoted by the dashed line.
Buried polar groups have been shown to have significant effects on the stability of protein structure. Substitution of buried nonpolar residues with polar residues has been shown to lead to large decreases in protein stability (Dao-pin et al. 1991; Stites et al. 1991; Blaberet al. 1993). Alternatively, replacement of native buried polars with appropriately selected nonpolar residues has been shown to stabilize a protein significantly (Waldburger et al. 1995; Hendsch et al. 1996). Other studies have highlighted the role of buried polar groups in providing oligomeric state specificity to leucine zipper motifs (Lumb and Kim 1995; Gonzalez et al. 1996; Zeng et al. 1997). According to our results, the effect is also likely to be a major factor in the ability of some classes of proteins to undergo unimolecular changes in conformation.
This study was initiated by a comparison between the properties of calbindin and N-cam. A complete understanding of the differential ability of these domains to change conformation will only be shown by mutational conversion of the conformationally inert protein calbindin D9k into one that changes conformation in response to Ca2+ binding. Although a variety of substitutions will likely be necessary in this endeavor, our results indicate that close attention must be paid to the balance of solvation energetics in the two structural forms of the protein and that the introduction of polar groups at key positions in calbindin will make an important contribution.
A general requirement for conformational change is the presence of structural ambivalence, which can occur in many ways. In an elegant demonstration of this principle, Young et al. (1999) showed that structural ambiguity in the form of secondary-structure propensity can be used with marked success to predict regions of proteins that undergo changes in conformation. In the case of the N-terminal domain of calmodulin and, presumably, similar domains, structural ambivalence depends, at least in part, on the presence of partially buried or restricted polar groups. Their presence foreshadows the existence of an alternative form in which the polar groups can become fully solvated. Perhaps the identification of suboptimal structural regions, often ascribed to the incorrect assignment of structure, might in some cases lead to the identification of conformationally active regions of proteins. In light of the central role of conformational change in a variety of disease states (Carrell and Gooptu 1998; Dobson 1999), this may yield important insights into the mechanism of transformation to pathological structural states.
Materials and methods
Protein cloning and purification
The isolated N-terminal domain of the recombinant human calmodulin used in this work (N-Cam), residues 1–78, was created using the standard cloning techniques. A single mutation from Phe to Tyr was introduced at position 19 to yield the protein N-camY, the protein used throughout the study as a wild-type reference. Mutagenic oligonucleotides were purchased from Integrated DNA Technologies. The residues Ala1, Phe19, and Asp78 were changed to Met1, Tyr19, and Tyr78, respectively. The N-CamY and its variants were overexpressed in Escherichia coli Bl21(DE3) cells. The integrity of all the clones was confirmed by DNA sequencing. The yields of purified proteins from this expression system are consistently high, with an average of ∼150 mg/L of culture medium. The proteins are purified in two stages. The first purification consists of an anion exchange column, following a published protocol (Meyer et al. 1996). The second purification was achieved using reversed-phase HPLC, followed by extensive dialysis to reduce the residual Ca2+. Mass spectrometric analysis of the proteins confirmed the purity and integrity of the protein samples. The purified proteins were checked by SDS gel electrophoresis, and all the proteins showed >98% purity. The concentrations of the proteins were determined in 6M GdmCl using absorbance spectroscopy and a molar extinction coefficient of Tyr at 280 nm of 1420 M-1 cm-1.
Chemical materials
The fluorimetric Ca2+ chelator 5NBAPTA was purchased from Molecular Probes. The fluorimetric hydrophobic probe ANS, GdmCl, and MOPS were purchased from Sigma. Solvents for HPLC and other routine laboratory chemicals were of the highest grade commercially available.
Absorbance and fluorescence measurements
The Ca2+-binding assays using the binding competition between the chelator 5NBAPTA and the proteins (Linse et al. 1991b) was carried out using the absorbance signal of the chelator at 430 nm.
The absorbance measurements were conducted on a BioSpec-1601 (SHIMADZU Scientific Instruments).
All measurements were performed using 37 μM protein and 25 μM 5NBAPTA, 100 mM KCl, and 20 mM MOPS at pH 7.2.
Fluorescence measurements were conducted on a Fluorolog-3 spectrofluorimeter (JOBIN YVON-SPEX), and the spectra were uncorrected from the photomultiplier response function. The excitation wavelength for ANS was 370 nm. The excitation and emission bandwidths were set at 4 nm, and all the measurements were conducted at 25°C, using a NESLAB water-bath circulator (NESLAB Instruments). All the measurements were done using 25 μM protein and 5 μM ANS, 100 mM KCl, and 20 mM MOPS at pH 7.2. For Ca2+-free and -saturated measurements, 0.1 mM EDTA and 1 mM CaCl2 were used, respectively.
Circular dichroism measurements
CD spectra were collected on an Aviv Model 62DS CD spectrophotometer equipped with a thermoelectric cell holder and with a Hamilton microlab 500 series automatic titrator. Far-UV CD spectra were collected from 200 nm to 260 nm using a 1-mm cell path length and a 3 s averaging time. Thermal unfolding data were collected at 222 nm from 2°C to 96°C. Samples were placed in a 2-mm cuvette and heated in increments of 2°C, using an equilibration time of 2.5 min and a 30 s averaging time. The protein concentration was held constant at 25 μM. Chemical unfolding at 25°C with GdmCl was conducted by titrating an initial 2 mL of the folded protein placed in 1 × 1-cm cuvette containing a stir bar.
CD spectra between 260 nm and 218 nm were collected with a 3 s averaging time at each denaturant concentration. The titration was performed by removing an aliquot of the folded protein solution and replacing the same volume from an unfolded protein stock prepared in buffer containing ∼7.1 M GdmCl. The unfolded protein stock was loaded into the titrator. After each automated increase in the denaturant concentration, the sample was allowed to equilibrate for 2 min in the baseline regions and 3.5 min in the transition regions. The system was shown to be at equilibrium by obtaining identical results after doubling the equilibration time. All CD measurements were corrected by subtracting the buffer spectra. The GdmCl or urea stock solutions were prepared fresh daily and the concentrations were calculated by their refractive index (Pace 1986) using a Reichert-Jung ABBE MARK II digital refractometer. All experiments were carried out in 20 mM MOPS at pH 7.2, 100 mM KCl.
A model of calbindin in the open state
The simplest approach to modeling an open-state structure of calbindin is to use that of N-cam as a reference. In order to facilitate this approach, we modeled a calbindin sequence in which the N-terminal Ca2+-binding loop (residues 15–24) was replaced by the loop from calmodulin (residues 20–27) to create the protein clb-EF1. Hence, the structure of N-cam in the Ca2+-saturated state can be used directly as a structural template from which to build an open-state model of calbindin. The backbone model for a projected form of calbindin (clb-EF1) in the open state was assembled by grafting the connecting loop structure (between the EF-hands) from calbindin onto the open-state structure of the N-terminal domain of calmodulin. This model assumes that any conformational change achieved in the clb-EF1 system will resemble that which takes place for calmodulin, consisting primarily of a hinge movement that alters the relative orientation of two of the alpha helices relative to the others. Side chains of the clb-EF1 sequence were built on the hypothetical backbone structure using the program SPA (Raha et al. 2000). Although the models are expected to be imperfect, they are useful for generating hypotheses addressing the inability of calbindin to change conformation.
Data analysis
The macroscopic binding constants K1 and K2 of the Ca2+ binding of the proteins were determined using the methodology described by Linse et al. (1991b). Data were fitted to single- and two-site Adair functions describing the competition between 5NBAPTA and a two-site protein as described. Analysis was performed using a Fortran 90 program developed in our laboratory. We determined the KD of 5NBAPTA using its absorbance signal at 430 nm in 20 mM MOPS, 100 mM KCl at pH 7.2 buffer. The KD obtained was 23.0 μM, which was in close agreement with previously reported values (Rand et al. 1997). The unfolding experiments were fitted to a two-state model. Hence, the CD unfolding data were fitted to
 |
where S is the observed signal and SN and SU are the CD signals for the unfolded and the native protein, respectively.
ΔGNU is the free-energy difference of the unfolding reaction. Both the SN and SU were assumed to depend linearly on the temperature and the denaturant concentration and to retain this linearity in the transition region.
For the thermal unfolding we assume that the heat capacity ΔCp is temperature independent in the range of measurement (Privalov 1979). Hence, the free energy of unfolding is
 |
where Tm is the melting temperature and ΔHm is the enthalpy difference at Tm.
For the chemical unfolding, using the linear extrapolation model (Greene and Pace 1974), the free energy of unfolding is
 |
where ΔGNU(H2O) is the free-energy difference in the absence of denaturant and mD reflects the sensitivity of ΔGNU to the denaturant concentration. The denaturant concentration at which the protein is 50% unfolded (ΔGNU = 0) is given by Cm.
Denaturation data were fit using the program ORIGIN (Microcal Software 1997). The calculated errors in the unfolding experiments are given as ± confidence intervals at the 68.3% level.
NMR measurements
All NMR samples were 600 μL in volume, the buffer conditions were 100 mM KCl, 0.15 mM sodium azide in 95% H2O/5% D2O at pH 7.2. The protein concentrations were 1 mM with 0.1 mM EDTA for the Ca2+-free sample and 4 mM CaCl2 for the Ca2+-loaded sample.
All spectra were acquired at a proton frequency of 600 MHz and at 298 K using a Bruker DRX-600 spectrometer. 1H-1H DQF-COSY, 1H-1H TOCSY, and 1H-1H NOESY spectra were acquired in the quadrature mode and with TPPI (Marion and Wuthrich 1983). A total of 64 scans were collected for each of the 512 t1 values and the t2 values. Mixing times of 45 ms (TOCSY), 100 ms (NOESY), and a relaxation delay of 1.5 sec were used for a spectral window of 13.4 ppm. The carrier was always set on the water resonance and its suppression was applied using the WATERGATE technique (Piotto et al. 1992).
Spectral widths were as follows: DQF-COSY, 8013 Hz in both t2 (4096 complex points) and t1 (482–512 increments); NOESY and TOCSY, 12,500 Hz in t2 (4096 complex points) and 8013 Hz in t1 (512 increments). All the data were processed with NMRPipe program (Delaglio et al. 1995) and shifted squared sine-bell window function and zero filling were applied in both dimensions prior to Fourier transformation. A polynomial baseline correction was applied in both dimensions in the frequency domain. The proton chemical shifts were indirectly referenced to sodium 2,2-dimethyl-2-silapentane-5sulfonate through the water signal (Wishart et al. 1995).
Acknowledgments
We thank Drs. Juliette Lecomte and Christopher Falzone for collection of NMR data and their kind guidance in its interpretation; Dr. C. Robert Matthews and members of his laboratory for use of their CD spectrometer and their generous assistance; and Janet Reich, Ryan Shenvi, and Daniel Lebovic for technical assistance in preparation and characterization of N-cam variants.
The publication costs of this article were defrayed in part by payment of page charges. This article must therefore be hereby marked "advertisement" in accordance with 18 USC section 1734 solely to indicate this fact.
Article and publication are at www.proteinscience.org/cgi/doi/10.1110/ps.33601.
References
- Ackers, G.K., Doyle, M.L., Myers, D., and Daugherty, M.A. 1992. Molecular code for cooperativity in hemoglobin. Science 255 54–63. [DOI] [PubMed] [Google Scholar]
- Babu, Y.S., Bugg, C.E., and Cook, W.J. 1988. Structure of calmodulin refined at 2.2 Å resolution. J. Mol. Biol. 204 191–204. [DOI] [PubMed] [Google Scholar]
- Bayley, P., Ahlstrom, P., Martin, S.R., and Forsen, S. 1984. The kinetics of calcium binding to calmodulin: Quin 2 and ANS stopped-flow fluorescence studies. Biochem. Biophys. Res. Commun. 120: 185–91. [DOI] [PubMed] [Google Scholar]
- Biekofsky, R.R., Martin, S.R., Browne, J.P., Bayley, P.M., and Feeney, J. 1998. Ca2+ coordination to backbone carbonyl oxygen atoms in calmodulin and other EF-hand proteins: 15N chemical shifts as probes for monitoring individual-site Ca2+ coordination. Biochemistry 37 7617–29. [DOI] [PubMed] [Google Scholar]
- Blaber, M., Lindstrom, J.D., Gassner, N., Xu, J., Heinz, D.W., and Matthews, B.W. 1993. Energetic cost and structural consequences of burying a hydroxyl group within the core of a protein determined from Ala–Ser and Val–Thr substitutions in T4 lysozyme. Biochemistry 32 11363–11373. [DOI] [PubMed] [Google Scholar]
- Bullough, P.A., Hughson, F.M., Skehel, J.J., and Wiley, D.C. 1994. Structure of influenza haemagglutinin at the pH of membrane fusion. Nature 371 37–43. [DOI] [PubMed] [Google Scholar]
- Carrell, R.W. and Gooptu, B. 1998. Conformational changes and disease—Serpins, prions and Alzheimer's. Curr. Opin. Struct. Biol. 8 799–809. [DOI] [PubMed] [Google Scholar]
- Chattopadhyaya, R., Meador, W.E., Means, A.R., and Quiocho, F.A. 1992. Calmodulin structure refined at 1.7 Å resolution. J. Mol. Biol. 228 1177–92. [DOI] [PubMed] [Google Scholar]
- Chazin, W.J. 1995. Releasing the calcium trigger. Nat. Struct. Biol. 2 707–10. [DOI] [PubMed] [Google Scholar]
- Dao-pin, S., Anderson, D.E., Baase, W.A., Dahlquist, F.W., and Matthews, B.W. 1991. Structural and thermodynamic consequences of burying a charged residue within the hydrophobic core of T4 lysozyme. Biochemistry 30 11521–9. [DOI] [PubMed] [Google Scholar]
- Delaglio, F., Grzesiek, S., Vuister, G.W., Zhu, G., Pfeifer, J., and Bax, A. 1995. NMRPipe: A multidimensional spectral processing system based on UNIX pipes. J. Biomol. NMR 6 277–93. [DOI] [PubMed] [Google Scholar]
- Dobson, C.M. 1999. Protein misfolding, evolution and disease. Trends Biochem. Sci. 24 329–32. [DOI] [PubMed] [Google Scholar]
- Drohat, A.C., Amburgey, J.C., Abildgaard, F., Starich, M.R., Baldisseri, D., and Weber, D.J. 1996. Solution structure of rat apo-S100B(beta beta) as determined by NMR spectroscopy. Biochemistry 35 11577–88. [DOI] [PubMed] [Google Scholar]
- Drohat, A.C., Baldisseri, D.M., Rustandi, R.R., and Weber, D.J. 1998. Solution structure of calcium-bound rat S100B(betabeta) as determined by nuclear magnetic resonance spectroscopy. Biochemistry 37 2729–40. [DOI] [PubMed] [Google Scholar]
- Elshorst, B., Hennig, M., Forsterling, H., Diener, A., Maurer, M., Schulte, P., Schwalbe, H., Griesinger, C., Krebs, J., Schmid, H., et al. 1999. NMR solution structure of a complex of calmodulin with a binding peptide of the Ca2+ pump. [DOI] [PubMed]
- Evenas, J., Thulin, E., Malmendal, A., Forsen, S., and Carlstrom, G. 1997. NMR studies of the E140Q mutant of the carboxy-terminal domain of calmodulin reveal global conformational exchange in the Ca2+-saturated state. Biochemistry 36 3448–57. [DOI] [PubMed] [Google Scholar]
- Evenas, J., Malmendal, A., Thulin, E., Carlstrom, G., and Forsen, S. 1998. Ca2+ binding and conformational changes in a calmodulin domain. Biochemistry 37 13744–54. [DOI] [PubMed] [Google Scholar]
- Flaherty, K.M., Zozulya, S., Stryer, L., and McKay, D.B. 1993. Three-dimensional structure of recoverin, a calcium sensor in vision. Cell 75 709–16. [DOI] [PubMed] [Google Scholar]
- Gagne, S.M., Li, M.X., and Sykes, B.D. 1997. Mechanism of direct coupling between binding and induced structural change in regulatory calcium binding proteins. Biochemistry 36 4386–92. [DOI] [PubMed] [Google Scholar]
- Gagne, S.M., Tsuda, S., Li, M.X., Smillie, L.B., and Sykes, B.D. 1995. Structures of the troponin C regulatory domains in the apo and calcium-saturated states. Nat. Struct. Biol. 2 784–789. [DOI] [PubMed] [Google Scholar]
- Gonzalez Jr., L., Woolfson, D.N., and Alber, T. 1996. Buried polar residues and structural specificity in the GCN4 leucine zipper. Nat. Struct. Biol. 3 1011–8. [DOI] [PubMed] [Google Scholar]
- Greene Jr., R.F. and Pace, C.N. 1974. Urea and guanidine hydrochloride denaturation of ribonuclease, lysozyme, alpha-chymotrypsin, and beta-lactoglobulin. J. Biol. Chem. 249 5388–93. [PubMed] [Google Scholar]
- Hendsch, Z.S., Jonsson, T., Sauer, R.T., and Tidor, B. 1996. Protein stabilization by removal of unsatisfied polar groups: Computational approaches and experimental tests. Biochemistry 35 7621–5. [DOI] [PubMed] [Google Scholar]
- Herzberg, O. and James, M.N. 1985. Structure of the calcium regulatory muscle protein troponin-C at 2.8 A resolution. Nature 313 653–9. [DOI] [PubMed] [Google Scholar]
- Ikura, M. 1995. Molecular and structutral basis of target recognition by calmodulin. Annu. Rev. Biophys. Biomol. Struct. 24 85–116. [DOI] [PubMed] [Google Scholar]
- Ikura, M. 1996. Calcium binding and conformational response in EF-hand proteins. Trends Biochem. Sci. 21 14–7. [PubMed] [Google Scholar]
- Ikura, M., Marion, D., Kay, L.E., Shih, H., Krinks, M., Klee, C.B., and Bax, A. 1990. Heteronuclear 3D NMR and isotopic labeling of calmodulin. Towards the complete assignment of the 1H NMR spectrum. Biochem. Pharmacol. 40 153–60. [DOI] [PubMed] [Google Scholar]
- Ikura, M., Spera, S., Barbato, G., Kay, L.E., Krinks, M., and Bax, A. 1991. Secondary structure and side-chain 1H and 13C resonance assignments of calmodulin in solution by heteronuclear multidimensional NMR spectroscopy. Biochemistry 30 9216–28. [DOI] [PubMed] [Google Scholar]
- Julenius, K., Thulin, E., Linse, S., and Finn, B.E. 1998. Hydrophobic core substitutions in Calbindin D9k: Effects on stability and structure. Biochemistry 37: 8915-8925. [DOI] [PubMed] [Google Scholar]
- Kordel, J., Skelton, N.J., M., A., and Chazin, W.J. 1993. High-resolution structure of calcium-loaded calbindin D9k. J. Mol. Biol. 231 711–734. [DOI] [PubMed] [Google Scholar]
- Kraulis, P.J. 1991. MOLSCRIPT: A program to produce both detailed and schematic plots of protein structures. J. Appl. Crystallogr. 24 946–950. [Google Scholar]
- Kuboniwa, H., N., T., Grzesiek, S., Ren, H., Klee, C.B., and Bax, A. 1995. Solution structure of calcium-free Calmodulin. Nature Structural Biology 2: 768-776. [DOI] [PubMed] [Google Scholar]
- Linse, S., Helmersson, A., and Forsen, S. 1991a. Calcium binding to calmodulin and its globular domains. J. Biol. Chem. 266 8050–4. [PubMed] [Google Scholar]
- Linse, S., Johansson, C., Brodin, P., Grundstrom, T., Drakenberg, T., and Forsen, S. 1991b. Electrostatic contributions to the binding of Ca2+ in calbindin D9k. Biochemistry 30 154–62. [DOI] [PubMed] [Google Scholar]
- Lumb, K.J. and Kim, P.S. 1995. A buried polar interaction imparts structural uniqueness in a designed heterodimeric coiled coil. Biochemistry 34 8642–8. [DOI] [PubMed] [Google Scholar]
- Marion, D. and Wuthrich, K. 1983. Application of phase sensitive two-dimensional correlated spectroscopy (COSY) for measurements of 1H–1H spin–spin coupling constants in proteins. Biochem. Biophys. Res. Commun. 113 967–74. [DOI] [PubMed] [Google Scholar]
- Masino, L., Martin, S.R., and Bayley, P.M. 2000. Ligand binding and thermodynamic stability of a multidomain protein, calmodulin. Prot. Sci. 9 1519–29. [DOI] [PMC free article] [PubMed] [Google Scholar]
- Merrit, E.A. and Bacon, D.J. 1997. Raster3D: Photorealistic Molecular Graphics. Meth. Enzymol. 277 505–524. [DOI] [PubMed] [Google Scholar]
- Meyer, D.F., Mabuchi, Y., and Grabarek, Z. 1996. The role of Phe-92 in the Ca(2+)-induced conformational transition in the C-terminal domain of calmodulin. J. Biol. Chem. 271 11284–90. [DOI] [PubMed] [Google Scholar]
- Nelson, M.R. and Chazin, W.J. 1998a. An interaction-based analysis of calcium-induced conformational changes in Ca2+ sensor proteins. Prot. Sci. 7 270–82. [DOI] [PMC free article] [PubMed] [Google Scholar]
- Nelson, M.R. and Chazin, W.J. 1998b. Structures of EF-hand Ca(2+)-binding proteins: Diversity in the organization, packing and response to Ca2+ binding. Biometals 11 297–318. [DOI] [PubMed] [Google Scholar]
- Pace, C.N. 1986. Determination and analysis of urea and guanidine hydrochloride denaturation curves. Meth. Enzymol. 131 266–80. [DOI] [PubMed] [Google Scholar]
- Piotto, M., Saudek, V., and Sklenar, V. 1992. Gradient-tailored excitation for single-quantum NMR spectroscopy of aqueous solutions. J. Biomol. NMR 2 661–5. [DOI] [PubMed] [Google Scholar]
- Privalov, P.L. 1979. Stability of proteins: Small globular proteins. Adv. Prot. Chem. 33 167–241. [DOI] [PubMed] [Google Scholar]
- Raha, K., Wollacott, A.M., Italia, M.J., and Desjarlais, J.R. 2000. Prediction of amino acid sequence from structure. Prot. Sci. 9 1106–19. [DOI] [PMC free article] [PubMed] [Google Scholar]
- Rand, M.D., Lindblom, A., Carlson, J., Villoutreix, B.O., and Stenflo, J. 1997. Calcium binding to tandem repeats of EGF-like modules. Expression and characterization of the EGF-like modules of human Notch-1 implicated in receptor-ligand interactions. Prot. Sci. 6 2059–71. [DOI] [PMC free article] [PubMed] [Google Scholar]
- Sastry, M., Ketchem, R.R., Crescenzi, O., Weber, C., Lubienski, M.J., Hidaka, H., and Chazin, W.J. 1998. The three-dimensional structure of Ca(2+)-bound calcyclin: Implications for Ca(2+)-signal transduction by S100 proteins. Structure 6 223–31. [DOI] [PubMed] [Google Scholar]
- Schachman, H.K. 1987. From allostery to mutagenesis: 20 years with aspartate transcarbamoylase. Biochem. Soc. Trans. 15 772–5. [DOI] [PubMed] [Google Scholar]
- Skelton, N.J., Kordel, J., Akke, M., Forsen, S., and Chazin, W.J. 1994. Signal transduction versus buffering activity in Ca(2+)-binding proteins. Nat. Struct. Biol. 1 239–45. [DOI] [PubMed] [Google Scholar]
- Skelton, N.J., Kordel, J., and Chazin, W.J. 1995. Determination of the solution structure of Apo calbindin D9k by NMR spectroscopy. J. Mol. Biol. 249 441–462. [DOI] [PubMed] [Google Scholar]
- Slupsky, C.M. and Sykes, B.D. 1995. NMR solution structure of calcium-saturated skeletal muscle troponin C. Biochemistry 34 15953–64. [DOI] [PubMed] [Google Scholar]
- Sorensen, B.R. and Shea, M.A. 1998. Interactions between domains of apo calmodulin alter calcium binding and stability. Biochemistry 37 4244–53. [DOI] [PubMed] [Google Scholar]
- Stites, W.E., Gittis, A.G., Lattman, E.E., and Shortle, D. 1991. In a staphylococcal nuclease mutant the side-chain of a lysine replacing valine 66 is fully buried in the hydrophobic core. J. Mol. Biol. 221 7–14. [DOI] [PubMed] [Google Scholar]
- Svensson, L.A., Thulin, E., and Forsen, S. 1992. Proline cis-trans isomers in calbindin D9k observed by X-ray crystallography. J. Mol. Biol. 223 601–6. [DOI] [PubMed] [Google Scholar]
- Waldburger, C.D., Schildbach, J.F., and Sauer, R.T. 1995. Are buried salt bridges important for protein stability and conformational specificity? Nat. Struct. Biol. 2 122–8. [DOI] [PubMed] [Google Scholar]
- Wishart, D.S., Bigam, C.G., Yao, J., Abildgaard, F., Dyson, H.J., Oldfield, E., Markley, J.L., and Sykes, B.D. 1995. 1H, 13C and 15N chemical shift referencing in biomolecular NMR. J. Biomol. NMR 6 135–40. [DOI] [PubMed] [Google Scholar]
- Young, M., Kirshenbaum, K., Dill, K.A., and Highsmith, S. 1999. Predicting conformational switches in proteins. Prot. Sci. 8 1752–64. [DOI] [PMC free article] [PubMed] [Google Scholar]
- Zeng, X., Herndon, A.M., and Hu, J.C. 1997. Buried asparagines determine the dimerization specificities of leucine zipper mutants. Proc. Nat. Acad. Sci. 94 3673–8. [DOI] [PMC free article] [PubMed] [Google Scholar]
- Zhang, M., Tanaka, T., and Ikura, M. 1995. Calcium-induced conformational transition revealed by the solution structure of apo calmodulin. Nat. Struct. Biol. 2 758–767. [DOI] [PubMed] [Google Scholar]