Abstract
The dynamics of the unfolding process of bovine pancreatic ribonuclease A (RNase A) unfolded by dithiothreitol (DTT) at a low concentration of 1:30 were investigated in alkaline phosphate-buffered saline solutions at 303K and 313K by using proton nuclear magnetic resonance (1H NMR) spectra. Three NMR spectral parameters including Shannon entropy, mutual information, and correlation coefficient were introduced into the analysis. The results show that the unfolding process of RNase A was slowed to the order of many hours, and the kinetics of the unfolding pathway described by the three parameters is best fit by a model of two consecutive first-order reactions. Temperature greatly influences the rate constants of the unfolding kinetics with different temperature effects observed for the fast and the slow processes. The consistencies and the differences between the three sets of parameters show that they reflect the same relative denaturation pathway but different spectra windows of the unfolding process of RNase A. The results suggest that the unfolding process of RNase A induced by low concentrations of DTT is a two-phase pathway containing fast and slow first-order reactions.
Keywords: Correlation coefficient, image analysis, mutual information, proton nuclear magnetic resonance, ribonuclease A, Shannon entropy, unfolding dynamics
Unfolding and refolding pathways of numerous proteins have been studied using a variety of different redox systems and solution conditions (Jaenicke and Rudolph 1989). The protein structural transitions that occur in the pathway are at the heart of the unfolding and refolding processes. Dynamic analysis of the unfolding/refolding pathways and identification of the specific conformational changes that form the individual intermediates involved in the rate-limited pathway(s) can distinguish one pathway from another (Rothwarf and Scheraga 1993a,b). Such studies in turn provide new insights into the functional properties and mechanisms of proteins that will lead to a more detailed and more complete description of biological functions (Alexandrescu et al. 1998). It is usually of considerable interest to estimate the conformational changes both of the whole protein tertiary structure in solution and of specific sites observed by spectroscopic techniques. We propose extending these investigations by image analysis through the use of 1H nuclear magnetic resonance (NMR) spectroscopy, which plays a prominent role in such studies because of its ability to follow protein unfolding and refolding with a direct, continuous, nondestructive method at an atomic level to yield detailed information about the structure of small proteins in solution (for review, see Wagner 1997).
Bovine pancreatic ribonuclease A (RNase A), which is well characterized as a single-domain protein that contains 124 residues with four native disulfide bonds, has played a crucial role as a model system in studies of protein structure, folding, and enzyme catalysis. Its native state has been studied by using NMR (Rico et al. 1989; Santoro et al. 1993). The refolding and unfolding pathway of RNase A has been studied extensively by using NMR and other biophysical techniques (for review, see Neira and Rico 1997). Later studies suggested that RNase A folds and unfolds through multiple pathways determined by several rate-limited transition intermediates (Rothwarf and Scheraga 1993b; Li et al. 1995). The complexity of the multiple pathways means that different mechanisms may occur with different types of redox systems and different solution conditions (Rothwarf and Scheraga 1993c). A comprehensive understanding of the folding and unfolding process of RNase A requires that the different conditions and methods for fundamental experiments must be stated carefully.
NMR studies of RNase A have led to assignments for the spin systems of the 124 amino acids residues and sequence-specific assignments by using 1H NMR, 2-D 1H-1H homonuclear correlation spectra and amide proton/deuterium exchange (Rico et al. 1989; Robertson et al. 1989). These assignments were used to locate conformational changes associated with the binding of nucleotides, substrates, and inhibitors to RNase A and with chemical modifications of RNase A. Recent advances in NMR spectroscopy, primarily through the use of triple-resonance experiments involving uniformly 15N- and 13C-enriched proteins, have provided new insights into the structure, stability, and conformational dynamics of proteins (Cavanagh et al. 1995). NMR methods have been used to characterize the solution structure of the major folding intermediates of proteins and analogs of the rate-determining intermediates (Adler and Scheraga 1990; Talluri et al. 1994; Laity et al. 1997; Shimotakahara et al. 1997). NMR spectroscopy also has been used to monitor indirectly the kinetics of regular backbone structural information in RNase A during unfolding and refolding (Biringer and Fink 1982; Zhang et al. 1995; Alexandrescu et al. 1998). Although NMR can provide extensive conformation and structural information by chemical shift (Wishart et al. 1991), scalar coupling constants (Smith et al. 1996), NMR peak intensities (Biringer and Fink 1982), nuclear Overhauser enhancement (NOE) (Williams 1989), resonance linewidth in a NMR spectrum, and other specific structural restraints that represent a time average over the ensemble of conformational substates, few dynamic NMR measurements have been recorded for relatively large native proteins such as RNase A because of the limits imposed by significant overlap of the resonances in the 1H NMR spectra and the excessively long times needed for homonuclear 2-D NMR spectra to record the rapid changes in the dynamic process. To overcome these limits, investigators have used different methods such as hydrogen exchange (Zhang et al. 1995) and 15N backbone labeling (Alexandrescu et al. 1998) in NMR studies of the dynamics of RNase A.
In traditional NMR studies, some specific nuclear resonances have to be assigned to conduct protein dynamics investigations. In this article, the whole spectrum in H2O for image analysis was obtained, and no assignments were made as usual. We propose to analyze the complex 1-D NMR data by using image analysis algorithms. Three spectral parameters including Shannon entropy, mutual information, and correlation coefficient were introduced into the analysis. The kinetic patterns then were characterized by these parameters. The primary goal of the present article is to introduce a new insight into the dynamic investigation of the unfolding/refolding pathway of RNase A in reduced dithiothreitol (DTT). The specific objectives are: (1) to determine conditions that are slow enough for 1H NMR (and for 2-D NMR) monitoring; (2) to calculate the image specific parameters of the unfolding pathways; and (3) to compare the denatured pathways at different temperatures. The present study used image analysis of the 1H NMR spectra to focus on the detailed kinetic data analysis of all of the conformational changes occurring when a protein unfolds.
Results and discussion
Unfolding process monitored by 1H NMR spectrum
Several technical problems had to be overcome to obtain useful NMR spectra during unfolding. The major problems were associated with the great influence of the proton resonance in the solvent with DTT and with obtaining a sufficient S/N, given the time constraints imposed by the protein solubility and the kinetics of the rapid conformational change of RNase A during unfolding. A low DTT concentration to a 30-fold molar excess of the protein was explored to slow the unfolding process to the order of many hours with spectral acquisitions collected in blocks of 400, which enabled spectra to be recorded at 20-min intervals, with solvent suppression conducted by presaturation to increase the S/N. For practical reasons, relating especially to RNase A solubility and spectra resolution, temperatures between 293K and 323K were deemed most appropriate for these experiments.
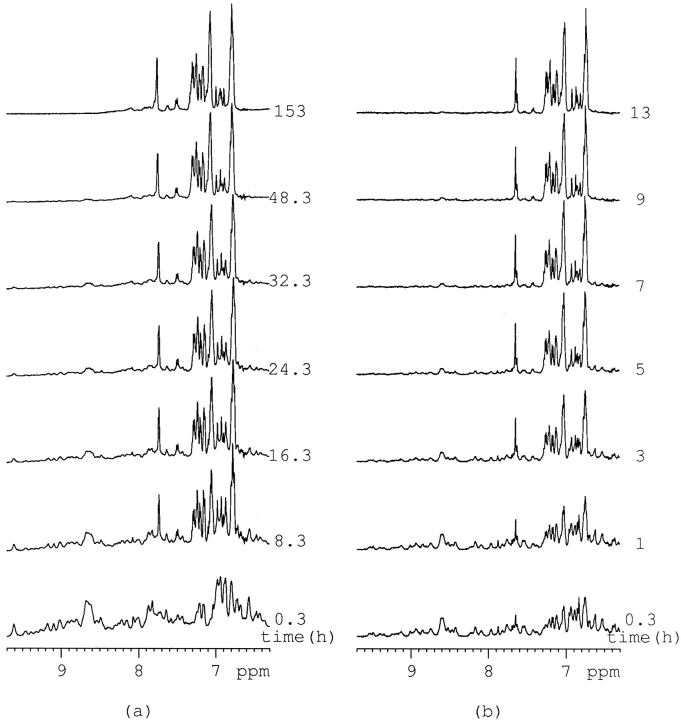
The large size of native RNase A means that the proton NMR spectra are densely crowded with resonance lines in the downfield region. In previous NMR analyses, some specific residue resonances had to be assigned to probe the protein unfolding process. This was accomplished by conducting the experiment in deuterium or by observing some specific nuclear resonance instead of the proton resonance. In this article, no assignments were made as usual, and the whole spectrum in H2O was used for image analysis. Figure 1 ▶, a and b, shows the behavior of the proton NMR spectrum between 6.3 and 10 ppm of RNase A unfolded by a 30-fold molar excess of DTT at 303K and 313K. The unfolding process at 303K is very similar but much slower than that at 313K. Obviously, temperature greatly influences the rate of RNase A unfolding in DTT, but the result is a similar endpoint.
Fig. 1.
Downfield region of the 1H NMR spectra of RNase A unfolded by a 30-fold molar excess of DTT in 0.5 mL 100 mM PBS buffer with a concentration of 1.0–1.1mM at 303K (a) and 313K (b).
In their pioneering article, McDonald and Phillips (1967) showed that the amino acid side chain 1H NMR lines in denatured, "random coil" polypeptide chains correspond closely to the sum of the resonances in the constituent amino acid residues. This observation can be rationalized by the assumption that all amino acid side chains in an extended, flexible polypeptide chain, exposed to the same solvent environment, so that multiple copies of a specified amino acid in the sequence have identical chemical shifts. Thus, a random coil spectrum of the polypeptide caused the aggregation of the NMR lines and the increased linewidths. The increased complexity of the NMR spectrum of a regular folded globular protein results primarily from conformation-dependent chemical shift dispersion. Chemical shift dispersion arises because interior peptide segments in globular proteins are shielded from the solvent and are nearest neighbors to other peptide segments, so that different residues experience different microenvironments.
Such dispersion by the spatial protein structure can also arise for protons within the same residue due to the difference in symmetry and configuration of specific residues. In Figure 1 ▶, increasing unfolding time results in less dispersion and wider linewidths. The intensities of most amide proton resonance peaks become smaller, and the lines in the downfield region begin to aggregate to some specific resonance. After ∼9 h for 313K and 50 h for 303K, the amide proton resonance peaks disappeared indicating that the protein was mostly denatured.
Image analysis
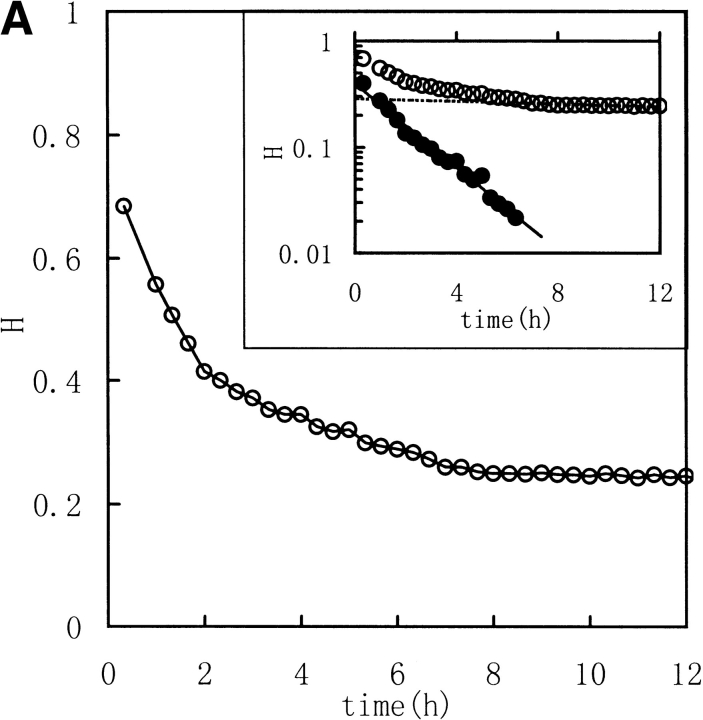
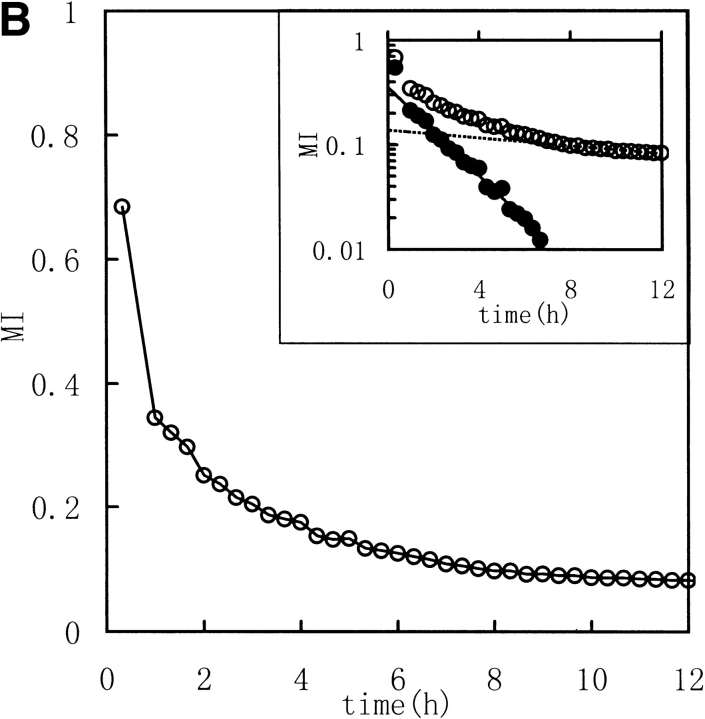
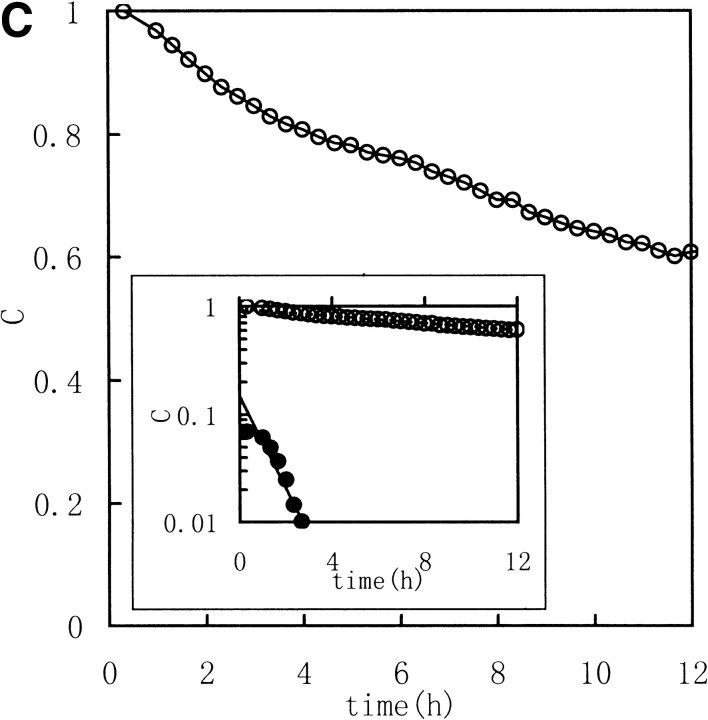
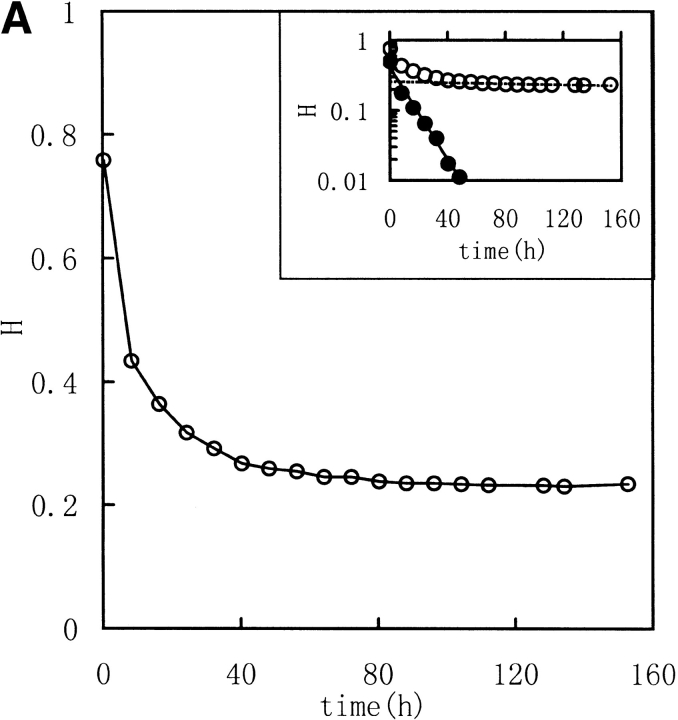
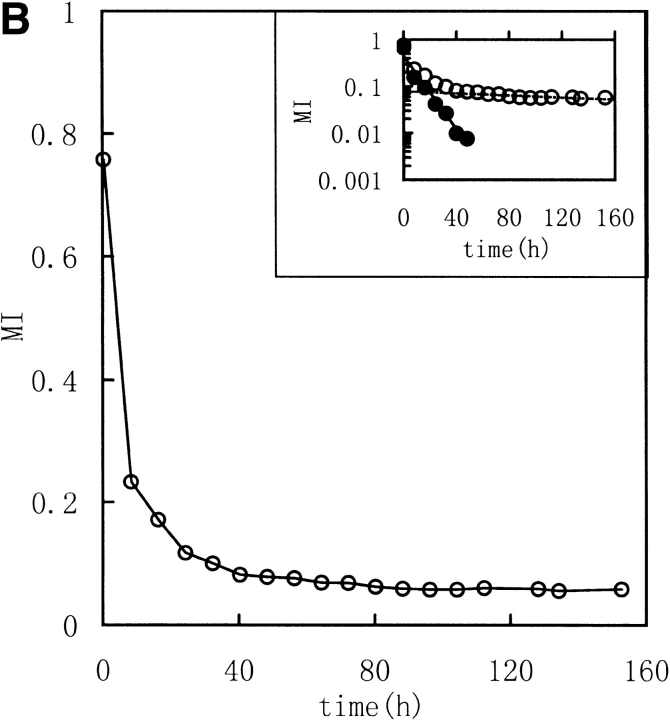
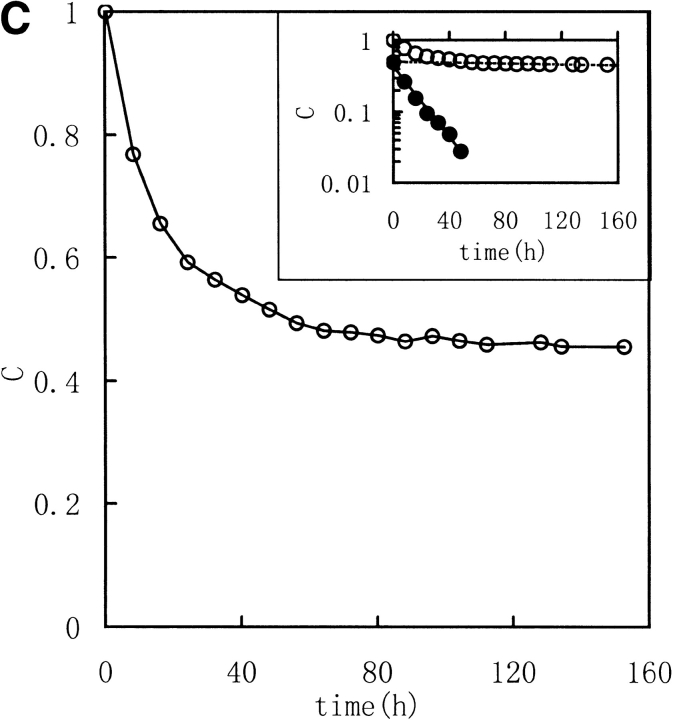
Three image parameters (Shannon entropy, mutual information, and correlation coefficient) were calculated to characterize the 1H NMR spectra of the unfolding process of RNase in DTT, (Fig. 2 ▶ [313K] and Fig. 3 ▶ [303K]). The data were best fit by a model of two consecutive first-order reactions, with rate constants listed in Table 1. The two-phase nature of the reaction is quite evident in semilogarithmic plots of the data. These results suggest that it should be possible to acquire unfolding/refolding dynamics with these three parameters.
Fig. 2.
Kinetic course of Shannon entropy (A), mutual information (B), and correlation coefficient (C) values of 1H NMR spectra of RNase A reduction by a 30-fold molar excess of DTT in 0.5 mL, 100 mM PBS buffer at 313K with a protein concentration of 1.0–1.1 mM were presented as in the downfield (6.3–10 ppm) region. (Insets) Semilogarithmic plots. (Open circles) Experimental data. (Filled circles) Points obtained by subtracting the contribution of the slow phase from curve (broken lines).
Fig. 3.
Kinetic course of Shannon entropy (A), mutual information (B), and correlation coefficient (C) values of 1H NMR spectra of RNase A during unfolding. Experimental conditions were as for Fig. 2 ▶ except that the temperature was 303K. (Insets) Semilogarithmic plots. (Open circles) Experimental data. (Filled circles) Points obtained by subtracting the contribution of the slow phase from curve (broken lines).
Table 1.
Rate constants for changes in Shannon entropy, mutual information and correlation coefficient observed in unfolding RNase A by a 30-fold molar excess of DTT, in PBS, pH 8.0, at 313K and 303K
| kH (× 10−4s−1)a | kMI (× 10−4s−1)b | kC (× 10−4s−1)c | ||||
| Temperature | kHfd | kHse | k MIf | kMIs | kCf | kCs |
| 313K | 70 ± 2g | 1.4 ± 0.3 | 102 ± 4 | 9.9 ± 0.7 | 100 ± 4 | 5.8 ± 0.3 |
| 303K | 12.9 ± 0.9 | 0.14 ± 0.03 | 15 ± 1 | 0.4 ± 0.1 | 10.8 ± 0.8 | 0.12 ± 0.2 |
a,b,c Rate constants of Shannon entropy, mutual information and correlation coefficient.
d,e The subscript f indicates the rate constants for the fast process and s indicates that of the slow process.
g The error was calculated as the standard deviation of the linear regression.
As described in Materials and methods, Shannon entropy values reflect the entropy of the spectra, which is the sum probability of the peak intensity in a certain region. In other words, the H values reflect the dispersion properties of the resonance in selected regions. When the intensity distribution is dominated by a single or a few peak amplitude probabilities (as with a random coil peptide), H will be small because the spectrum is "regular". When the distribution is dominated by good dispersion of peak amplitude probabilities (as with a well-folded peptide), H will be large because the spectrum is "irregular". Thus, a well-folded protein structure has a much different spectrum entropy than a unfolded structure or a random coil structure. So the Shannon entropy reflects the conformational changes during the unfolding and refolding processes. In Figures 2 and 3 ▶ ▶, with increasing time of RNase A unfolding in DTT, the H value of the downfield region exponentially decreased reflecting the change of the regular folded structure of the native protein to extended random coil.
Mutual Shannon information reflects the correlation of the Shannon entropy between the corresponding data of two spectra. The MI value increases as the degree of correlation increases. When the two spectra are statistically independent, MI is zero, and when the two spectra are statistically equal, MI is equal to the Shannon entropy value for the spectrum. MI reflects how many unchangeable parts occur in the spectra. In Figures 2 and 3 ▶ ▶, the MI values, calculated between the jth and the first spectra (corresponding to zero), exponentially decreased to nearly zero with increasing unfolding time. Thus, MI follows the process by indicating the existence of fewer and fewer resonance peaks maintained, or, in other words, MI indicates how much is "unchanged".
The correlation coefficient reflects the correlation between two spectra using their covariance. A larger value of C indicates more correlation. When the two spectra are statistically independent, C is zero, and when the two spectra are statistically equal (linearly correlated), C is 1. The correlation coefficient is a traditional method for comparing the correlation between two data sets, and it can remove some system error caused by the inconsistencies of the Fourier transform and solvent suppression. In Figures 2 and 3 ▶ ▶, the C value, calculated between the jth and the first spectra (corresponded to zero), exponentially decreased as did H and MI. All three parameters indicate a two-phase process for the RNase A unfolding. Native RNase A (N) was converted rapidly to an intermediate state (I) and then slowly converted to the unfolded state (U):
 |
This biphasic mechanism is quite consistent with that reported by Li et al. (1995). The results suggest that RNase A unfolds through similar pathways in both a strong reductive reagent (Li et al. 1995; 1250-fold molar excess of DTT) and a weak reductive reagent (in this study, 30-fold molar excess of DTT). The results of Li et al. differ from those reported here in that parallel pathways could not be distinguished by image analysis in this work because of the similar kinetic rate constants of the two parallel steps.
The kinetic rate constants given by H, MI, and C were very similar though not exactly equal because the three parameters each have their own specific windows, which are sensitive to different inherent spectrum properties. The similarities in the kinetic constants indicated that these three methods could be used to reliably evaluate the kinetics while ignoring the severe overlap caused by the great amount of amino acid residue proton resonance in the 1H NMR spectrum.
Temperature influence
H, MI, and C all clearly characterized the different kinetic rate constants for the unfolding process at 303K and 313K. The starting and ending points for the different temperatures (different conditions) were consistent except for the small variation due to chemical shift. Therefore, the parameters can be used to compare the properties of the different unfolding/refolding processes at different conditions without modification.
Temperature greatly influences the rate of the unfolding process. The rate constants for the fast unfolding process at 313K are 5–10 times faster than those at 303K, and those of the slow processes are 9–50 times faster (Table 1). Therefore, temperature has a very different effect on the two process affecting the slow process 2–5 times more than the fast process for our solvent conditions. Analysis of the data obtained by Li et al. (1995) resulted in a similar effect between 15°C and 25°C. Both results suggest that a 10°C temperature increase led to a 2–5-fold increase of ks/kf in the two-phase model.
Half-life period
Analysis of the H, MI, and C data indicates that 50% of the total was completely unfolded within 105 ± 4 (H), 60 ± 3 (MI), and 252 ± 11 (C) min for the process at 313K and 479 ± 33 (H), 176 ± 13 (MI), and 723 ± 51 (C) min for that at 303K (Table 2). The significant points to note are that (1) the difference in the half-life periods for the three parameters indicates that they reflect different events within the spectrum and should be considered together, and (2) the τ303K/τ313K values are quite similar (between 3 and 5), especially those for MI and C, which reflect the correlation between the two spectra whereas H reflects the self-dispersion properties of the spectrum.
Table 2.
Half life period characterized by Shannon entropy, mutual information and correlation coefficient observed in unfolding RNase A by a 30-fold molar excess of DTT, pH 8.0, 313K and 303K
| Temperature | τH (min)a | τMI (min)b | τC (min)c |
| 313K | 105 ± 4d | 60 ± 3 | 252 ± 11 |
| 303K | 479 ± 33 | 176 ± 13 | 723 ± 51 |
a,b,c Half life period of Shannon entropy, mutual information and correlation coefficient.
d The error was calculated as the error of the rate constants.
Because protein unfolding includes very different events that cover orders of magnitude on the time scale, a variety of detection techniques are needed that are sensitive to different inherent properties of the protein and that complement each other with respect to their specific window. The results reported herein show the feasibility of monitoring protein unfolding by NMR spectroscopy using three image parameters at a time resolution scale much slower than the typical conditions of well-known techniques including normal NMR techniques (Jaenicke and Rudolph 1989). One of the strongest points of NMR spectroscopy is the ability to measure at an atomic level and to yield detailed information about the solution structure. Therefore, NMR techniques can be used to analyze very different spectral windows to follow the folding/unfolding processes by following either the changed secondary structural elements or the folding events that can be attributed to the tertiary structures (Biringer and Fink 1982; Alexandrescu et al. 1998). Thus, perfect time correlation is ensured between unfolding events that otherwise can only be observed with different techniques, which often require different experimental conditions. One specific advantage of image analysis is the ability to monitor the process without traditional assignments either at a whole protein level or at specific part levels that were determined using different NMR experimental conditions. We attempt to provide the structural information in an indirect but much simpler way by using several typical spectral parameters. This new approach combining typical well-known techniques certainly has a great potential for complementing well-established techniques in either NMR spectroscopy or other spectral techniques in describing structural events that occur during protein unfolding or refolding processes and should find a wide range of applications.
Materials and methods
Sample preparation
Highly purified lyophilized ribonuclease A (type XII-A) from bovine pancreas (RNase A) was purchased from Sigma Chemical Co. and used without further purification. D2O was obtained from the Cambridge Isotope Laboratories Inc. (99.8% pure). DTT was a product of Sigma Chemical Co. All other reagents were of the highest grade commercially available. NMR samples of native RNase A were dissolved in 0.5 mL 100 mM phosphate sodium solvent (PBS; contains 10% D2O to provide a signal for the lock), pH 8.0 (no corrections for isotope effects) at 1.0–1.1 mM (14 mg/mL). RNase A was unfolded with a 30-fold molar excess of DTT. Low concentrations of RNase A and DTT were used to avoid aggregation and to make the unfolding process slow enough to be observed by NMR, on the order of several hours.
NMR spectroscopy
All 1H NMR experiments were conducted on a Bruker AM 500 superconductor spectrometer at Tsinghua University. The experimental temperature was maintained at either 313K or 303K. The thermal transition properties of RNase A were studied to assure the thermal stability at these conditions. The carrier frequency was fixed at the center of the H2O/HOD resonance frequency. The chemical shifts of the spectra were referenced to the most upfield resonance that in turn had been calibrated against DSS. The 90° pulse width was 6.5 μs, the sweep width was 8333 Hz, and each free induction decay (FID) had 400 scans with 16K data points. Two dummy scans were performed for each FID with a recycle delay of 1.8 s. Solvent suppression was performed by presaturation at all times except during acquisition. For a given sample, the unfolding experiments were conducted over a contiguous block of time without removing the sample from the spectrometer. Spectra were collected every 20 min (313K) or every 480 min (8 hours, 303K) after DTT was added. Zero corresponds to the DTT injection time into the cold NMR tube. To allow for temperature equilibrium and operational delay, we obtained the first spectra at 10 min.
Data analysis
The Fourier transform of the FID signal was obtained without additional modification. The phase correction parameters were the same as for the first spectrum. The data were transferred to the SGI workstation by using UXNMR software.
Image analysis
The one-dimensional acquisition and processed data sets were stored in files as a sequence of 32-bit integer numbers in binary format. For image analysis, the files were converted and stored as the standard data files in the JCAMP-DX format (FIX form) with 16K digital data points as a sequence of 32-bit integers that could be read easily by other data systems (McDonald and Wilks 1988). This plain text file format then was converted to MATLAB file format for further calculations. The three parameters (Shannon entropy, H; mutual Shannon information, MI; and correlation coefficient, C) that describe the nature of each image (spectra) and the correlation between different images were calculated using MATLAB software accomplished by programs developed in-house. The analysis routines described the kinetics of the unfolding/refolding process based on image characterization of the whole or selected parts of the spectra. We did not assign the resonances of specific spin systems but only analyzed the conformational changes of RNase A by considering the changes between two spectra, because when the protein conformation changes, the spectrum must also change (the chemical shift, the spin-spin coupling constants, the NMR line intensities, the nuclear Overhauser enhancement (NOE), the resonance linewidth in a NMR spectrum, and other specific parameters of all or part of each specific spin system). For continuous conformational changes, the method provided a new viewpoint by considering the protein structural dynamics and the conformational changes for the entire protein.
Shannon entropy (H)
Entropy is one of the most important quantities in thermodynamics, statistical mechanics, information theory, and statistics (Jones 1979; Ohya and Petz 1993). In statistical physics, the second law of thermodynamics and the irreversibility of dynamic processes are characterized by increasing entropy. In thermal equilibrium, the entropy of a physical system is given by the celebrated Boltzman formula, which defines the relationship between thermodynamic entropy and probability. Letting pj be the probability that a physical system is in the jth microscopic state and letting W be the total number of all possible microscopic states for the physical system under some constraint, then the entropy (the Boltzmann-Gibbs-Shannon entropy) of a finite probability distribution (p1, p2, ..., pW) is given by (for Boltzmann constant kB = 1),
 |
1 |
which is strongly related to the asymptotics of certain probabilities. In this article, the mathematical formulation for Shannon entropy is underpinned by results from graph theory. To use this approach, we define a cutoff rank, Rc, to normalize the sequence amplitude data in an NMR data file. The cutoff, Rc, is taken as the rank at which deviation from zero (baseline). After determining the amplitude range for the selected region, Rc is used to bin the peak amplitude into W equally spaced "containers" (group), and the number of amplitudes in each container is then determined. W is a scale to generate a sequence of states, X1, ..., XW, by simply dividing the peak amplitude range into W equal parts. Letting N(Xj) be the number of points in the Xj microscopic states, the probability pj is given by pj = N (Xj) / N, where N is the total number of data points in the selected area. The Shannon entropy is then calculated from equation 1. The entropy can be regarded as a measure of uncertainty. When all the events are equally probable, the system has the greatest uncertainty as to which event will occur. Therefore, the entropy should be a maximum in such a situation. Thus, lower values of H indicate that the distribution is dominated by a single or a few peak amplitude probabilities. Therefore H reflects the dispersion properties of the chemical shift of the protons in the selected regions. Generally speaking, the protons in a regular folded protein have very different chemical conditions. Thus, a well-folded protein structure has more different chemical shifts than an unfolded or a random coil structure. So the Shannon entropy reflects the structural changes.
The entropy is positive or zero, but the maximum value is limited. Jones (1979) showed this by the theorem that H(p) ≤ log W with equality only when p1 = p2 = ... = pW. The value of the Shannon entropy depends on the scale W. W is determined according to statistical rules that grouped data yields less information. In general, increasing W provides more detailed information. But W is limited by the signal to noise ratio (S/N) for when W is greater than the S/N ratio; no more useful information can be obtained, but the calculational time is longer. So W normally is chosen to be around the signal to noise ratio (S/N) in the selected region. In this article, S/N is ∼30 for the downfield region (6–10 ppm), so W is ∼30. The Shannon entropy for different values of W from 10 to 1000 were calculated, and it was found that for W >10, plots of the Shannon entropy versus temperature were very similar (gave equal information). The calculations showed that increasing W narrowed the range of H, so W was chosen as 10.
Because the Shannon entropy depends on the scale W, H should be normalized to a comparable level. In this study, H was normalized by log W
 |
2 |
Shannon mutual information (MI)
The peak appearance probability density function of a RNase A 1H NMR spectrum, which describes a multivariate process corresponding to its structural states, can be characterized in terms of entropy. Entropy is the average of the self-information. The connections between two spectra and a definition of information relating the two spectra are needed. Mutual information (MI; Jones 1979) specifies the possibility of different numbers of matching events in two events or two systems. MI is a general measure of the deviation from independence, or correlation, among many variables. Letting S1 be a system with events X1, ..., Xn, the associated probabilities being p1, ..., pn with pj ≥ 0, Σnj=1 = 1. Letting S2 be a system with events Y1, ..., Ym, the associated probabilities being q1, ..., qm with qk ≥ 0, Σmk=1 = 1. The mutual information MI(S1, S2) between the events S1 and S 2 is defined by
 |
3 |
where pjk specifies the connection between the two systems by the statement that one event from S1 and one event from S 2 must occur. H(S1) and H(S2) are the Shannon entropies of S1 and S2 considered independently, and the joint entropy H(S1 ∩ S2) is defined by
 |
4 |
The mutual information MI(Xj, Yk) between the events Xj and Yk is defined by
 |
5 |
The mutual information between systems is the average of the mutual information between events. MI is zero if S1 and S2 are statistically independent and is positive otherwise. MI of two systems cannot exceed the sum of their separate entropies. That is to say that some of the uncertainty about S1 will, in general, be uncertainty about S2 as well. In this study, it reflects that the spectrum will retain some parts unchanged.
Correlation coefficient (C) is a traditional coefficient that describes the correlation between two systems. The definition and program given in MATLAB were used with the correlation coefficient C(X,Y) between X and Y given by
 |
6 |
Where SXY is the covariance between X and Y whereas SXX and SYY are the variances of X and Y. The correlation coefficient is zero if X and Y are statistically independent and is 1 if X and Y have the most significant correlation (X is linear to Y).
The downfield region of each spectrum was selected instead of the whole spectrum to remove the large influence of the solvent resonance of H2O/HDO and the resonance of the large amount of 1H in DTT. The downfield region is defined as 6.3–10.0 ppm, which contains the main resonances of all the amide protons both on the backbone and on the side chains and ring protons of the aromatic and indole amino acid residues that reflect most of the conformation of the secondary structure and the super secondary structure.
Kinetic analysis
Linear plots of the data were accomplished using ln [A(t)] versus t diagrams, where A is the Shannon entropy, mutual information, or correlation coefficient of the protein and t is the unfolding time. The unfolding kinetics were analyzed by a linear expansion least-squares algorithm and were also performed graphically using a least mean squares fit procedure. The errors of the rate constants were defined as the standard deviation. All calculations were performed using Microsoft EXCEL.
Acknowledgments
This investigation was supported by the National Key Basic Research Special Funds, P. R. China, No. G1999075607, the National Key Science and Technology Item, P. R. China, No. 96-900-09-03, and THSJZ of Tsinghua University, P. R. China.
The publication costs of this article were defrayed in part by payment of page charges. This article must therefore be hereby marked "advertisement" in accordance with 18 USC section 1734 solely to indicate this fact.
Abbreviations
C, correlation coefficient
DSS, 2,2-dimethyl-2-sila-pentanesulfonate
DTT, dithiothreitol
FID, free induction decay
H, Shannon entropy
MI, Shannon mutual information
NMR, nuclear magnetic resonance
NOE, nuclear Overhauser enhancement
PBS, phosphate-buffered saline
ppm, parts per million
RNase A, bovine pancreatic ribonuclease A
S/N, signal to noise ratio
2-D NMR, two-dimensional nuclear magnetic resonance.
Article and publication are at www.proteinscience.org/cgi/doi/10.1110/
References
- Adler, M. and Scheraga, H.A. 1990. Nonnative isomers of proline-93 and -114 predominate in the heat-unfolded ribonuclease A. Biochemistry 29 8211–8216. [DOI] [PubMed] [Google Scholar]
- Alexandrescu, A.T., Rathgeb-Szbo, K., Rumpel, K., Jahnke, W., Schulthess, T., and Kammerer, R. 1998. 15N backbone dynamics of the S-peptide from ribonuclease A in its free and S-protein bound forms: Toward a site-specific analysis of entropy changes upon folding. Protein Sci. 7 389–402. [DOI] [PMC free article] [PubMed] [Google Scholar]
- Biringer, R.G. and Fink, A.L. 1982. Observation of intermediates in the folding of ribonuclease A at low temperature using proton nuclear magnetic resonance. Biochemistry 21 4748–4755. [DOI] [PubMed] [Google Scholar]
- Cavanagh, J., Fairbrother, W.J., Palmer III, A.G., and Skelton, N.J. 1995. Protein NMR spectroscopy. Academic Press, London.
- Jaenicke, R. and Rudolph, R. 1989. Folding proteins. In Protein structure, a practical approach. (ed. T.E. Creighton), pp. 191–224. IRL Press, New York.
- Jones, D.S. 1979. Elementary information theory. Oxford University Press, Oxford.
- Laity, J.H., Lester, C.C., Shimotakahara, S., Zimmerman, D.E., Montelione, G.T., and Scheraga, H.A. 1997. Structural characterization of an analog of the major rate-determining disulfide folding intermediate of bovine pancreatic ribonuclease A. Biochemistry 36 12683–12699. [DOI] [PubMed] [Google Scholar]
- Li, Y.J., Rothwarf, D.M., and Scheraga, H.A. 1995. Mechanism of reductive protein unfolding. Nat. Struct. Biol.20 2 489–494. [DOI] [PubMed] [Google Scholar]
- McDonald, C.C. and Phillips, W.D. 1967. Manifestations of the tertiary structures of proteins in high-frequency nuclear magnetic resonance. J. Am. Chem. Soc. 89 6332–6341. [DOI] [PubMed]
- McDonald, R.S. and Wilks, P.A. 1988. JCAMP-DX: A standard form for exchange of infrared spectra in computer readable form. Appl. Spectrosc. 42 151–162. [Google Scholar]
- Neira, J.L. and Rico, M. 1997. Folding studies on ribonuclease A, a model protein. Fold. & Des. 2 R1–R11. [DOI] [PubMed]
- Ohya, M. and Petz, D. 1993. Quantum entropy and its use. Springer-Verlag, Heidelberg.
- Pace, N.C., Shirley, B.A., and Thomson, J.A. 1989. Measuring the conformational stability of a protein. In protein structure, a practical approach. (ed. T.E. Creighton), pp. 311–330. IRL Press, New York.
- Rico, M., Bruix, M., Santoro, J., Gonzales, C., Neira, J.L., Nieto, J.L., and Herranz, J. 1989. Sequential 1H-NMR assignment and solution structure of bovine pancreatic ribonuclease A. Eur. J. Biochem. 183 623–638. [DOI] [PubMed] [Google Scholar]
- Robertson, A.D., Purisima, E.O., Eastman, M.A., and Scheraga, H.A. 1989. Proton NMR assignment and regular backbone structure of bovine pancreatic ribonuclease A in aqueous solution. Biochemistry 28 5930–5938. [DOI] [PubMed] [Google Scholar]
- Rothwarf, D.M. and Scheraga, H.A. 1993a. Regeneration of bovine pancreatic ribonuclease A. 1. Steady-state distribution. Biochemistry 32 2671–2679. [DOI] [PubMed] [Google Scholar]
- ———. 1993b. Regeneration of bovine pancreatic ribonuclease A. 2. Kinetics of regeneration. Biochemistry 32 2680–2689. [DOI] [PubMed]
- ———. 1993c. Regeneration of bovine pancreatic ribonuclease A. 3. Dependence on the nature of the redox reagent. Biochemistry 32 2680–2689. [DOI] [PubMed] [Google Scholar]
- Santoro, J., González, C., Bruix, M., Neira, J.L., Nieto, J.L., Herranz, J., and Rico, M. 1993. High-resolution three-dimensional structure of ribonuclease A in solution by nuclear magnetic resonance spectroscopy. J. Mol. Biol. 229 722–734. [DOI] [PubMed] [Google Scholar]
- Shimotakahara, S., Rios, C.B., Laity, J.H., Zimmerman, D.E., Scheraga, H.A., and Montelione, G.T. 1997. NMR structural analysis of an analog of an intermediate formed in the rate-determining step of one pathway in the oxidative folding of bovine pancreatic ribonuclease A: Automated analysis of 1H, 13C, and 15N resonance assignments for wild-type and [C65S, C72S] mutant forms. Biochemistry 36 6915–6929. [DOI] [PubMed] [Google Scholar]
- Smith, L.J., Bolin, K.A., Schwalbe, H., MacArthur, M.W., Thornton, J.M., and Dobson, C.M. 1996. Analysis of main chain torsion angles in proteins: Prediction of NMR coupling constants for native and random coil conformations. J. Mol. Biol. 255494–506. [DOI] [PubMed] [Google Scholar]
- Talluri, S., Rothwarf, D.M., and Scheraga, H.A. 1994. Structural characterization of a three-disulfide intermediate of robonuclease A involved in both folding and unfolding pathways. Biochemistry 33 10437–10449. [DOI] [PubMed] [Google Scholar]
- Wagner, G. 1997. An account of NMR in structural biology. Nat. Struct. Biol., NMR Suppl. 10 841–844. [PubMed] [Google Scholar]
- Williams, R.J.P. 1989. NMR studies of mobility within protein structure. Eur. J. Biochem. 183 479–497. [DOI] [PubMed]
- Wishart, D.S., Sykes, B.D., and Richards, F.M. 1991. Relationship between nuclear magnetic resonance chemical shifts and protein secondary structure. J. Mol. Biol. 222 311–333. [DOI] [PubMed] [Google Scholar]
- Zhang, J., Peng, X.D., Jonas, A., and Jonas, J. 1995. NMR study of the cold, heat, and pressure unfolding of ribonuclease A. Biochemistry 34 8631–8641. [DOI] [PubMed] [Google Scholar]


