Abstract
Structural changes in T7 RNA polymerase (T7RNAP) induced by temperature and urea have been studied over a wide range of conditions to obtain information about the structural organization and the stability of the enzyme. T7RNAP is a large monomeric enzyme (99 kD). Calorimetric studies of the thermal transitions in T7RNAP show that the enzyme consists of three cooperative units that may be regarded as structural domains. Interactions between these structural domains and their stability strongly depend on solvent conditions. The unfolding of T7RNAP under different solvent conditions induces a highly stable intermediate state that lacks specific tertiary interactions, contains a significant amount of residual secondary structure, and undergoes further cooperative unfolding at high urea concentrations. Circular dichroism (CD) studies show that thermal unfolding leads to an intermediate state that has increased β-sheet and reduced α-helix content relative to the native state. Urea-induced unfolding at 25°C reveals a two-step process. The first transition centered near 3 M urea leads to a plateau from 3.5 to 5.0 M urea, followed by a second transition centered near 6.5 M urea. The CD spectrum of the enzyme in the plateau region, which is similar to that of the enzyme thermally unfolded in the absence of urea, shows little temperature dependence from 15° to 60°C. The second transition leads to a mixture of poly(Pro)II and unordered conformations. As the temperature increases, the ellipticity at 222 nm becomes more negative because of conversion of poly(Pro)II to the unordered conformation. Near-ultraviolet CD spectra at 25°C at varying concentrations of urea are consistent with this picture. Both thermal and urea denaturation are irreversible, presumably because of processes that follow unfolding.
Keywords: Domain organization, denaturation, intermediate state, residual structure
T7 RNA polymease is a large monomeric enzyme that exhibits multifunctional activity similar to multisubunit polymerases (Davanloo et al. 1984). This suggests that the single-subunit enzyme may have more or less independent structural domains that are related to different functions. The crystal structures of T7RNAP alone (Sousa et al. 1993), in complex with T7 lysozyme (Jeruzalmi and Steitz 1998), and in complex with a 17-bp promoter (Cheetham et al. 1999) determined at 3.3-, 2.8-, and 2.4-Å resolution, respectively, show an N-terminal region unique to T7RNAP and three structural regions that are analogous to those assigned in the Klenow fragment (Ollis et al. 1985) and HIV-1 reverse transcriptase (Kohlstaedt et al. 1992). Facile cleavage of the protein into 20-kD N-terminal and 80-kD C-terminal fragments (Davanloo et al. 1984; Tabor and Richardson 1985) suggests the presence of at least two domains. Previous calorimetric studies (Protasevich et al. 1994) showed that unfolding of T7RNAP proceeds in two stages under the conditions they used, corresponding to disruption of two structural regions in the molecule.
The analysis of the structural energetics of globular proteins shows that there is a correlation between the number of structural domains in small globular proteins and their size (Wetlaufer 1973). A polypeptide chain consisting of 50–200 amino acid residues with average composition of aromatic and aliphatic residues usually forms one structural domain. As the length of the polypeptide chain increases, it becomes energetically unfavorable to form one large domain. Thus, globular proteins with molecular weights over 30 kD tend to form multidomain structures with different degrees of interdomain interactions. In some cases, the interactions between domains can be so strong that the domains are able to form a single cooperative unit that unfolds under denaturing conditions as one cooperative block (Mateo and Privalov 1981; Griko et al. 1989). The observed correlation between the size of the protein and its domain organization suggests that the structure of T7RNAP, which has a relative molecular mass of 99 kD, is almost certain to be organized into two or more domains.
In this article, studies of the thermal and urea-induced unfolding of T7RNAP are presented and the results are discussed with regard to the structural organization and stability of T7RNAP.
Results and Discussion
Temperature-induced unfolding of T7RNAP
Calorimetric measurements of T7RNAP in the pH range 4.5–9.5 reveal cooperative structural changes in the enzyme that are accompanied by an extensive heat absorption and an increase in the heat capacity of the enzyme. The heat capacity of the native polymerase at 25°C is 0.46 cal K−1 g−1, which is larger than the value obtained for many compact globular proteins, ∼0.32 cal K−1 g−1 (Privalov 1979). The deviation of the heat capacity value from that for compact globular proteins may indicate the presence of flexible or partially disordered structural regions within T7RNAP, with increased accessibility of nonpolar groups to solvent.
Figure 1 ▶ presents the deconvolution of the excess heat-capacity function of T7RNAP in buffers of pH 4.5, 5.1, 9.0, and 9.5. The enzyme unfolds in three simple two-state transitions, as if it consists of three quasi-independent structural domains that differ in stability. The values of the calorimetric enthalpies for the denaturation of T7RNAP derived from the heat-absorption peak areas at different pH values, as well as the thermodynamic parameters of the individual transitions obtained from the deconvolution analysis, are given in Table 1. The positive enthalpy change observed on thermal denaturation indicates that the structure of each cooperative domain is stabilized by a well-developed network of van der Waals interactions and hydrogen bonds. The average enthalpy of stabilization of T7RNAP calculated per gram of protein is ∼2 cal g−1 at 50°C. This is smaller than the enthalpy of stabilization of different proteins with compact globular structure, which is between 4 and 5 cal g−1 at this temperature (Privalov 1979). The observed deficit of the enthalpy makes this protein similar to those that exhibit flexible tertiary structure. This observation, together with the high partial heat-capacity value of T7RNAP at 25°C, suggests that the protein exhibits flexibility in its native state.
Fig. 1.
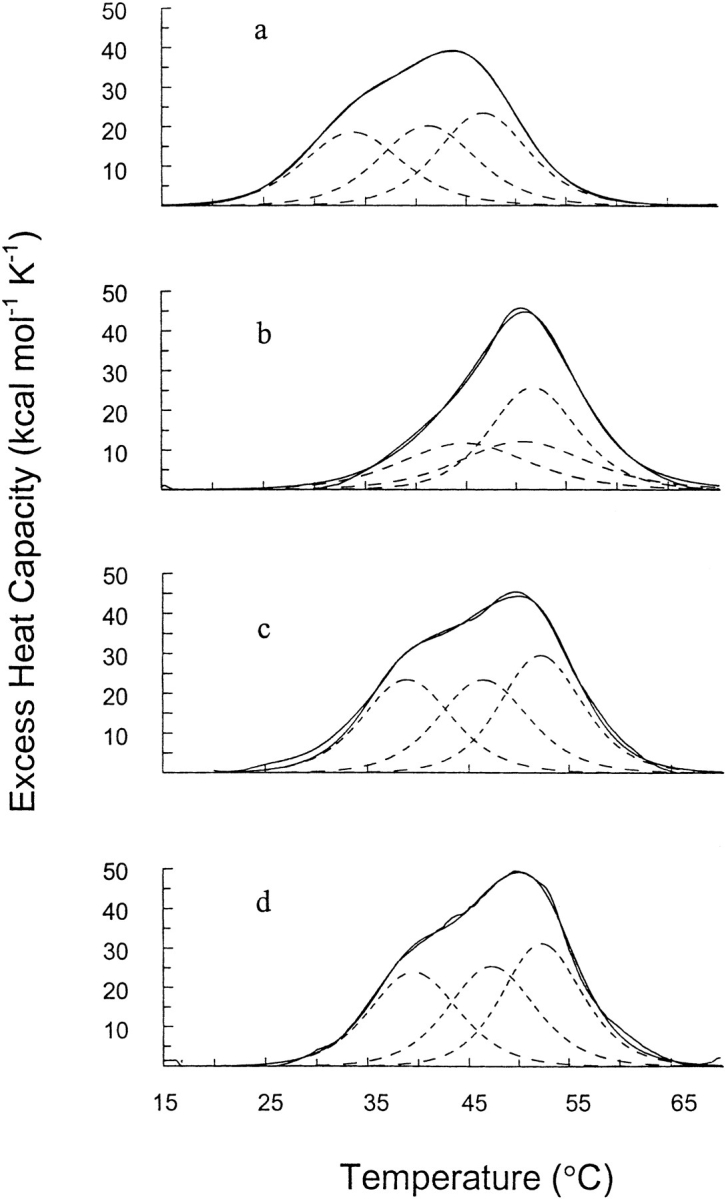
Temperature dependence of the excess heat capacity of T7RNAP in NaCl-free buffers: 20 mM Na-Ac, (a) pH 4.5 and (b) pH 5.1; 20 mM Gly-NaOH, (c) pH 9.0 and (d) pH 9.5. The deconvolution of the excess heat-capacity function is shown in dashed lines. The two solid lines correspond to the experimental curve and the sum of three components from deconvolution analysis. These two lines are not differentiated because the difference between them is so minor.
Table 1.
Thermodynamic parameters associated with the thermal denaturation of T7RNAP under different conditions of pH as determined by deconvolution analysis of the calorimetric curves a
| pH | Total | Individual transitions | |
| 4.5 | ΔH = 185.6 | T1 = 33.9 | ΔH1 = 57.6 |
| Tm = 43.6 | T2 = 41.3 | ΔH2 = 65.6 | |
| T3 = 46.8 | ΔH3 = 67.5 | ||
| 5.1 | ΔH = 157.6 | T1 = 45.0 | ΔH1 = 46.7 |
| Tm = 50.5 | T2 = 50 | ΔH2 = 49.2 | |
| T3 = 51.8 | ΔH3 = 71.8 | ||
| 9.0 | ΔH = 213.4 | T1 = 39.0 | ΔH1 = 65.7 |
| Tm = 49.7 | T2 = 46.6 | ΔH2 = 67.3 | |
| T3 = 52.3 | ΔH3 = 77.0 | ||
| 9.5 | ΔH = 157.6 | T1 = 39.6 | ΔH1 = 66.6 |
| Tm = 49.6 | T2 = 47.4 | ΔH2 = 70.3 | |
| T3 = 52.4 | ΔH3 = 79.2 | ||
a ΔH is in kcal mol−1; Tm is in °C.
T7RNAP may be an example of the induced-fit model for DNA site-recognition advanced by Spolar and Record (1994) in which unordered or poorly ordered regions of the protein become ordered on binding to DNA. Consistent with this, the N-terminal region (residues 1–360) of the free enzyme was absent in the 3.3-Å electron density map (Sousa et al. 1993), whereas this region is generally well defined in the structures of a complex with promoter DNA (Cheetham et al. 1999) and with T7 lysozyme (Jeruzalmi and Steitz 1998).
We have performed some preliminary experiments on thermal unfolding of T7RNAP alone and on T7RNAP complexed with a 22-bp oligonucleotide containing the T7 promoter, in 20-mM Na-P, pH 7.8. The unfolding was monitored by circular dichroism (CD) at 222 nm. The presence of the oligonucleotide stabilizes the enzyme as manifested in the increased negative ellipticity (7%–10%), and the increase in transition temperature from 42° to 45°C (data not shown). More extensive studies on the interaction of the enzyme with DNA will be a logical extension of this work.
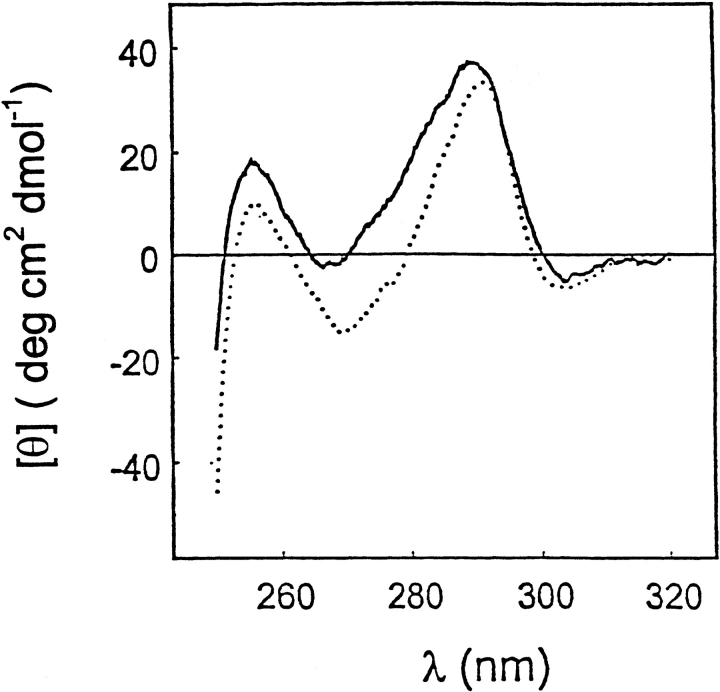
To relate the functional activity of the enzyme to its thermal stability, the thermal unfolding of T7RNAP monitored by calorimetry (Fig. 1 ▶) was compared with the enzyme activity at 37°C over a wide range of pH (Fig. 7 ▶ in Osumi-Davis et al. 1994). The pH profile of enzyme activity shows that at pH 9.0 and 9.5, there is substantial enzymatic activity, thus ensuring that the enzyme is active under the pH conditions used in the calorimetric study. The disappearance of enzymatic activity on decreasing the pH to 6.0 is probably not because of denaturation but results from the titration of the terminal substrate phosphoryl group of the nucleoside triphosphate, which has a pKa of ∼7. This conclusion has been supported by the near-ultraviolet (uv) CD spectra of the polymerase at pH 7.8 and 5.0 (Fig. 2 ▶). Comparison of the T7RNAP spectra at these two pH values shows that there is no major change in tertiary structure of the enzyme between these two pH values.
Fig. 7.
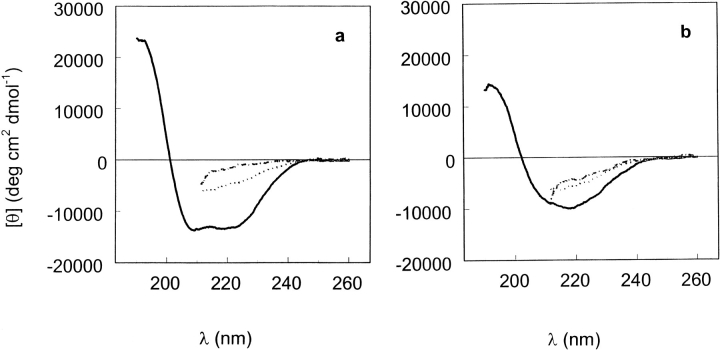
Far-ultraviolet circular dichroism spectra of T7RNA polymerase in 20 mM Na-P (pH 7.8) buffer, at 0.0 (solid line), 4.0 (dotted line), and 6.5 M (dash/dot line) urea concentrations. (a) 20°C; (b) 50°C.
Fig. 2.
Circular dichroism spectra of T7RNAP in the near-uv region in 20 mM Na-Ac (pH 5.0; dotted line) and 20 mM Na-P (pH 7.8; solid line) buffers at 2°C.
The excess heat capacity profiles (Fig. 1 ▶) show that at pH 9.0 and 9.5, the first domain is partially unfolded at 37°C, and the activity-pH profile (Fig. 7 ▶ in Osumi-Davis et al. 1994) indicates that the enzyme retains 80% and 40% of the maximum activity, respectively, at these two pH values. The enzymatic activity depends not only on the integrity of the enzyme but also on the functional groups and substrate groups and their state of ionization. In addition, assays of T7RNAP activity require the presence of a DNA template. It is likely that the enzyme is stabilized by binding a template, as discussed earlier, and forming an elongation complex, thus accounting for significant activity under conditions that lead to partial unfolding in the free enzyme. It would be very desirable to be able to assign which region of the enzyme undergoes unfolding first and which last, but it is difficult to make such an assignment with our currently available data.
How is the calorimetric evidence for three domains obtained in this study to be reconciled with the conclusion of Protasevich et al. (1994), which was also based on calorimetry, that T7RNAP consists of two domains? Visual observations and absorbences at 350 nm of samples under the solvent conditions used by Protasevich et al. show that they become turbid above 49°C. Such turbidity, indicative of strong aggregation or even precipitation, renders calorimetric data of questionable value. By contrast, under the conditions used in our study, samples always remained optically clear.
Figure 3 ▶ summarizes thermal unfolding of T7RNAP monitored by CD and fluorescence. At pH 5.0 and 9.5, the denatured T7RNAP is not completely unfolded even at 70°C, as judged from its CD at 222 nm (Fig. 3a ▶). At temperatures in the 50°–60°C range, where the protein can be classified as denatured, it exhibits ∼50% of the far-uv ellipticity of the native T7RNAP. It is not clear whether all domains are partially unfolded to give 50% far-uv ellipticity at 60°C or whether each domain unfolds to completion at different temperatures as temperature increases. The ellipticity at 290 nm, which reflects the environment of aromatic groups, decreases to nearly 0 on thermal unfolding, which is complete by ∼50°C (Fig. 3b ▶). Figure 3c ▶ shows a decrease in the intensity of tryptophan fluorescence as a function of temperature at various pH values. The decrease of the near-uv CD and the fluorescence signals indicates that T7RNAP undergoes a major loss of tertiary structure on thermal unfolding under all experimental conditions studied.
Fig. 3.
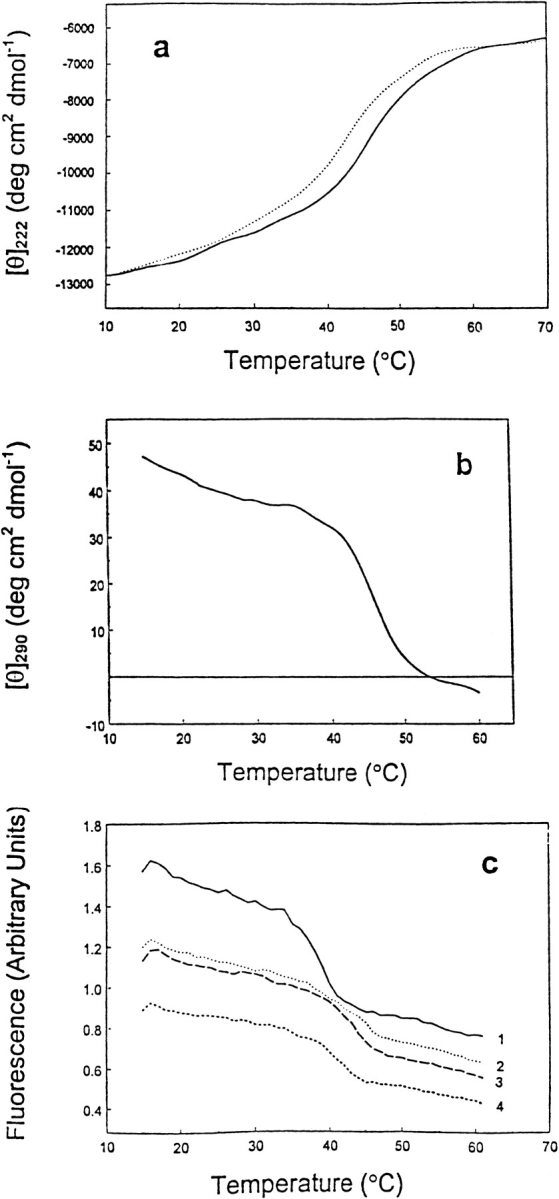
(a) Thermally induced changes in the ellipticity of T7RNAP at 222 nm in 20 mM Na-Ac (pH 5.0; solid line) and 20 mM Gly-NaOH (pH 9.5; dotted line) buffers. (b) Temperature-induced ellipticity changes at 290 nm in 20 mM Gly-NaOH, pH 9.5 buffer. (c) The thermal unfolding profiles of T7RNAP monitored by Trp fluorescence (λex: 290 nm; λem: 340 nm) at various pH values. 20 mM Na-Ac (pH 5.0), 20 mM Na-P (pH 7.8), 20 mM Gly-NaOH (pH 9.0), and 20 mM Gly-NaOH (pH 9.5) buffers. The fluorescence spectra are displaced vertically to facilitate viewing.
As CD and fluorescence reflect the denaturation of all three structural domains of T7RNAP, which differ in thermal stability, the disagreement in the midpoint of the transition monitored by different physical techniques (Fig. 3 ▶) might be because of the fact that the three structural domains of T7RNAP differ in secondary structure: Trp and Tyr composition, van der Waals interactions, and hydrogen bonding. Therefore, the thermal unfolding measured by these three probes (far-uv, near-uv, and fluorescence [Fig. 3 ▶]) cannot be described in terms of two-state models, which are applied only to the deconvolution of individual domains in calorimetric studies.
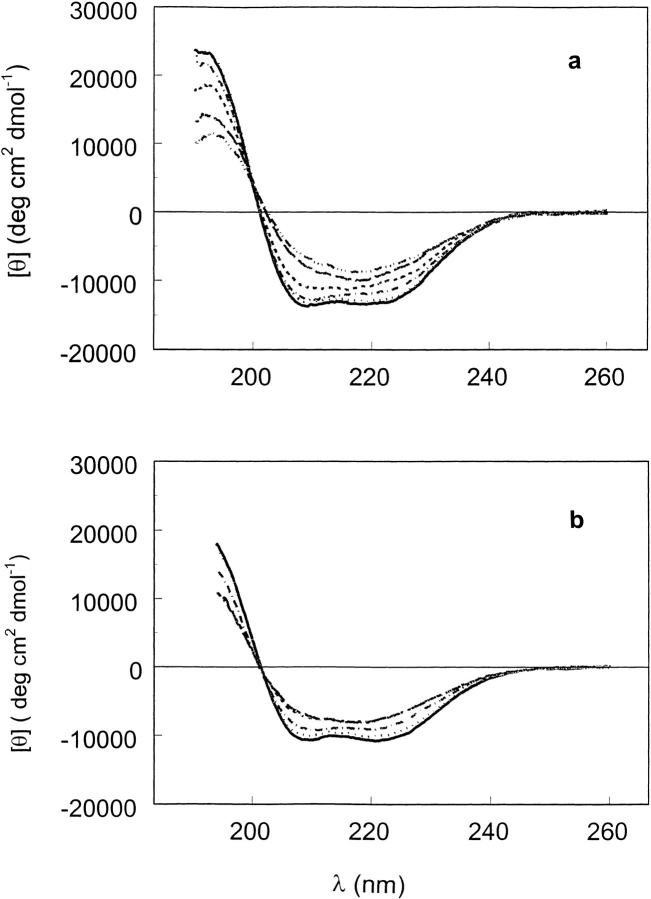
Figure 4 ▶ shows the far-uv CD spectra of T7RNAP at pH 7.8 and 9.0 at various temperatures from 15° to 60 °C. Both Fig. 4a and 4b ▶ show changes in CD spectra with a sharp isoelliptic point on thermal denaturation. The CD spectra at 60°C indicate considerable residual structure in the denatured state. These results are consistent with the inferences drawn in the previous paragraph.
Fig. 4.
Temperature-dependent far-ultraviolet circular dichroism spectra at (a) pH 7.8, 20 mM Na-P and (b) pH 9.0, 20 mM Gly-NaOH. (a) Temperatures (°C): 15 (solid line), 25 (dotted line), 37 (dash/dot line), 42 (bold dashed line), 50 (thin dashed line), 60 (dash/triple dot line). (b) Temperatures (°C): 15 (solid line), 25 (dotted line), 42 (dash/dot line), 50 (bold dashed line), 60 (thin dashed line).
Urea-induced unfolding of T7RNAP
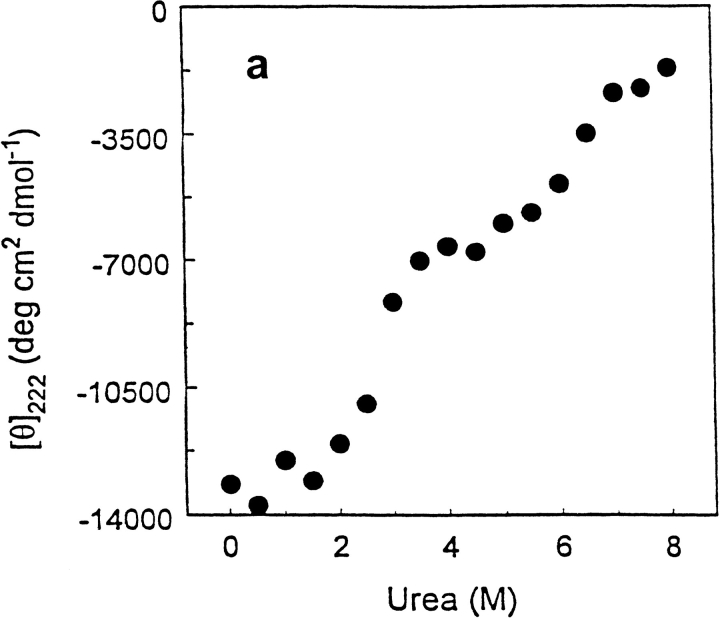
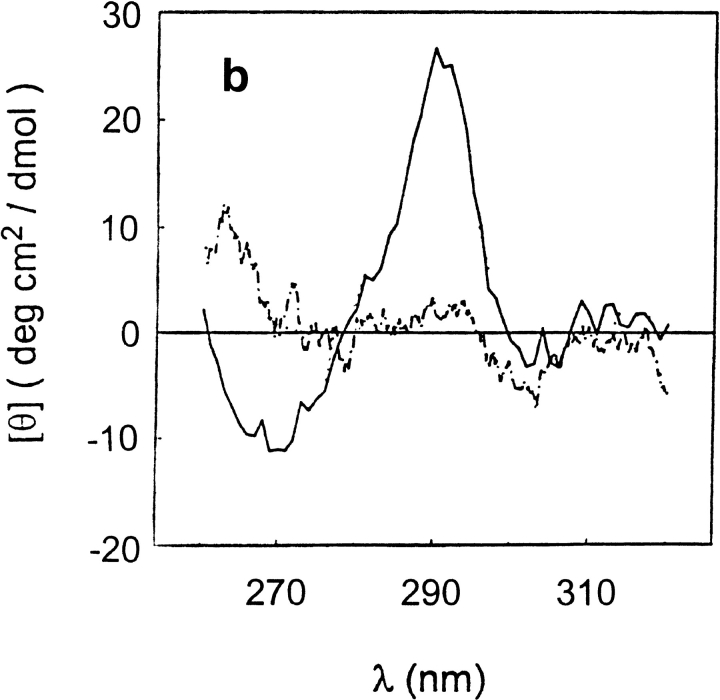
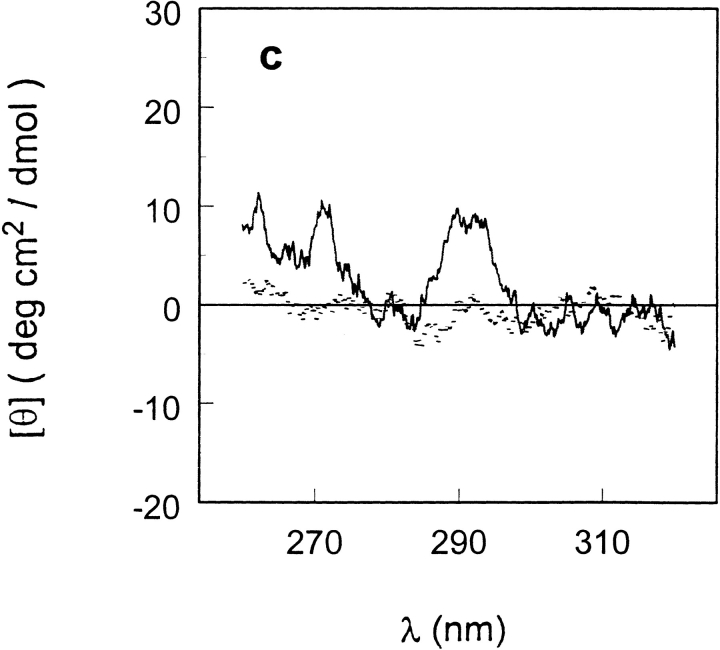
Urea-induced unfolding (Fig. 5a ▶) was monitored by changes of the ellipticity at 222 nm at 25°C to complement the information from the thermal unfolding experiments. The changes in the ellipticity of the polymerase clearly proceed in two distinct stages. The first stage takes place in the urea-concentration range of 2.0–5.0 M, while the second stage takes place at concentrations of urea > 6.0 M. The first stage in the changes of T7RNAP ellipticity observed on increasing urea concentration, in addition to the loss of a significant fraction of secondary structure, is associated with the disruption of tertiary structure. This is confirmed by the observation of changes in the ellipticity in the near-uv region at 290 nm that reflect a loss of tertiary structure of the protein (Fig. 5b ▶). A positive band near 290 nm, largely caused by tryptophan, decreases in intensity with increasing urea and is undetectable at 5.0 M urea (Fig. 5b ▶), while the extent of unfolding of secondary structure is ∼50%. After denaturation of T7RNAP by increasing urea concentration to 4 M, the polypeptide chain loses its ability to fold to a unique native conformation but is able to exist in a stable intermediate state. In the second stage, when the intermediate denatured state is treated with higher urea concentrations, the secondary structure is disrupted in another cooperative transition, leading the ellipticity at 222 nm to become less negative at 8.0 M urea (−2000 deg cm2 dmol−1). The ellipticity at 290 nm becomes more positive at 25°C but disappears at 50°C (Fig. 5c ▶).
Fig. 5.
Urea unfolding of the wild-type T7RNAP at 25°C (a) in 20 mM Na-P (pH 7.8) monitored by the ellipticity at 222 nm; similar observation was made in 20 mM Na-P (pH 7.2) containing 100 mM NaCl (data not shown). (b) in 20 mM Na-P (pH 7.2) buffer containing 100 mM NaCl and 0.0 (solid line), 3.5 (dotted line) and 5.0 M (dash/dot line) urea, determined by near-ultraviolet circular dichroism. (c) as in (b) except that the buffer contained 7 M urea and the spectra were measured at 25°C (solid line), and 50°C (dashed line).
Unfortunately, a full secondary structural analysis is not feasible for the CD data acquired in the presence of urea because the absorption by urea precludes measurements < 210 nm. However, it is possible to estimate the fraction of helix from the ellipticity at 222 nm by the method of Chen et al. (1972). By this method, at 25°C in the absence of urea, T7RNAP contains 36% helix, which agrees with the value of 37% from SELCON3 (Sreerama et al. 1999). At 25°C and 4 M urea, in the middle of the plateau region, the helix content has decreased to 16%.
Temperature-induced unfolding of T7RNAP at various urea concentrations
Thermal unfolding profiles at various urea concentrations (Fig. 6a ▶) were obtained by monitoring the 222-nm ellipticity as a function of temperature. Up to 2.5 M urea, a cooperative thermal transition is observed with a transition temperature that decreases with increasing urea concentration. The product of this transition retains a significant amount of secondary structure, similar to the plateau form in the isothermal urea unfolding and in the thermal unfolding of the acidic, neutral, and basic solutions. The helical fraction at 2.5 M urea and 50°C is estimated to be 20% from the 222-nm ellipticity. From 3 to 4 M urea, the extent of unfolding continues to increase with urea concentration and is nearly independent of temperature over the range studied. At urea concentrations of 5 M and higher, the 222-nm ellipticity becomes more negative as the temperature increases. At 8 M urea, the 222-nm ellipticity at 10°C is approximately −600 deg cm2 dmol−1 and shows a linear temperature dependence over most of the range studied; a short extrapolation leads to positive ellipticities at temperatures of 0°C and lower. The latter two features indicate that the unfolded protein has a significant amount of the left-handed three-fold poly(Pro)II conformation (PII; Tiffany and Krimm 1973; Privalov et al. 1989; Woody 1992). Thus, the second stage of urea-induced unfolding leads to a mixture of the PII conformation that is stabilized by low temperature and high urea concentration (Tiffany and Krimm 1973) and the truly unordered conformation. Figure 6b ▶ shows CD spectra highlighting the conversions from predominantly α-helix at 15°C to mainly β-sheet at 50°C to unfolded protein at 8 M urea and 15°C, which is a mixture of PII and unordered conformation. These conversions may reflect processes that are rapid compared to processes that cause irreversible denaturation, such as aggregation or proline isomerism.
Fig. 6.
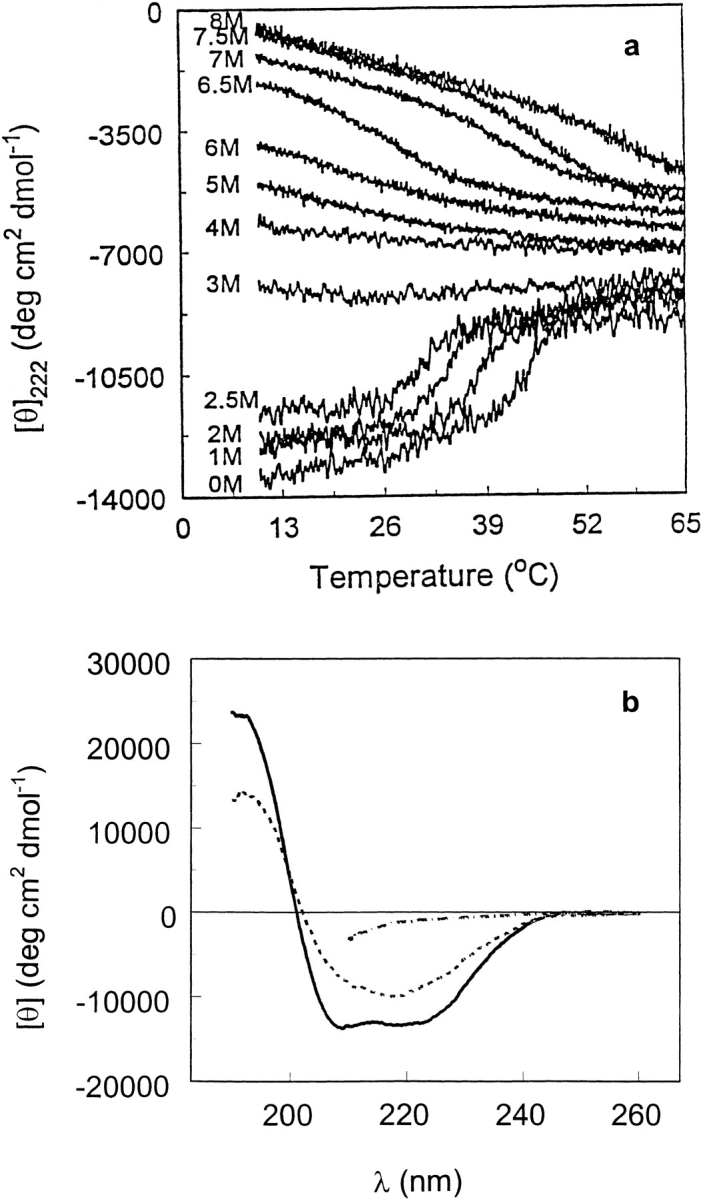
(a) Thermal unfolding of T7RNAP at various urea concentrations in 20 mM Na-P (pH 7.8) buffer. (b) Circular dichroism spectra of T7RNAP in 20 mM Na-P (pH 7.8) at 15°C (solid line), 50°C (dashed line), and sample brought to 50°C and made 8 M in urea concentration at 15°C (dash/dot line).
The effect of the rate of heating on the shape of the melting curve (Privalov 1982) of T7RNAP in 20 mM Na-P buffer (pH 7.8) was tested by CD. Heating rates of 20°C h−1 and 50°C h−1 produced thermal transition curves, the first derivatives of which showed a 1.2° C difference in Tm values and no noticeable difference in the half widths (data not shown). Although the two transitions are not superimposable, their similarity in shape and Tm suggest that the cooperative unfolding process is faster than some secondary processes that might prevent refolding, such as aggregation and proline isomerization, as mentioned above.
Under the solvent conditions studied, the initial state of T7RNAP cannot be recovered after cooling from 60° C or after dilution or dialysis of urea, presumably because of different postdenaturational events. It is likely that these subsequent events in protein denaturation have much lower rates than does the process of cooperative denaturation, and as a result, they do not affect significantly the shape of the calorimetric curve. It has been shown that correct estimates for the number and the size of cooperative units can be obtained even when the system studied is unable to recover its initial native state after cooling (Privalov 1982; Sanchez-Ruiz 1992). This allowed us to apply thermodynamic analysis, with some restrictions, to obtain denaturation parameters of T7RNAP.
Characterization of an intermediate state and disordered conformation of T7RNAP
An intermediate state is observed in the isothermal urea unfolding profile (Fig. 5a ▶) at 25°C, corresponding to the plateau at 3.5–5 M urea with ellipticity at 222 nm of −7000 deg cm2 dmol−1. Intermediate states with similar ellipticity at 222 nm are observed in the thermal-unfolding profile in the absence of urea at neutral pH (Fig. 6a ▶) and at both acidic and basic pH values (Fig. 4a ▶). Both urea- and temperature-unfolded intermediate states have mean residue ellipticities at 222 nm that indicate substantial residual secondary structure. However, as seen from the disappearance of the ellipticity at 290 nm (Fig. 3b ▶) and the reduction in the tryptophan fluorescence (Fig. 4c ▶), the intermediate state(s) exhibits greater conformational mobility of the aromatic side chains, suggesting the absence of tertiary interactions. These intermediate states unfold further with increasing urea concentration (7–8 M) at lower temperatures (10°–25°C; (Figs. 5a,6 ▶ ▶), leading to a mixture of PII and unordered conformation. The ellipticity at 290 nm becomes more positive at 25°C, which is attributable to Trp residues in PII regions, but disappears at 50°C ( Fig. 5c ▶; see further discussion below). Unordered conformation is defined as a polypeptide chain (or region thereof) that has a broad distribution of Ramachandran angles and has no significant regions in which succesive residues have similar Ramachandran angles that could lead to segments of α-helix, β-strands, or PII helix.
To probe the nature of the conformations that would give rise to these ellipticity values, we have measured the far-uv CD spectra of T7RNAP at 0.0, 4.0, and 6.5 M urea and temperatures from 20° to 60°C. The results at 20° and 50°C are shown in Figure 7a and 7b ▶, respectively. In the absence of urea at 20°C (Fig. 7a ▶), the spectrum is dominated by α-helix contributions, but at 50°C (Fig. 7b ▶), the spectrum indicates more β-sheet. The secondary structure analysis of the CD spectra indicated that as the temperature increases from 20° to 60°C, the β-sheet content increases from 15% to 26%, whereas the α-helix content is reduced from 37% to 21%. In the presence of 4 M urea at pH 7.8, the spectra show an admixture of α-helix, β-sheet, and perhaps other secondary structures (Fig. 7a,b ▶) and are nearly independent of temperature. In the presence of 6.5 M urea, the spectrum at 20°C reflects a contribution of the PII conformation because it becomes more negative at 222 nm as temperature increases (Fig. 6a; Fig. 7a,b ▶ ▶).
The PII conformation is stabilized by high concentrations of urea at lower temperatures (Tiffany and Krimm 1973; Woody 1992), as the urea binds to backbone carbonyl groups (Robinson and Jencks 1965). As the temperature increases, the PII conformation diminishes and other regions of the Ramachandran map become more populated. This accounts for the increase in negative ellipticity at 222 nm in the presence of elevated urea concentrations as the temperature increases (Fig. 6a ▶). Tiffany and Krimm (1973) and Nölting et al. (1997) have observed similar phenomena for ribonuclease A and barstar, respectively. The development of positive ellipticity at 290 nm at elevated urea concentrations of 6–7 M at 25°C (Fig. 5c ▶) can also be attributed to increased PII conformation, which incorporates tryptophans in a more regular environment, giving rise to enhanced ellipticity. A similar observation has been reported for hen egg white lysozyme (Tiffany and Krimm 1973).
The intermediate state of T7RNAP exhibits features of a compact denatured state with no tertiary interactions but with a substantial amount of residual secondary structure that can be further unfolded with increasing urea concentrations. It is not clear whether this intermediate state in the polymerase is associated with a partially denatured structure in which some of the domains in the protein remain intact (Griko et al. 1994) or whether it represents a compact denatured state similar to the molten globule intermediate state found as folding and unfolding intermediates in many globular proteins (Kuwajima 1989; Ptitsyn 1992).
The intermediate state observed for T7RNAP is novel in that even at 60°C and up to 4–5 M urea, the extent of organized secondary structure is ∼50% of the native value. Thus, part of the structure exhibits rather low stability, unfolding to a significant extent even at physiological temperatures and at relatively low urea concentration, whereas a substantial portion is unusually resistant to thermal and chemical denaturation. Because of this difference in the stability of differing regions of this molecule, the partially unfolded molecule can be observed under an unusually wide range of temperature and urea concentration. An earlier observation that may correlate with this difference is that T7RNAP seems to have a core that is very resistant to enzymatic and chemical digestion at 25°–37°C (Knoll et al. 1992). Whether this intermediate state has relevance to the function of T7RNAP is not clear, but it may play a role in structural integrity. The fact that 8 M urea is required to disrupt the intermediate state suggests a strong hydrophobic core.
Materials and methods
T7RNA polymerase was purified according to the published procedure (Grodberg and Dunn 1988) from Escherichia coli strain BL21 containing plasmid pAR1219, kindly supplied by William Studier (Biology Department, Brookhaven National Laboratory, Upton, NY). Enzyme activity was determined by the DE81 filter-binding method (Reisbig et al. 1979), as described previously (Osumi-Davis et al. 1992). Enzyme specific activity was 5.0 × 10⁵ units, where a unit of specific activity is defined as 1 nmole of UMP incorporated per mg enzyme per hour at 37°C under our assay conditions. The purity of the enzyme was evaluated using SDS–PAGE, and our enzyme was >95% pure. Protein samples for calorimetric measurements were prepared from a stock solution of T7RNAP in 20-mM Na-P buffer (pH 7.8) containing 100 mM NaCl, 1 mM EDTA, and 50% glycerol by extensive dialysis against the buffer to be used for experiments. Protein solutions for CD and fluorescence measurements were prepared by direct dilution into the desired buffer. Buffers were filtered for optical clarity. Glycerol content in the final solution was 0.2%–1.4%, and this amount of glycerol in the buffer had negligible effect on the enzyme activity. Protein solutions were centrifuged before measurements to remove any insoluble material. The protein concentration was determined spectrophotometrically, using the extinction coefficient ɛ280 = 1.4 × 10⁵ M−1 cm−1 (King et al. 1986), with an estimated error of 5%. The urea concentration was determined from the refractive index as M = 117.66(Δn) + 29.753(Δn)2 + 0.00308(Δn)3, where Δn = nurea−nH2O (Warren and Gordon 1966).
Calorimetric measurements were performed using a DSC calorimeter built at Johns Hopkins University as a prototype of the Nano-DSC produced by Calorimetry Sciences Corporation. The protein concentration varied from 4.0 to 6.0 μM, and the protein solutions were clear under our experimental conditions. The heating rate was 1°C min−1 under an excess pressure of 2.5 atm. The partial specific heat capacity of the protein was determined as described elsewhere (Privalov and Potekhin 1986), assuming that the relative molecular mass of T7RNAP is 99 kD. The partial specific volume of the protein was calculated to be 0.741 cm3 g−1 from the amino acid composition (Makhatadze and Privalov 1991). Thermodynamic analysis of the excess heat-capacity function obtained in the calorimetric experiments was performed using a two-state model with a temperature-dependent denaturation heat-capacity increment ΔCp(T). The thermodynamic parameters of heat denaturation of T7RNAP were obtained using the best fit of the integrated heat capacity and the experimental heat capacity function on denaturation. The deconvolution analysis of the excess-heat absorption was performed using software provided by G. Privalov for Nano-DSC, based on statistical thermodynamic analyses of the heat-capacity function initially described by Freire and Biltonen (1978).
The most important factor is the adjusted coefficient of multiple determination, which was 99.7% in the case of the three-stage denaturation. For the deconvolution into two stages, the adjusted coefficient was <80%, and the program rejected the analysis.
CD measurements of T7RNAP under different solvent conditions were performed using a JASCO 710 spectropolarimeter equipped with a Peltier temperature control accessory PTC348 or a JASCO 720 spectropolarimeter equipped with a Neslab water bath. Most of the CD spectra and temperature scans of the molar ellipticity were recorded using an optical cell with a 0.05-cm pathlength for the far-uv region and a 1-cm pathlength in the near-uv region. Averages of 20 scans were collected. Protein concentrations of 0.5–1.4 μM were used for far-uv CD. For near-uv CD, 1.0–1.4 μM were also used to assure optical clarity, and therefore, the signal-to-noise level is somewhat low. Under our experimental conditions, the protein solutions were clear. The temperature scans were performed at a rate of 50° or 60°C h−1. The mean residue ellipticity of the protein was calculated using molar concentration multiplied by the number of residues. The secondary structural analysis was performed using the program SELCON3 (Sreerama et al. 1999). In the presence of urea, Equation (2c) ([θ]222 = −30,000 fH−2340) of Chen et al. (1972) was used to calculate the fraction of helix from 222-nm ellipticity. The 222-nm ellipticity of the helix was assumed to be that used by Chen et al. independent of temperature and urea concentration. The value for the unfolded form was assumed to vary with these parameters. For a given urea concentration, it was estimated by linear interpolation between the value observed in 8 M urea at a given temperature and the Chen et al. (1972) value for 0 M urea, taken to be temperature independent.
Fluorescence measurements were performed using an AVIV spectrofluorometer ATF 105 equipped with thermoelectric temperature control. The protein concentration was 0.2 μM, and the pathlength of the cell was 0.3 cm. The intensity of tryptophan fluorescence was measured at 340 nm, with excitation at 290 nm.
Acknowledgments
We gratefully acknowledge financial support by NIH grant GM23697 (A.-Y.M.W. and R.W.W.).
The publication costs of this article were defrayed in part by payment of page charges. This article must therefore be hereby marked "advertisement" in accordance with 18 USC section 1734 solely to indicate this fact.
Abbreviations
T7RNAP, T7 RNA polymerase
Na-P, sodium phosphate
NaAc, sodium acetate
K-P, potassium phosphate
Article and publication are at www.proteinscience.org/cgi/doi/10.1110/
References
- Cheetham, G.M.T., Jeruzalmi, D., and Steitz, T.A. 1999. Structural basis for initiation of transcription from an RNA polymerase-promoter complex. Nature 399 80–83. [DOI] [PubMed] [Google Scholar]
- Chen, Y.H., Yang, J.T., and Martinez, H.M. 1972. Determination of the secondary secondary sturctures of proteins by circular dichroism and optical rotatory dispersion. Biochemistry 11 4120–4131. [DOI] [PubMed] [Google Scholar]
- Davanloo, P., Rosenberg, A.H., Dunn, J.J., and Studier, F.W. 1984. Cloning and expression of the gene for bacteriophage T7 RNA polymerase. Proc. Natl. Acad. Sci. 81 2035–2039. [DOI] [PMC free article] [PubMed] [Google Scholar]
- Freire, E. and Biltonen, R.L. 1978. Statistical mechanical deconvolution of thermal transitions in macromolecules. I. Theory and application to homogeneous system. Biopolymers 17 463–479. [Google Scholar]
- Griko, Yu.V., Venyaminov, S.Yu., and Privalov, P.L. 1989. Heat and cold denaturation of phosphoglycerate kinase (interaction of domains). FEBS Lett. 2 : 276–278. [DOI] [PubMed] [Google Scholar]
- Griko, Yu.V., Gittis, A., Lattman, E.E., and Privalov, P.L. 1994. Residual structure in a staphylococcal nuclease fragment: Is it a molten globule and is its unfolding a first-order phase transition? J. Mol. Biol. 243 93–99. [DOI] [PubMed] [Google Scholar]
- Grodberg, G. and Dunn, J.J. 1988. ompT encodes the Escerichia coli outer membrane protease that cleaves T7 RNA polymerase during purification. J. Bacteriol. 170 1245–1253. [DOI] [PMC free article] [PubMed] [Google Scholar]
- Jeruzalmi, D. and Steitz, T.A. 1998. Structure of T7 RNA polymerase complexed to the transcriptional inhibitor T7 lysozyme. EMBO J. 17 4101–4113. [DOI] [PMC free article] [PubMed] [Google Scholar]
- King, G.C., Martin, C.T., Pham, T.T., and Coleman J.E. 1986. Transcription by T7 RNA polymerase is not zinc-dependent and is abolished on amidomethylation of cysteine-347. Biochemistry 25 36–40. [DOI] [PubMed] [Google Scholar]
- Knoll, D.A., Woody, R.W., and Woody, A.-Y.M. 1992. Mapping of the active site of T7 RNA polymerase with 8-azidoATP. Biochim. Biophys. Acta 1121 252–260. [DOI] [PubMed] [Google Scholar]
- Kohlstaedt, L.A., Wang, J., Friedman, J.M., Rice, P.A., and Steitz, T.A. 1992. Crystal structure at 3.5 Å resolution of HIV-1 reverse transcriptase complexed with an inhibitor. Science 256 1783–1790. [DOI] [PubMed] [Google Scholar]
- Kuwajima, K. 1989. The molten globule state as a clue for understanding the folding and cooperativity of globular protein structure. Proteins 6 87–103. [DOI] [PubMed] [Google Scholar]
- Makhatadze, G.I. and Privalov, P.L. 1991. Partial molar volumes of polypeptides and their constituent groups in aqueous solution over a broad temperature range. Biopolymers 30 1001–1010. [DOI] [PubMed] [Google Scholar]
- Mateo, P.L. and Privalov, P.L. 1981. Pepsinogen denaturation is not two-state transition. FEBS Lett. 123 189–192. [DOI] [PubMed] [Google Scholar]
- Nölting, B., Gobik, R., Soler-González, A.S., and Fersht, A.R. 1997. Circular dichroism of denatured barstar suggests residual structure. Biochemistry 36 9899–9905. [DOI] [PubMed] [Google Scholar]
- Ollis, D.L., Brick, H., Hamlin, R., Xuong, N.G., and Steitz, T.A. 1985. Structure of large fragment of Escherichia coli DNA polymerase I complexed with dTMP. Nature 313 762–766. [DOI] [PubMed] [Google Scholar]
- Osumi-Davis, P.A., de Aguilera, M.C., Woody, R.W., and Woody, A.-Y.M. 1992. Asp537, Asp812 are essential and Lys631, H811 are catalytically significant in bacteriophage T7 RNA polymerase activity. J. Mol. Biol. 226 37–45. [DOI] [PubMed] [Google Scholar]
- Osumi-Davis, P.A., Sreerama, N., Volkin, D.B., Middaugh, C.R., Woody, R.W., and Woody, A-Y.M. 1994. Bacteriophage T7 RNA polymerase and its active-site mutants. Kinetic, spectroscopic and calorimetric characterizations. J. Mol. Biol. 2375–19. [DOI] [PubMed] [Google Scholar]
- Privalov, P.L. 1979. Stability of proteins: Small globular proteins. Advan. Prot. Chem. 33 167–241. [DOI] [PubMed] [Google Scholar]
- ———. 1982. Stability of proteins: Proteins which do not represent a single cooperative system. Adv. Prot. Chem. 35 1–104. [PubMed] [Google Scholar]
- Privalov, P.L. and Potekhin, S.A. 1986. Scanning microcalorimetry in studying temperature-induced changes in proteins. Meth. Enzymol. 131 4–51. [DOI] [PubMed] [Google Scholar]
- Privalov, P.L., Tiktopulo, E.I., Venyaminov, S.Yu., Griko, Yu.V., Makhatadze, G.I., and Khemchinashvili, N.N. 1989. Heat capacity and conformation of proteins in the denatured state. J. Mol. Biol. 205 737–750. [DOI] [PubMed] [Google Scholar]
- Protasevich, L.V., Memelova, S.N., Kochetkova, S.N., and Makarov, A.A. 1994. The studies of cooperative regions in T7 RNA polymerase. FEBS Lett. 349 429–432. [DOI] [PubMed] [Google Scholar]
- Ptitsyn, O.B. 1992. The molten globule state. In Protein Folding (ed. T.E. Creighton), pp. 243–300. Freeman, New York.
- Reisbig, R.R., Woody, A.-Y.M., and Woody, R.W. 1979. Spectroscopic analysis of the interaction of Escherichia coli DNA–dependent RNA polymerase with T7 DNA and synthetic polynucleotides. J. Biol. Chem. 254 11208–11217. [PubMed] [Google Scholar]
- Robinson, D.R. and Jencks, W.P. 1965. The effect of compounds of the urea-guanidinium class on the activity coefficient of acetyltetraglycine ethyl ester and related compounds. J. Am. Chem. Soc. 87 2462–2470. [DOI] [PubMed] [Google Scholar]
- Sanchez-Ruiz J. 1992. Theoretical analysis of Lumry-Eyring models in differential scanning calorimetry. Biophysical J. 61 921–935 [DOI] [PMC free article] [PubMed] [Google Scholar]
- Sousa, R., Chung, Y.J., Rose, J.P., and Wang, B.C. 1993. Crystal structure of bacteriophage T7 RNA polymerase at 3.3 Å resolution. Nature 364 593–599. [DOI] [PubMed] [Google Scholar]
- Spolar, R.S. and Record, Jr., M.T. 1994. Coupling of local folding to site-specific binding of proteins to DNA. Science 263 777–784. [DOI] [PubMed] [Google Scholar]
- Sreerama, N., Venyaminov, S.Yu., and Woody, R.W. 1999. Estimation of the number of α-helical and β-strand segments in protein using circular dichroism spectroscopy. Protein Sci. 8 370–380. [DOI] [PMC free article] [PubMed] [Google Scholar]
- Tabor, S. and Richardson, C.C. 1985. A bacteriophage T7 RNA polymerase promoter system for controlled expression of specific genes. Proc. Natl. Acad. Sci. 82 1074–1078. [DOI] [PMC free article] [PubMed] [Google Scholar]
- Tiffany, L.M. and Krimm, S. 1973. Extended conformations of polypeptides and proteins in urea and guanidine hydrochloride. Biopolymers 12 575–587. [Google Scholar]
- Warren, J.R. and Gordon, J.A. 1966. On the refractive indices of aqueous solutions of urea. J. Phys. Chem. 70 297–300. [Google Scholar]
- Wetlaufer, D.B. 1973. Nucleation, rapid folding, and globular interaction regions in protein. Proc. Natl. Acad. Sci. 70 697–701. [DOI] [PMC free article] [PubMed] [Google Scholar]
- Woody, R.W. 1992. Circular dichroism and conformation of unordered polypeptides. Adv. Biophys. Chem. 2 37–79. [Google Scholar]


