

Abstract
Although many animal viruses block the interferon (IFN) signaling pathway, this issue has not previously been investigated in retrovirus infected cells. For this purpose, an infectious molecular clone of human T-cell leukemia virus type 1 (HTLV-1) was transfected into 293T or HeLa cells, and found to reduce interferon-stimulated response element (ISRE) reporter activity. This effect was independent of expression of the polymerase or envelope products, and independent of the ability of Tax to activate the NFκB transcriptional pathway. IFN-α-activation of 6 of 7 endogenous ISRE-regulated genes was also variably reduced, but not IFN-γ-activated response element mediated expression of interferon regulatory factor 1. HTLV-1 reduced phosphorylation of tyrosine kinase 2 (TYK2) and signal transducer and transcriptional activator 2 (STAT2), suggesting a specific effect of HTLV-1 on the ability of an adaptor tyrosine kinase to transfer an IFN signal to the STAT-transcriptional activator complex.
Keywords: HTLV, type I Interferon, STAT2, TYK2, Gag
Introduction
Interferons were discovered 50 yrs ago as proteins that inhibit virus replication. Type I interferons (IFN), IFN-α and IFN-β can be produced in a wide range of cell types, whereas type II IFN-γ is largely produced by T lymphocytes, NK, and dendritic cells (reviewed in (Brierley and Fish, 2005; vanBoxel-Dezaire, Rani, and Stark, 2006; Wesoly, Szweykowska-Kulinska, and Bluyssen, 2007)). IFN signaling is initiated by binding to heterodimeric cell surface proteins (Fig 1). This results in activation of Janus kinases, which in the case of type I IFN, include Janus kinase 1 (JAK1) and tyrosine kinase 2 (TYK2). This causes phosphorylation of signal transducer and activator of transcription 1 (STAT1) and STAT2, which complex with interferon regulatory factor 9 (IRF9) to form the interferon stimulated gene factor 3 (ISGF3). ISGF3 then translocates into nucleus, binds, and activates interferon-stimulated response element (ISRE)-containing genes, such as interferon-stimulated gene 15 (ISG-15), myxovirus resistance gene A (MxA), interferon inducible gene 6−16 (GIP3), and the genes for protein kinase R (PKR), guanylate nucleotide-binding protein 1 (GBP1), IFN-α-inducible gene 27 (IFI27), and 2’,5’-oligoadenylate synthetase 1 gene (OAS). Alternatively, through the JAK1/JAK2 pathway, phosphorylated STAT1 homodimers directly activate IFN-γ-activated (GAS) genes, such as IRF1.
Fig 1. Model of effects of HTLV-1 on IFN-α induced signal transduction pathway.

Data in the current manuscript are consistent with normal interaction of IFN-α and IFN-β with the heterodimeric IFN receptor at the cell surface. However, activation of signal transduction appears to be reduced by HTLV Gag, particularly through effects on TYK2 and STAT2 tyrosine phosphorylation. Thus, ISRE-stimulated gene expression through ISGF3, complexes of STAT1 and/or STAT2 proteins with IRF9 are generally reduced, whereas GAF-stimulated gene expression of IRF1 is largely unaffected by HTLV-1.
The mechanism of action of IFN on retroviruses is poorly understood. Okumura et al. showed that IFN-α blocks HIV-1 release mediated by the ubiquitin ligase, ISG15 (Okumura et al., 2006). We have also found that IFN-α blocks release of HTLV-1 particles, by inhibiting Gag targeting to lipid rafts (Feng, VanderHeyden, and Ratner, 2003). Thus, the critical HTLV-1 mediator of IFN-α action appears to be the gag gene product.
Viruses have developed various mechanisms for initiating virus replication in the host by disrupting the actions of IFN or evading IFN-stimulated responses (Sen, 2001; Levy and Garcia-Sastre, 2001; Katze et al, 2002; Garcia-Sostre, 2002). The major strategies include inhibition of IFN production and secretion, competition for binding to IFN receptors, degradation or suppression of JAK-STAT components, and inhibition of the actions of IFN-induced antiviral proteins. The human papilloma virus type 18 E6 oncoprotein physically associates with TYK2 and impairs JAK-STAT activation by IFN-α (Li et al., 1999). Flaviviruses also utilize a number of different mechanisms mediated by non-structural (NS) proteins to elude IFN responses (Samuel and Diamond, 2006). For example, Japanese encephalitis virus blocks IFN-induced JAK-STAT signaling through interaction of protein NS5 with a protein tyrosine phosphatase, resulting in activation of the phosphatase (Lin et al., 2006). Moreover, West nile virus, dengue virus, and tick-borne Langat virus also counteract JAK-STAT signaling by blocking the phosophorylation of JAK1, TYK2, STAT1, and STAT2 (Best et al, 2005; Guo et al, 2006; Ho et al, 2006).
A number of other observations about IFN activity during HTLV infection are also relevant. HTLV-1 infected cells exhibit constitutive activation of the JAK/STAT pathway (Migone et al., 1995). Activation of IFN-γ release by HTLV-1 has been suggested to be important in HTLV-1 associated myelopathy-tropical spastic paraparesis (HAM/TSP) (Furuya et al., 1999). IRF4 levels have been shown to correlate with chemotherapy-resistance of HTLV-1 induced adult T-cell leukemia-lymphoma (ATLL) (Ramos et al., 2007). HTLV-1 infection of plasmacytoid dendritic cells results in impaired IFN-α production, and correlates with elevated HTLV-1 proviral load in infected individuals (Hishizawa et al., 2004). The current work addresses the question as to whether HTLV-1 blocks the IFN signaling pathway, and identifies inhibition of IFN-induced TYK2 and STAT2 activity. Although differences in IFN signaling exist among different cell types, the current work utilized fibroblast cell lines as a model system, using cell lines that are highly infectible by HTLV-1 (Feng, VanderHeyden, and Ratner, 2003; Khabara et al., 2004; Trejo and Ratner, 2000).
Materials & Methods
Cell culture and reagents
293T and HeLa cells were cultured in Dulbecco's minimal essential medium (DMEM) containing 10% fetal clone III (Hyclone, Logan, UT), 2% glutamine, and 100 U/ml penicillin and 100 μg/ml streptomycin. Recombinant human IFN-α-2a was purchased from PBL Biomedical Laboratories. All antibodies were purchased from Santa Cruz Biotechnology, except anti-phoshotyrosine STAT2 (pSTAT2) was from Upstate Cell Signaling Solutions (Lake Placid, NY ).
Luciferase reporter assays
HeLa or 293T cells, 200 μl, 5−6×10⁴ cells/ ml, were seeded into a 96-well plate for 16 hrs, and then transfected with 6.25 ng of pLTR-luc or 125 ng of pISRE-luc, and co-transfected with 125 ng of pACH or backbone pBluescript-KS (Stratagene), or mutant pACH plasmids, pACH-M22, pACH-M47, pACHEnv, or pACH-Pol using TransIt-LT1 (Mirus Corp, Madison WI), according to the manufacturr's complete growth medium protocol (Feng, VanderHeyden, and Ratner, 2003; Kimata et al., 1994; Robek and Ratner, 1999; Tsukahara and Ratner, 2001). After 72 hr, cells were treated with IFN 500−1000 U/ml for 6 hrs, and then lysed for 5−10 min at 20°C with 100 ul of luciferase lysis buffer (Promega, Madison, WI). Cell lysates were measured for luciferase activity according to manufacturer's protocol.
Western blot analysis
pACH or pBluescript-KS was transfected into HeLa cells in a 6−10 cm plate with 2 μg of DNA or into a 10 cm plate with 10 μg DNA for 72 hrs, and then cells were treated with IFN-α for 1 hr. Cells were lysed in RIPA buffer containing protease inhibitor cocktail (50 mM HEPES, pH 7.5, 150 mM NaCl, 1% (v/v) Triton X-100, 10% glycerol, 1.5mM MgCl2, 1mM EDTA, 100mM NaF, 1μg/ml aprotinin, 10μg/ml pepstatin, 10μg/ml leupeptin, 1mM sodium orthovanadate). Cell lysates were sonicated for 10 sec for complete lysis. Cell lysates were quantified using the Bradford assay (Bio-Rad Laboratories, Hercules, CA), and samples were boiled for 5 min. One hundred to one hundred and fifty micrograms of protein were separated on 8−10% SDS-PAGE (8% for JAK1, TYK2, pJAK1, pTYK2) and transferred onto Immobilon P membrane (Millipore Corp, Billerica, MA). Membranes were blocked for 1−2 hr with TBST (25 mM Tris HCl, 137 mM NaCl, 0.05% Tween-20) containing 5% milk for all antibodies except for pJAK1 and pTYK2 antibodies, in which case TBST containing 1% milk and 1% BSA was used. The samples were incubated for 16 hrs at 20°C with primary antibody.. Membranes were washed three times with TBST for 15 min each wash, incubated for 1 hr at 20°C with 1:200−1:4000 dilution of secondary antibodies which were peroxidase-conjugated, followed by three washes with TBST as before, and then developed with SuperSignal West Femto Maximum Sensitivity Substrate (Pierce Biotechnology, Rockford, IL). Protein bands were visualized with a CCD Imaging System (Alpha Innotech, San Leandro, CA).
Real-Time RT-PCR for IFN-induced gene expression and Superarray gene profiles for JAK/STAT pathway
HeLa cells were transfected with pACH or pBluescript for 48 hr, and the treated with 500 U/ml IFN-α for 4 hrs. Total cellular RNAs were isolated with RNeasy mini kit (Qiagen) and further treated with RNase-free DNase (Qiagen). A total of 3 μg of each RNA sample was used of as a template to make cDNA with RT2 profiler first strand kit (C-02, SuperArray, Frederick, MD) for one 96-well PCR array plate. Both individual gene expression and human JAK/STAT signaling pathway RT profiler PCR arrays were performed based on real time PCR using an iCycler (Bio-Rad) with SYBR green PCR master mixes (PA-011) according to manufacturer's protocol. Individual gene expressions were normalized with GAPDH (SuperArray). JAK/STAT pathway gene expressions were measured using PCR assay containing a panel of 84 pre-dispensed gene-specific primers for JAK/STAT pathway (APH-039A), plus five housekeeping genes and three RNA and PCR quality controls. By performing real time PCR, relative expression was determined by normalizing with housekeeping genes, and the fold changes were analyzed by the nated by the ΔΔCt method using the template designated by the manufacturer (SuperArray). Changes of 4-fold or more were found to be statistically significant by t-test (p<.03), based on the reproducibility of the assay reported by the manufacturer.
Results
HTLV-1 Inhibition of Signaling by IFN-α
In order to assess the effects of HTLV-1 on type I IFN signaling, 293T cells were transfected with an infectious HTLV-1 molecular clone, pACH, or control plasmid, pBluescript, together with luciferase reporter plasmids. After 72 hrs, the cells were treated for 6 hrs with 500 U/ml IFN-α or 100 U/ml IFN-β. In control cells, IFN-α and IFN-β activated the IFN-stimulated response element (ISRE) 9.1- and 4.2-fold, respectively (Fig 2, top and middle panels). In contrast, pACH blunted ISRE-luc activity to 35% and 44% of control values in IFN-α and IFN-β treated cells, respectively. IFN-α had no significant effect on the ability of ACH to trans-activate the HTLV LTR promoter (Fig 2, bottom panel).
Fig 2. Inhibitory effects of HTLV-1 on type I IFN signaling in 293T cells.
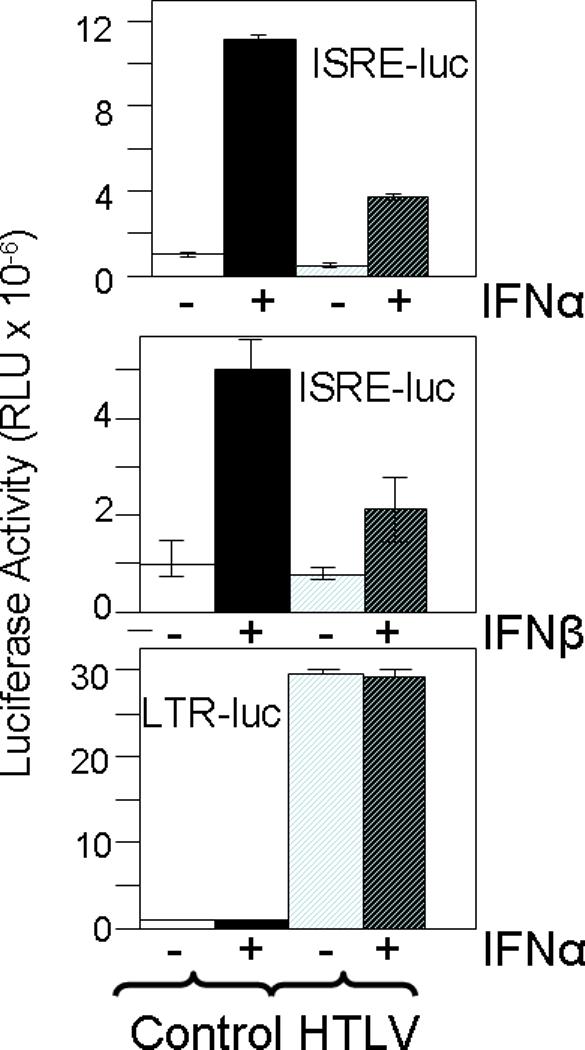
293T cells were transfected with pLTR-luc or pISRE-luc and pACH (HTLV) or pBluescript (Control) for 72 hr, and then treated for 6 hrs with 500 U/ml IFN-α or 100 U/ml IFN-β, or left untreated. Cell lysates were examined by luciferase activity and relative light units (RLU) determined. Means and standard deviations are shown for representative assays. All assays were performed in at least three independent experiments.
We also investigated the effects of HTLV of IFN-α signaling in HeLa line sensitive to the effects of type I interferons (Dave et al, 2006). In these studies, both wild type and mutant forms of pACH were utilized (Fig 3A). Similar results were obtained in IFN-α-treated HeLa cells as described for 293T cells. IFN-α-stimulated ISRE-luc activity was decreased in the presence of pACH to 20% of control (Fig 3B, lanes M vs. 1). Similar results were obtained with a mutant of pACH, pACH-M22, in which the tax gene is mutated to eliminate its ability to trans activate NFκB pathway (pACH-tax-NFκB, Fig 3A and Fig 3B, top panels, lanes M vs. 2) (Robek and Ratner, 1999). In contrast, a mutant of pACH, pACH-M47, in which the tax gene is mutated to decrease CREB-ATF activation 25-fold, did not blunt interferon-stimulated ISRE-luc activity (pACH-tax-CREB, Fig 3A and Fig 3B, lanes M vs. 3) (Robek and Ratner, 1999). It should be noted that the lack of CREB-ATF activation by pACH-M47 also markedly suppresses expression of all HTLV gene products, including Gag, Pr, Pol, and Env (Fig 3A).
Fig 3. Inhibition of IFN-α signaling in HeLa cells by wild type and mutant HTLV-1 molecular clones.

A) Schematics are provided for each of the HTLV-1 molecular clones, including the wild type clones, clones with specific mutations in a mutation in Pol. Proteins expressed at wild type levels are shown with black shadowing, whereas mutant Tax proteins are shown with shading. B) pISRE-luc was co-transfected with each ACH clone, indicated by number referring to A). After 72 hrs, cells were treated with 500 U/ml IFN-α for 6 hrs, of left untreated. Cell lysates were examined by luciferase activity and RLU determined, normalized to that of the mock control. Means and standard deviations are shown for representative assays. All assays were performed in at least three independent experiments. Numbers under bars refer to pACH mutant shown in A, whereas M refers to pBluescript transfected cells.
In order to identify the HTLV gene product responsible for blunting IFN-α-stimulated ISRE-luc activity, two additional mutants of pACH were tested. pACH-env includes an amber mutation at codon 32 of the envelope precursor protein, and fails to express envelope proteins, but exhibits no defect in expression of other HTLV-1 proteins (Fig 3A) (Tsukahara and Ratner, 2001). pACH-env blunted ISRE-luc activity to 47% of that of control IFN-α treated cells (Fig 3B, lane M vs. 4), indicating that env is not responsible for ISRE repression. pACH-pol includes a frameshift mutation in the spacer between Pr and Pol, and fails to express Gag-Pr-Pol precursor protein, although there is no defect in expression of the Gag precursor, Env, Tax, or Rex (Fig 3A) (Heidecker et al., 2002). pACH-Pol repressed IFN-α-induced ISRE-luc activity comparable to that of wild type pACH (Fig 3B, lane M vs. 5), indicating that pol is not responsible for ISRE suppression. Therefore, Gag or Pr is likely responsible for HTLV-1 suppression of ISRE activity.
IFN Signaling Pathway Target of HTLV-1 Inhibition
The IFN-α signaling pathway was further dissected by examining the effects of HTLV-1 on endogenous IFN-α pathway gene expression profiles. For this purpose, real time RT-PCR was performed to assess expression of genes involved in the IFN-α signaling pathway, and constitutively expressed genes not affected by IFN-α. Genes with an ISRE were examined, including OAS, GBP1, and ISG15 (Fig 4). IFN-α-induced OAS and GBP1 gene expression were reduced to 16% and 28%, respectively (p<.02 by t-test), whereas IFN-α-induced ISG15 gene expression was increased 2.2-fold by HTLV expression, although not statistically significant (p<.09). HTLV-1 also had no significant effect on IFN-α-stimulation of IRF1 (p=.73), which is primarily induced by IFN-γ-activated sequence (GAS). This suggests that IFN-α receptor expression is not altered by HTLV-1. Several additional ISRE regulated genes were also examined by real time PCR, including IFI27, G1P3, MxA, and PKR (Fig 4). In these cases, gene expression was blunted by HTLV-1 to 33% (p<.01), 61% (p<.01), 42% (p=.057), and 86% of control values (p<.02), respectively.
Fig 4. HTLV-1 Inhibition of IFN-α stimulated gene expression.

pACH-transfected HeLa cells were cultured for 72 hrs, and then 500 U/ml IFN-α added for 4 hrs, or left untreated. Total cellular RNA was isolated subjected to quantitative real time RT-PCR using primers for each of the indicated genes. Means and standard deviations are shown for triplicate measurements performed with primers for IFI27, GIP3, MxA, and PKR, although standard deviations for the latter two genes were too low to be visualized on the graph. Results are shown as the proportional increase over that present in control HeLa cells not treated with IFN. Results from PCR Superarray profiles for OAS, GBP1, ISG15, and IRF1 are also graphed.
A number of other genes, whose products regulate IFN-α signaling were also evaluated by real time RT-PCR (Table 1). These included JAK-STAT proteins, receptors that bind active JAK proteins, SH3/SH2 adaptor proteins, STAT-inducible genes, and inhibitors of the JAK/STAT pathway. Several of these genes were activated by IFN-α more than 4-fold, including STAT1, STAT2, IL-10 receptor-α (IL10RA), and the suppressor of cytokine signaling 1 (SOCS1), and in each case, HTLV-1 blunted IFN-α-induced gene expression within the range 1.4−3.9-fold (p<.07 by t-test for STAT-1, and p<.05 for the other genes). Expression of several genes was altered by HTLV more than 4-fold in the absence of IFN-α, including induction of ISG15, and reduced expression of JAK2, CSF1R, growth hormone receptor (GHR), IFN-γ receptor 1 (IFN-γR1), adaptor SIT1, chemokine CXCL9, C-reactive protein (CRP), oncoSTATin M (OSM), transcription factor GATA3, Fc-γ receptor 1 (Fc-γR1) , IL4, and suppressor of cytokine signaling 2 (SOCS2).
Table 1. Results of Gene Expression Array Examining Effects of HTLV-1 and IFN-α in HeLa Cells.
Levels of each mRNA in cells treated for 2 hrs with 1000 U/ml IFN-α or untreated cells were determined by real time RT-PCR, normalized to 5 housekeeping genes, and then normalized to values obtained in HeLa cells transfected with pBluescript and not treated with IFN-α.
| |
HTLV |
IFN |
HTLV + IFN |
|---|---|---|---|
| JAK-STAT Proteins | |||
| JAK1 | 0.89 | 0.47 | 0.86 |
| JAK2 | 0.29 | 0.77 | 0.49 |
| STAT1 | 0.67 | 5.76 | 3.93 |
| STAT2 | 1.44 | 6.61 | 3.93 |
| TYK2 |
0.89 |
0.47 |
0.69 |
| Receptors that bind and active JAK proteins | |||
| CSF1R | 0.12 | 1.54 | 0.56 |
| GHR | 0.07 | 2.18 | 0.80 |
| IFN-γR1 | 0.25 | 0.95 | 0.69 |
| IL10RA |
2.03 |
4.07 |
1.30 |
| SH3/SH2 adaptor proteins | |||
| SH2B | 0.77 | 0.83 | 0.40 |
| SIT1 | 0.11 | 2.18 | 0.56 |
| SRC |
0.58 |
0.27 |
0.23 |
| STAT1 inducible genes | |||
| CXCL9 | 0.10 | 3.08 | 1.30 |
| IRF1 |
3.08 |
5.37 |
6.39 |
| STAT3 inducible genes | |||
| CDKN1A | 1.90 | 1.02 | 2.26 |
| CRP | 0.16 | 3.31 | 0.98 |
| IRF1 | 3.08 | 5.37 | 6.39 |
| SOCS1 |
0.89 |
13.22 |
7.86 |
| STAT 4 inducible gene | |||
| IRF1 |
3.08 |
5.37 |
6.39 |
| STAT5 inducible genes | |||
| CCND1 | 0.24 | 0.24 | 0.40 |
| CDKN1A | 1.90 | 1.02 | 2.26 |
| IRF1 | 3.08 | 5.37 | 6.39 |
| OSM |
0.14 |
3.08 |
0.80 |
| STAT6 inducible genes | |||
| GATA3 | 0.24 | 2.34 | 0.80 |
| FcER1 | 0.04 | 1.90 | 0.69 |
| IL4 |
0.05 |
2.88 |
0.92 |
| STAT1/STAT1/IRF9 inducible gene | |||
| GBP1 |
4.36 |
184.18 |
51.09 |
| STAT1/STAT2/IRF9 inducible genes | |||
| ISG15 | 5.01 | 9.35 | 20.75 |
| OAS |
1.44 |
37.40 |
11.92 |
| Inhibitors of JAK/STAT pathway | |||
| SOCS1 | 0.89 | 13.22 | 7.86 |
| SOCS2 | 0.25 | 1.54 | 0.98 |
| SOCS4 | 0.83 | 0.83 | 0.49 |
IFN-α signaling is initiated by binding to the heterodimeric IFN-α receptor, activation of JAK1 and TYK2 protein kinases, resulting in phosphorylation of STAT1 and STAT2 which then interact with IRF9 to translocate as a complex into the nucleus to activate ISRE transcription. Immunoblots were used to examine phosphorylation of these critical mediators of IFN-α activity, and compared to immunoblots of the total level of the corresponding protein as well as that of actin (Fig 5). These studies were carried out 1 hr after IFN-α treatment in order to focus on early phosphorylation events. IFN-α-induced phosphorylation of STAT1 was detected at only low levels (1.49-fold), and effects of HTLV were limited. In contrast, IFN-α-induced phosphorylation of STAT2 19.5-fold, but only 5.49-fold in the presence of HTLV. Only limited IFN-α-induction of JAK1 phosphorylation was noted (1.32-fold), but IFN-α-induced phosphorylation of TYK2 4.7-fold, but only 1.26-fold in the presence of HTLV. There was very little effect of HTLV or IFN-αon total STAT1, STAT2, JAK1, and TYK2 protein levels, over the time course of this experiment. In this study, immunoblots were also performed for IRF1, IRF9, and PKR, and only small effects were noted in expression levels with HTLV or 1 hr of IFN-α treatment.
Fig 5. HTLV-1 Inhibition of IFN-α induced tyrosine phosphorylation of TYK2 and STAT2.

pACH (HTLV) or pBluescript transfected HeLa cells (CON) were cultured for 72 hr, and treated with 1000 u/ml of IFN-α for 1 hr of left untreated. The cell lysates were examined by immunoblots with antibodies to Tyr-701-phosphorylated STAT1, STAT1, Tyr689-phosphorylated STAT2, STAT2, Tyr-1022/1023-phosphorylated JAK1, JAK1, Tyr-1054/1055-phosphorylated TYK2, and TYK2. In addition, immunoblots are shown for IRF1, IRF9, PKR, and actin. Band intensities were determined by densitometry, and ratios of band intensities for phosphorylated compared to total protein levels are presented. Similar results were obtained in at least two different experiments for all of the proteins shown.
Discussion
IFN-α blocks HTLV-1 replication by inhibiting virus assembly and release, rather than viral protein synthesis as shown for many other types of animal viruses (Feng, VanderHeyden, and Ratner, 2003). This effect is a result of inhibition of Gag targeting to lipid rafts. It is unclear whether this is due to an effect of IFN-α on the protein or lipid composition of rafts, an effect of IFN-α on a chaperone protein, or an effect on a post-translational modification of Gag required for interaction with rafts. In the current, work, we found that HTLV-1 also partially blunts signaling by IFN-α, as well as IFN-β (Fig 2). This effect is likely mediated by the Gag protein, although we can not fully exclude effects due to viral protease or virion RNA (Fig 3). Perhaps HTLV-1 Gag perturbs the lipid raft environment critical for type I IFN signaling to STAT1 and STAT2 (Marchetti et al., 2006).
Studies of effects of HTLV-1 on IFN-α responses showed that ISRE-containing gene expression is generally reduced by HTLV-1, although to a variable extent. It is notable that HTLV-1 repressed exogenous ISRE-containing gene expression to a similar extent whether or not IFN was added (Fig 2 and 3). In contrast, endogenous ISRE-containing gene expression was repressed only in the presence of IFN (Fig 4 and Table 1). Perhaps, plasmid transfection activated endogenous IFN production.
IFN-α-stimulated expression of IFI27, GIP3, MxA, PKR, GBP1, and OAS were reduced by HTLV-1 by 39−74%, whereas IFN-α-stimulated expression of PKR was reduced by <15% (Fig 4). Moreover, IFN-α-stimulated expression of ISG15 was mildly stimulated by HTLV-1. Effects on ISG15 were likely related to the fact that HTLV-1 directly stimulates ISG15, in the absence of IFN-α (Table 1) (Ruckes et al, 2001). These differences may relate to differences in binding affinities of ISGF3 complexes based on differences in ISRE sequences within each of these genes, or differences in effects of HTLV-1 on STAT-1 vs. STAT-2, or other STAT proteins (Kovarik et al., 2001; Wesoly, Szweykowska-Kulinska, and Bluyssen, 2007). The latter explanation is consistent with the finding that HTLV-1 had no effect on IFN-α-stimulated IRF1 expression mediated by the GAS response element, which preferentially binds STAT1 homodimers (Wesoly, Szweykowska-Kulinska, and Bluyssen, 2007).
We also explored the steps in the IFN-α pathway affected by HTLV-1. The lack of HTLV-1 inhibition of IFN-α-stimulated IRF1 expression suggests that cell surface presentation of IFN-αR1 and IFN-αR2 and IFN-α binding is not perturbed by HTLV-1. This is consistent with a previous report (Yokosawa et al., 1997). Immunoblot studies showed that HTLV-1 did not have an effect on total JAK1, TYK2, STAT1 and STAT2 protein levels (Fig 5). The lack of effects on synthesis of these proteins despite effects of HTLV-1 on their mRNA levels (Table 1), is likely due to our experimental conditions in which protein levels were examined after only 1 hr and RNA levels were examined after 4 hrs of IFN-α treatment. Nevertheless, HTLV-1 had significant effects on TYK2 and STAT2 phosphorylation, and possibly, but to a lesser extent on JAK1 and STAT1 phosphorylation. This may be mediated by effects of HTLV-1 on JAK1, TYK2, STAT1, or STAT2 association with the IFN-α receptor, activation of JAK/STAT by the receptor, or dephosphorylation of JAK/STAT(Fig 5). However, we can not exclude the possibility that HTLV-1 has additional and distinct repressive roles in the IFN signaling pathway (Mordechai et al., 1995; Yamagata et al., 1996).
These findings may be applicable to therapeutic uses of IFN in infected individuals, or to endogenous IFN expression during innate immune defenses against HTLV infection. Further examination of the mechanism of HTLV-1 inhibition of signaling by IFN-α, and methods to overcome IFN-α-resistance may improve therapy for HTLV-1, and perhaps other retrovirus infections.
Acknowledgements
This work was supported by PHS grants CA10521, CA63417, CA10073, and CA109678
Footnotes
Publisher's Disclaimer: This is a PDF file of an unedited manuscript that has been accepted for publication. As a service to our customers we are providing this early version of the manuscript. The manuscript will undergo copyediting, typesetting, and review of the resulting proof before it is published in its final citable form. Please note that during the production process errors may be discovered which could affect the content, and all legal disclaimers that apply to the journal pertain.
References
- Best SM, Morris KL, Shannon JG, Robertson SJ, Mitzel DN, Park GS, Boer E, Wolfinbarger JB, Bloom ME. Inhibition of interferon-stimulated JAK-STAT signaling by a tick-borne flavivirus and identification of NS5 as an interferon antagonist. Journal of Virology. 2005;79:12828–12839. doi: 10.1128/JVI.79.20.12828-12839.2005. [DOI] [PMC free article] [PubMed] [Google Scholar]
- Brierley MM, Fish EN. Stats: Multifaceted regulators of transcription. Journal of Interferon & Cytokine Research. 2005;25:733–744. doi: 10.1089/jir.2005.25.733. [DOI] [PubMed] [Google Scholar]
- Dave RS, McGettigan JP, Qureshi T, Schnell MJ, Nunnari G, Pomerantz RJ. siRNA targeting vaccinia virus double-stranded RNA bidning protein [E3L] exerts potent antiviral effects. Virology. 2006;348:498–497. doi: 10.1016/j.virol.2006.01.013. [DOI] [PubMed] [Google Scholar]
- Feng X, VanderHeyden N, Ratner L. Interferon-alpha-inhibits HTLV-1 assembly. Journal of Virology. 2003;77:13389–13395. doi: 10.1128/JVI.77.24.13389-13395.2003. [DOI] [PMC free article] [PubMed] [Google Scholar]
- Furuya T, Nakamura F, Fujimoto T, Nakane S, Kambara C, Shirabe S, Hamasaki S, Motomura M, Eguchi K. Elevated levels of interleukin-12 and interferon-gamma in patients with human T lymphotropic virus type I-associated myelopathy. Journal of Neuroimmunology. 1999;95:185–189. doi: 10.1016/s0165-5728(98)00263-x. [DOI] [PubMed] [Google Scholar]
- Garcia-Sastre A. Mechanisms of inhibition of the host interferon alpha/beta-mediated antiviral responses by viruses. Microbes and Infection. 2002;4:647–655. doi: 10.1016/s1286-4579(02)01583-6. [DOI] [PubMed] [Google Scholar]
- Guo JT, Hayashi J, Seeger C. West Nile virus inhibits the signal transduction pathway of alpha interferon. Journal of Virology. 2005;79:1343–1350. doi: 10.1128/JVI.79.3.1343-1350.2005. [DOI] [PMC free article] [PubMed] [Google Scholar]
- Heidecker G, Hill S, Lloyd PA, Derse D. A novel protease processing site in the transframe protein of human T-cell leukemia virus type 1 PR76(gag-pro) defines the N terminus of RT. Journal of Virology. 2002;76:13101–13105. doi: 10.1128/JVI.76.24.13101-13105.2002. [DOI] [PMC free article] [PubMed] [Google Scholar]
- Hishizawa M, Imada K, Kitwaki T, Ueda M, Kadowaki N, Uchiyama T. Depletion and impaired interferon-alpha-producing capacity of blood plasmacytoid dendritic cells in human T-cell leukaemia virus type I-infected individuals. British Journal of Haematology. 2004;125:568–575. doi: 10.1111/j.1365-2141.2004.04956.x. [DOI] [PubMed] [Google Scholar]
- Ho L,J, Hung LF, Weng CY, Wu WL, Chou P, Lin YL, Chang DM, Tai TY, Lai JH. Dengue virus type 2 antagonizes IFN-alpha but not IFN-gamma antiviral effect via down-regulating Tyk2-STAT signaling in the human dendritic cell. Journal of Immunology. 2005;174:8163–8172. doi: 10.4049/jimmunol.174.12.8163. [DOI] [PubMed] [Google Scholar]
- Katze MG, He Y, Gale M. Viruses and interferon: a fight for supremacy. Nature Reviews in Immunology. 2002;2:675–687. doi: 10.1038/nri888. [DOI] [PubMed] [Google Scholar]
- Khabara KSA, al-Haja L, al-Zoghaibia F, Mariea M, Dhallaa M, Polyakc SJ, Williams BRG. Expressed gene clusters associated with cellular sensitivity and resistant towards anti-viral and anti-proliferation actions of interferon. Journal of Molecular Biology. 2004;342:833–846. doi: 10.1016/j.jmb.2004.07.065. [DOI] [PubMed] [Google Scholar]
- Kimata JT, Wong F-H, Wang JJ, VanderHeyden N, Ratner L. Construction and characterization of infectious human T-cell leukemia virus type 1 molecular clones. Virology. 1994;204:656–664. doi: 10.1006/viro.1994.1581. [DOI] [PubMed] [Google Scholar]
- Kovarik P, Mangold M, Ramsauer K, Heidari H, Steinborn R, Zotter A, Levy DE, Muller M, Decker T. Specificity of signaling by Stat1 depends on SH2 and C-terminal dcomains that regulate Ser727 phosphorylation, differentially affecting specific target gene expression. The EMBO Journal. 2001;20:91–100. doi: 10.1093/emboj/20.1.91. [DOI] [PMC free article] [PubMed] [Google Scholar]
- Levy DE, Garcia-Sastre A. The virus battles: IFN induction of the antiviral state and mechansims of viral evasion. Cytokine Growth Factor Reviews. 2001;12:143–156. doi: 10.1016/s1359-6101(00)00027-7. [DOI] [PubMed] [Google Scholar]
- Li S, Labrecque S, Gauzzi MC, Cuddihy AR, Wong AH, Pellegrini S, Matlashewski GJ, Koromilas AE. The human papilloma virus (HPV)-18 E6 oncoprotein physically associated with TYK2 and impairs JAK-STAT activation by interferon-alpha. Oncogene. 1999;18:5727–5737. doi: 10.1038/sj.onc.1202960. [DOI] [PubMed] [Google Scholar]
- Lin R-J, Chang B-L, Yu H-P, Liao C-L, Lin Y-L. Blocking of interferon-induced JAK-Stat signaling by Japanese encephalitis virus NS5 through a protein tyrosine phosphatase-mediated mechanism. Journal of Virology. 2006;80(12):5908–5918. doi: 10.1128/JVI.02714-05. [DOI] [PMC free article] [PubMed] [Google Scholar]
- Marchetti M, Monier M-N, Fradagrada A, Mitchell K, Baycheliere F, Eid P, Johannes L, Lamaze C. Stat-mediated signaling induced by type I and type II interferons (IFNs) is differentially controlled through lipid microdomain assoication and clathrin-dependent endocytosis of IFN receptors. Molecular Biology of the Cell. 2006;17:2896–2909. doi: 10.1091/mbc.E06-01-0076. [DOI] [PMC free article] [PubMed] [Google Scholar]
- Migone TS, Lin JX, Cereseto A, Mulloy JC, O'Shea JJ, Franchini G, Leonard WJ. Constitutively activated JAK-STAT pathway in T cells transformed with HTLV-I. Science. 1995;269:79–81. doi: 10.1126/science.7604283. [DOI] [PubMed] [Google Scholar]
- Mordechai E, Kon N, Henderson EE, Suhadolnik RJ. Activation of the interferoninducible enzymes, 2′,5′-oligoadenylate synthetase and PKR by human T-cell leukmiea virus type I Rex-response element. Virology. 1995;206:913–922. doi: 10.1006/viro.1995.1014. [DOI] [PubMed] [Google Scholar]
- Okumura A, Lu G, Pitha-Rowe I, Pitha PM. Innate antiviral response targets HIV-1 release by the induction of ubiquitin-like protein ISG15. Proceedings of the National Academy of Science, USA. 2006;103(5):1440–1445. doi: 10.1073/pnas.0510518103. [DOI] [PMC free article] [PubMed] [Google Scholar]
- Ramos JC, Ruiz P, Ratner L, Reis IM, Brites C, Pedroso C, Byrne GE, Toomey NL, Andela V, Harhaj EW, Lossos IS, Harrington WJ. IRF-4 and c-Rel expression in antiviral-resistant adult T-cell leukemia/lymphoma. Blood. 2007;109:3060–3068. doi: 10.1182/blood-2006-07-036368. [DOI] [PMC free article] [PubMed] [Google Scholar]
- Robek MD, Ratner L. Immortalization of T-lymphocytes by human T-cell leukemia virus type 1 tax mutants with different trans-activating phenotypes. Journal of Virology. 1999;73:4856–4865. doi: 10.1128/jvi.73.6.4856-4865.1999. [DOI] [PMC free article] [PubMed] [Google Scholar]
- Ruckes T, Saul D, Van Snick J, Hermine O, Grassman R. Autocrine antiapoptotic stimulated of cultured adult T-cell leukemia cells by overexpression of the chemokine I-309. Blood. 2001;98:1150–1159. doi: 10.1182/blood.v98.4.1150. [DOI] [PubMed] [Google Scholar]
- Samuel MA, Diamond MS. Pathogenesis of West Nile virus infection: a balance between virulence, innate and adaptive immunity, and viral evasion. Journal of Virology. 2006;80(19):9349–9360. doi: 10.1128/JVI.01122-06. [DOI] [PMC free article] [PubMed] [Google Scholar]
- Sen GC. Viruses and interferons. Annual Review of Microbiology. 2001;55:255–281. doi: 10.1146/annurev.micro.55.1.255. [DOI] [PubMed] [Google Scholar]
- Trejo S, Ratner L. The HTLV receptor is widely expressed. Virology. 2000;268:41–48. doi: 10.1006/viro.2000.0143. [DOI] [PubMed] [Google Scholar]
- Tsukahara T, Ratner L. Characterization of envelope glycoprotein mutants for HTLV-1 infectivity and immortalization. Journal of Virology. 2001;75:9553–9559. doi: 10.1128/JVI.75.19.9553-9559.2001. [DOI] [PMC free article] [PubMed] [Google Scholar]
- vanBoxel-Dezaire AHH, Rani MRS, Stark GR. Complex modulation of cell type-specific signaling in response to type I interferons. Immunity. 2006;25:361–372. doi: 10.1016/j.immuni.2006.08.014. [DOI] [PubMed] [Google Scholar]
- Wesoly J, Szweykowska-Kulinska Z, Bluyssen HAR. Stat activation and differential complex formation dictate selectivity of interferon responses. Acta Biochima Polonica. 2007;54:27–38. [PubMed] [Google Scholar]
- Yamagata T, Nishida J, Tanaka S, Sakai R, Mitani K, Yoshia M, Taniguchi T, Tazaki Y, Hirai H. A novel interferon regulatory factor family transcription factor, ICSAT/Pip/LSIRF, that negative regulates the activity of interferon-regulated genes. Molecular and C ellular Biology. 1996;16:1283–1294. doi: 10.1128/MCB.16.4.1283. [DOI] [PMC free article] [PubMed] [Google Scholar]
- Yokosawa N, Indoh T, Kubota T, Yashiki T, Fujii N. Suppressed induction of 2-5 OAS in cells with HTLV-I is not associated with the fluctuation of IFN-receptor, IFN-regulatory factors (IRF1 and IRF-2) or Stat-1 alpha. Microbiology and Immunology. 1997;41:63–66. doi: 10.1111/j.1348-0421.1997.tb01173.x. [DOI] [PubMed] [Google Scholar]