

Abstract
We have overexpressed in Escherichia coli the thymidylate kinase of Mycobacterium tuberculosis (TMPKmt). Biochemical and physico-chemical characterization of TMPKmt revealed distinct structural and catalytic features when compared to its counterpart from yeast (TMPKy) or E. coli (TMPKec). Denaturation of the dimeric TMPKmt by urea under equilibrium conditions was studied by intrinsic fluorescence and circular dichroism (CD) spectroscopy. It suggested a three-state unfolding mechanism with a monomeric intermediate. On the other hand, 3′-azido-3′-deoxythymidine monophosphate (AZT-MP), which is substrate for TMPKy and TMPKec acts as a potent competitive inhibitor for TMPKmt. We propose a structural model of TMPKmt in which the overall fold described in TMPKy and TMPKec is conserved and slight differences at the level of primary and 3D-structure explain strong variations in the phosphorylation rate of substrate analogs. According to the model, we synthesized dTMP analogs acting either as substrates or specific inhibitors of TMPKmt. This approach based on slight structural differences among similar proteins could be applied to other essential enzymes for the design of new species-specific antimicrobials.
Keywords: Tuberculosis, circular dichroism, fluorescence spectroscopy, molecular modeling, structure-function relationship
Mycobacterium tuberculosis, the causative agent of tuberculosis, is the leading cause of death from infectious agents. Diverse factors, the most important being the acquired immunodeficiency syndrome (AIDS) epidemics, have provoked a resurgence of this disease in industrialized countries. In 1996, the World Health Organization (WHO) declared tuberculosis to be a global emergency, as multidrug-resistant strains recently have emerged (for review, see Barry and Mdluli [1996] and Cole [1994]). Because the bacille Calmette-Guérin (BCG) vaccine efficacy is a subject of controversy, the search for new targets to obtain more effective drugs to control the spread of tuberculosis is a priority. In this respect, we have focused our attention on thymidylate kinase of M. tuberculosis (TMPKmt) for several reasons: (1) The enzyme, which phophorylates dTMP to dTDP, is essential for DNA synthesis in vivo as has been demonstrated with the cdc8 mutant in Saccharomyces cerevisiae. The CDC8 protein, the thymidylate kinase from yeast (TMPKy) (Jong et al. 1984; Sclafani and Fangman 1984), is a cell-cycle–regulated protein (White et al. 1987); (2) Studies using in vivo expression technology (Mahan et al. 1993; Valvidia and Falkow 1997) suggested that bacterial pathogenicity depends on genes essential for bacterial growth and intracellular survival (Moors and Portnoy 1995); (3) Sequence comparison of TMPKmt with the enzyme from other species revealed 22% to 28% identity and suggested that TMPKmt contains sequence motifs from E. coli (TMPKec) and yeast enzymes, and thus might behave as a "chimera" of these two enzymes.
We have cloned the tmk gene of M. tuberculosis and characterized the overexpressed protein by various biochemical and physico-chemical methods. Kinetic studies revealed similarities, but also significant differences between TMPKmt and its counterpart from yeast or from E. coli. The most surprising observation is the fact that 3′-azido-3′-deoxythymidine monophosphate (AZT-MP), which is substrate for TMPKec and TMPKy, behaves as a competitive inhibitor for TMPKmt. Based on the available three-dimensional structure of TMPKy and TMPKec (Lavie et al. 1997; 1998a, b), we propose a structural model of TMPKmt, which could give clues for understanding the differences in substrate-analog phosphorylation between these enzymes. This model enabled us to design new substrate analogs or competitive inhibitors, which behaved as predicted.
Results
Sequence comparison of M. tuberculosis TMPK with other members of TMPK family
TMPKmt showed highest identities (26%–28%) with TMPK from Methanobacterium thermoautotrophicum and from two other hyperthermophilic bacteria (Aquifex aeolicus and Archeoglobus fulgidus). TMPKec and TMPKy, whose crystal structures have been solved (Lavie et al. 1997; 1998a, b), shared slightly lower sequence identity with TMPKmt (roughly 23% over 200 residues), while TMPKec and TMPKy are roughly 24% identical. However, most residues critical for substrate binding and catalysis are conserved (Fig. 1 ▶). The conservation of a similar fold in TMPKmt was confirmed further through hydrophobic cluster analysis comparison (Callebaut et al. 1997) and molecular modeling using the structures of TMPKy and TMPKec in complex with P 1–(5′-adenosyl)-P 5–(5′-thymidyl)pentaphosphate (TP5A) (Lavie et al. 1998a, b; codes PDB3TMK and PDB5TMP). The pseudo-energy derived from TITO (Labesse and Mornon 1998), PROSA (Sippl and Weitckus 1992) and the score from Verify3D (Eisenberg et al. 1997) validate the model (−50.5, −1.2 and +0.3, respectively). The values of the different validation scores compared favorably with the ones obtained for the two crystal structures of TMPKy and TMPKec (TITO: −58.8 and −63.2 for PDB3TMK and PDB5TMP respectively; PROSA: −1.7 and Verify3D: +0.4 for both PDB3TMK and PDB5TMP). The dimer interface described in the crystal structure of TMPKy was predicted to be conserved in TMPKmt. The α3 and α6 helices involved in this interface possess mainly hydrophobic side-chains.
Fig. 1.

Alignment of the amino-acid sequences of TMPKmt (mt, this work) with TMPKy (sc) and TMPKec (ec). In green are identical residues in all three sequences. In light blue are amino acids common to TMPKy and TMPKmt and in red those that are common to TMPKec and TMPKmt to emphasise that TMPKmt might be considered as a chimeric sequence of TMPKy and TMPKec. Two positions occupied in TMPKmt by specific amino acids (Arg14 and Asn100) are shown in violet. Underlined arginine residues of TMPKmt are mentioned in the text. The secondary structure elements of TMPKy as well as the P-loop (involved in nucleoside di- or triphosphate binding) and the LID domain are shown under and over the alignment, respectively. The LID domains of TMPKy and TMPKec were not aligned as their backbone conformations differ greatly and do not superimpose.
TMPKmt has an acidic residue (Asp9) in its P-loop equivalent to Asp14 in TMPKy and Glu12 in TMPKec, a unique feature among NMPKs (Lavie et al. 1998a, b). This position is followed by a glycine in TMPKmt and TMPKec, and by an arginine in TMPKy (Fig. 1 ▶). The shorter acidic side chain in TMPKy and TMPKmt is correlated with the close contact with Gln172 in TMPKmt instead of Phe167 in TMPKec. The TMPKmt P-loop possesses a unique substitution (Arg14) instead of an otherwise very well conserved Thr in TMPKy and TMPKec (Fig. 1 ▶), and other NMPKs (Chenal-Francisque et al. 1999; Lavie et al. 1998a). A particularity of TMPKmt is that the Arg residues, underlined in Figure 1 ▶, which participate in stabilizing the presumed transition state, are found both in the P-loop (as in TMPKy) and in the LID region (as in TMPKec).
By similarity with TMPKec, the LID region (Schulz et al. 1990) of TMPKmt is predicted to adopt a helical conformation and would harbor three arginines, two of them (Arg149 and Arg153) likely involved in ATP binding (Lavie et al. 1998b). The LID domains are solvent-exposed segments observed in various NMPKs, whose conformation changes upon binding of ATP, leading to closure of the catalytic site (Schulz et al. 1990). In this domain, the backbone conformation of TMPKy differs considerably in correlation with the presence of a bulky Arg15 pointing toward the LID. This large hydrophilic residue is replaced by a glycine in TMPKmt and TMPKec.
Two other structural motifs, including residues directly involved in the active site, also suggested the "chimeric" nature of TMPKmt when compared with TMPKy and TMPKec. The stretch harboring the 91///DRxx/SxxAYs104 signature (where `/' stands for any hydrophobic amino acid, x for any other amino acid, upper case for strictly conserved residues and lower case for position allowing conservative mutations) is better conserved between TMPKmt and TMPKy (Fig. 1 ▶). It comprises residues lying in the catalytic site such as Arg95 (Fig. 2A ▶). By contrast, the consensus sequence 175rtxaxy/eLaaq185 found in the α7-helix was more similar in TMPKmt and TMPKec (Fig. 1 ▶). We predict that Tyr179 would be involved in hydrogen bonding with two strictly conserved catalytic residues Arg95 and Ser99 (Fig. 2A ▶).
Fig. 2.


(A) Active site of the modeled TMPKmt. The Cα carbone trace is shown as well as the side chain of important residues (discussed in the text). The color code is the same as in figure 1 ▶. The bi-substrate Tp5A [P1–(5′-adenosyl)-P5–(5′-thymidyl)pentaphosphate] is in yellow. Sumperimposed active sites of the modeled TMPKmt and of the available structures (Lavie et al. 1998a, 1998b">b) of TMPKy (B) and of TMPKec (C). dTMP is in yellow. The side chain of important residues for substrate recognition (as discussed in the text) are shown. Residues from TMPKmt that are conserved with TMPKy and TMPKec are in green while those specific of TMPKmt are in violet. All residues from TMPKy are in light blue (B) and those from TMPKec are in red (C). Specific interactions (predicted hydrogen bonds) involving TMPKmt side chains of Arg14, Arg74, Ser103, Asn100, and dTMP are shown as thick red lines.
A specific feature of TMPKmt is Asn100, predicted to be buried in the vicinity of dTMP binding site and which corresponds to Gly99 in TMPKy (Fig. 2B ▶) and Thr105 in TMPKec (Fig. 2C ▶). The Thr105 side chain in TMPKec is hydrogen-bonded to the O4 carbonyl group of dTMP and to the guanidinium group of the conserved Arg74 in TMPKmt. The Asn100 side chain of TMPKmt might thus participate in a hydrogen bond network involving the base moiety of dTMP and/or the neighboring Ser104.
Overexpression, purification, and molecular characterization of TMPK from M. tuberculosis
TMPKmt (Rv3247c) expressed in E. coli represented over 30% of total bacterial proteins. The recombinant enzyme, recovered from the supernatant after E. coli breakage and centrifugation, was purified by a two-step procedure. Chromatography on Blue-Sepharose and gel permeation yielded over 95% pure enzyme as revealed by SDS-PAGE (Fig. 3 ▶). The molecular mass of TMPKmt, determined by electrospray ionisation mass spectrometry (22635.89 ± 2.23 Da), corresponded to that calculated from the deduced protein sequence (22634.58 Da). The molecular mass of the native protein determined by sedimentation equilibrium ultracentrifugation (46600 ± 1300 Da) is consistent with a dimer.
Fig. 3.
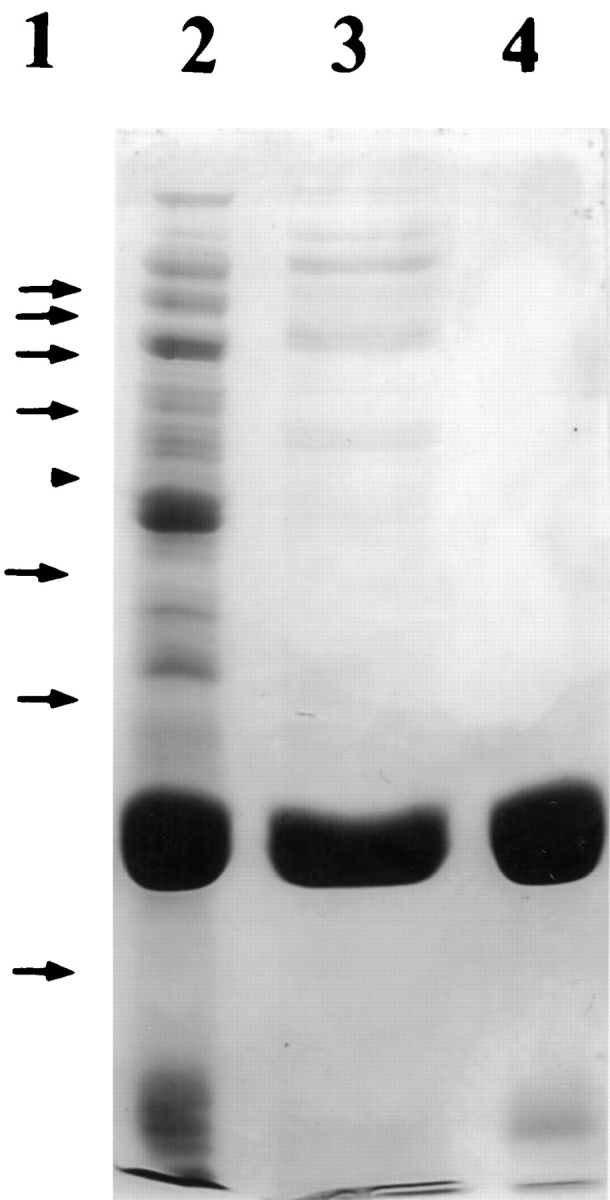
SDS-PAGE (12.5%) of TMPKmt. Lane 1, the protein molecular weight standards (arrows) were the 10 kDa Protein Ladder from Gibco BRL. The arrowhead corresponds to the 50 kDa band; lane 2, bacterial extract (20 μg of proteins); lane 3, pool after Blue Sepharose chromatography (20 μg of proteins); lane 4, enzyme after Ultrogel AcA54 chromatography (10 μg of proteins).
Limited proteolysis of TMPKmt with TPCK-trypsin yielded three bands in SDS-PAGE with apparent molecular masses of 13, 12, and < 10 kDa. dTMP at 5 mM protected TMPKmt only slightly from proteolysis. N-terminal sequencing revealed that the upper and the middle bands correspond to the N-terminus of TMPKmt. The lower band corresponds to two C-terminal fragments of TMPKmt, one starting at Gly152, and the second (the major) starting at Ala154. Gly152 and Ala154 are located within the putative LID domain of TMPKmt.
Aliquots of 1 mg/mL protein in 50 mM Tris-HCl pH 7.4 were heated for 10 minutes at temperatures between 35°C and 70°C, after which residual activity was determined. TMPKmt was half inactivated at 65°C. The thermal unfolding of TMPKmt examined by microcalorimetry is irreversible (Fig. 4 ▶). The midtemperature (Tm) of thermal denaturation of TMPKmt alone (68°C) was not affected by 0.5 mM ATP, whereas addition of 0.5 mM dTMP increased the Tm of the protein by 5.7°C.
Fig. 4.

Representative differential scanning calorimetry experiments of TMPKmt. (A) without ligand; (B) in the presence of 5 mM ATP; (C) in the presence of 5 mM dTMP. The protein concentration was about 1.5 mg/mL.
Conformational stability of TMPKmt
Upon incubation in various concentrations of urea, the emission spectrum of TMPKmt (four Trp residues) was gradually shifted to the red with a slight decrease in intensity. Although the unfolding process is reversible, at a protein concentration higher than 2.10–6 M, substantial aggregation occurred when the protein was transferred from high (8 M) to low urea concentration. In contrast, incubation of the native protein in urea in the same concentration range never resulted in observable aggregation. The distribution of data points could not be fitted to a simple 2-state transition resulting from a coupled dissociation/unfolding process of the native dimer into unfolded monomers. We tested two models of a 3-state transition (described under Materials and Methods). The variation of fluorescence intensity at 325 nm measured with samples of protein at 10–7 M unfolded in the presence of urea at various concentrations followed the same distribution as the maximum emission wavelength shift, and could indeed be fitted to both models (Table 1). To discriminate between the two models, we studied the effect of protein concentration on the transition curve characteristics. The experiments were repeated at 2.10–7, 10–6 and 4.10–6 M protein concentrations and the parameters obtained from individual fits to equations 2 and 3 are shown in Table 1.
Table 1.
Thermodynamic parameters characterizing the unfolding transition of TMPKmt
| Fluorescence | Circular dichroism | |||||||
| Total dimer concentration | ΔG0.1a | m1b | ΔG0.2a | m2b | ΔG0.1a | m1b | ΔG0.2a | m2b |
| Dimeric intermediate | ||||||||
| 10−7 M | 6.06 ± 5.70 | 1.90 ± 1.83 | 13.55 ± 8.36 | 1.20 ± 1.44 | ndc | nd | nd | nd |
| 2.10−7 M | 5.97 ± 14.97 | 1.74 ± 3.52 | 10.76 ± 14.37 | 0.51 ± 1.71 | nd | nd | nd | nd |
| 10−6 M | 8.09 ± 1.93 | 2.34 ± 0.55 | 14.01 ± 4.01 | 1.42 ± 0.72 | 9.16 ± 2.71 | 2.66 ± 0.77 | 12.93 ± 3.05 | 1.23 ± 0.55 |
| 4.10−6 M | 8.9 ± 2.4 | 2.3 ± 0.6 | 14.0 ± 6.9 | 1.4 ± 1.2 | 12.19 ± 9.34 | 3.12 ± 2.22 | 10.61 ± 6.10 | 0.91 ± 0.98 |
| Monomeric intermediate | ||||||||
| 10−7 M | 16.23 ± 1.14 | 2.31 ± 0.39 | 5.51 ± 0.62 | 1.26 ± 0.06 | nd | nd | nd | nd |
| 2.10−7 M | 18.16 ± 0.28 | 2.94 ± 0.05 | 6.43 ± 0.50 | 1.26 ± 0.12 | nd | nd | nd | nd |
| 10−6 M | 18.55 ± 0.11 | 3.14 ± 0.04 | 6.21 ± 0.16 | 1.29 ± 0.02 | 18.47 ± 0.13 | 3.12 ± 0.02 | 6.12 ± 0.04 | 1.28 ± 0.02 |
| 4.10−6 M | 18.26 ± 0.66 | 3.00 ± 0.18 | 6.10 ± 0.49 | 1.21 ± 0.05 | 18.72 ± 0.74 | 3.14 ± 0.22 | 6.14 ± 1.17 | 1.30 ± 0.15 |
The unfolding transitions at different protein concentrations were individually fitted to both equation 2 (dimeric intermediate) and equation 3 (monomeric intermediate) as developed in Materials and Methods. The errors correspond to standard deviations obtained from the fits.
a In kCal • mole−1.
b In kCal • mole−1 • M−1.
c nd, not determined.
The transition of dissociation/unfolding of TMPKmt also was monitored by far-UV CD, at two protein concentrations: 10–6 and 4.10–6 M. The distribution of the CD amplitude as a function of urea concentration could be equally described by both 3-state transitions (Fig. 5 ▶ and Table 1). However, when using the transition including the monomeric intermediate, we observed a remarkable correlation between the sets of parameters deduced from the experiments monitored by CD and by fluorescence.
Fig. 5.
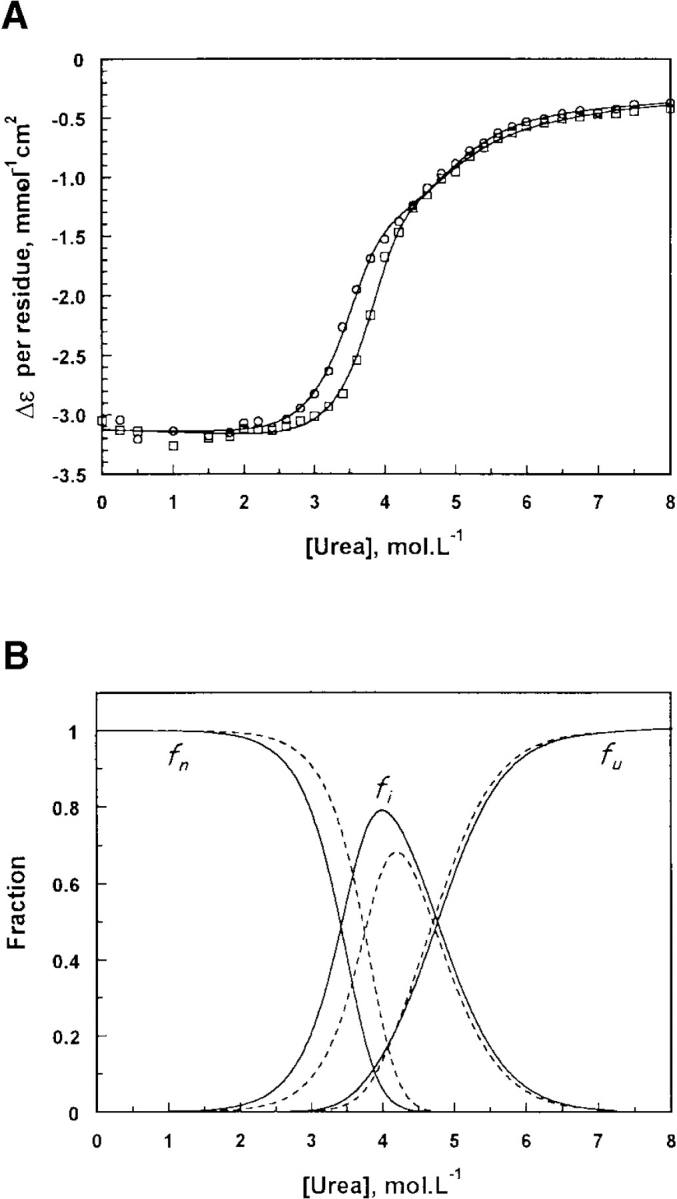
Denaturation of TMPKmt observed by far-ultraviolet circular dichroism. (A) Urea-induced unfolding transition of TMPKmt at 10–6 M (○) and 4.10–6 M (□). 8-M unfolded TMPKmt was diluted to a final concentration of 10–8 M or and 4.10–6 M in solutions containing urea at various concentrations and spectra were recorded after 48 h incubation. The solid lines correspond to the best fit to equation 3 using a nonlinear least square analysis. (B) variation of the native (fn), monomeric intermediate (fi) and unfolded (fu) fractions calculated from the parameters deduced from the individual fit of the two transition curves in (A). Solid line: TMPKmt at 10–6 M. Dotted line: TMPKmt at 4.10–6 M.
We concluded that the dissociation of the native dimeric species of TMPKmt occurs at an urea concentration of around 4 M, leading to the accumulation of partially folded monomers that unfold totally at urea concentrations above 5.5 M. The average values of the free energies of the dissociation and of the unfolding processes in the absence of urea, ΔG0,1 and ΔG0,2, are 18.1 ± 0.9 and 6.1 ± 0.3 kcal/mol, respectively, and the corresponding equilibrium constants are (6 ± 5).10–14 M and (3.5 ± 1.6).10–5 M.
Catalytic properties of TMPK from M. tuberculosis
The specific activity of TMPKmt is four- and six-fold lower than that of TMPKec and TMPKy, respectively. The Km for dTMP and ATP are of the same order of magnitude in TMPKmt, TMPKec and TMPKy (Table 2). TMPKmt has a broader specificity for nucleoside triphosphates (Table 3), than that observed with various other NMPKs (Chenal-Francisque et al. 1999; Munier-Lehmann et al. 1999; Bucurenci et al. 1996). The reaction rates with ATP or dATP as phosphate donors were similar. ITP, GTP, CTP, and UTP also could serve as efficient phosphate donors (order of efficacy: ITP > GTP > CTP > UTP). Even dGTP, dCTP, and dTTP act as phosphate donors, even though much less efficiently (1% for dTTP, 8% for dCTP, and 35% for dGTP compared to ATP).
Table 2.
Comparative kinetic parameters of TMPKmt, TMPKec, and TMPKy with ATP and dTMP as substrates
| TMPK | Km (ATP) (mM) | Km (dTMP) (μM) | Vm (ATP, dTMP) (μmole/min • mg of protein) | kcat (s−1) |
| M. tuberculosis | 0.1 | 4.5 | 13 | 4.5 |
| E. coli | 0.04 | 15 | 50 | 10.5 |
| Yeasta | 0.19 | 9 | 84 | 35 |
a Results from yeast were from Lavie et al. 1998a.
The reaction medium (0.5 mL final volume) contained 50 mM Tris-HCl pH 7.4, 50 mM KCl, 2 mM MgCl2, 0.2 mM NADH, 1 mM phosphoenol pyruvate, and 2 units each of lactate dehydrogenase, pyruvate kinase and nucleoside diphosphate kinase. Activity was determined at 30°C as described under Materials and Methods. ATP was constant (0.2, 0.3, 0.4, and 0.7 mM) whereas the concentration of dTMP varied between 0.025 and 0.2 mM.
Table 3.
Reaction rates of TMPKmt and TMPKec with various nucleoside triphosphates (NTP)
| NTP | M. tuberculosis | E. coli |
| ATP | 100 | 100 |
| dATP | 120 | 76 |
| ITP | 66 | 1 |
| GTP | 60 | 15 |
| CTP | 42 | 24 |
| UTP | 26 | 13 |
The reaction medium (0.5 mL final volume) was the same as described in Table 2. The concentrations of dTMP and nucleoside triphosphate were kept constant at 0.5 mM for TMPKmt and at 0.3 mM and 1 mM respectively for TMPKec. Activities with various NTPs are given considering the reaction rate with ATP as 100%.
Various base or sugar-modified dTMP analogs were tested on TMPKmt (Table 4). Replacement of the methyl group in the pyrimidine ring by a bromine (5Br-dUMP) does not affect the Km and the Vm of TMPKmt, whereas substitution by an iodine (5I-dUMP), which is larger than the Br atom, affects slightly both parameters (Km value 3.5-fold higher than that with dTMP and reaction rate 70% that with dTMP). On the other hand, replacement of the methyl group by F (5F-dUMP), which is smaller than Br, or removal of the methyl group (dUMP) drastically affect the affinity (Km value 10-fold and 50-fold higher than that with dTMP, respectively) and to a lesser extent the reaction rates (44% and 30% that with dTMP, respectively).
Table 4.
Kinetic parameters of TMPKmt with various nucleoside monophosphates
| NMP | Kmapp (mM) | Vm (μmole/min • mg of protein) | Ki (mM) |
| dTMP | 0.04 | 10.60 | |
| 3′F-TMP | 0.03 | 0.11 | |
| dehydro-TMP | 0.14 | 0.16 | |
| dUMP | 2.10 | 3.50 | |
| 5Br-dUMP | 0.03 | 9.82 | |
| 5I-dUMP | 0.14 | 7.46 | |
| 5F-dUMP | 0.42 | 4.66 | |
| 5-methyl isodCMP | 0.13 | ||
| AZT-MP | 0.02 |
The reaction medium (0.5 mL final volume) was the same as described in Table 2. The concentration of ATP was kept constant at 0.5 mM whereas the concentration of nucleoside monophosphates was varied within 0.05 and 3.6 mM.
According to the model, substitutions in position 2 of the pyrimidine ring were tested (Table 4). 2N-acetyl 5-methyl iso dCMP is substrate for TMPKmt (at ATP 0.5 mM, 60% reaction rate). On the other hand, 5-methyl iso dCMP is a competitive inhibitor with a Ki of 130 μM.
Modification of the 3′-OH group on the ribose moiety affected only slightly the affinity of different analogs of dTMP for the enzyme (Table 4). However, catalysis was found to be drastically reduced to about 1% for 3′F-dTMP and dehydro-TMP. Surprisingly, AZT-MP was found to be a competitive inhibitor of TMPKmt with a Ki of 20 μM (Fig. 6 ▶). The presence of an azido group abolished catalysis without changing the affinity. Nonetheless, AZT-MP is a substrate for the TMPKec and TMPKy, with only a 2-fold reduction of kcat for the bacterial enzyme and 200-fold for the yeast enzyme (Lavie et al. 1998a).
Fig. 6.

Inhibition of TMPKmt by 3′-azido-3′-deoxythymidine monophosphate. The reaction medium was the same as described in Table 2 and the assays were performed as described under Materials and Methods. ATP was kept constant at 0.3 mM whereas dTMP varied between 0.03 and 0.20 mM.
Discussion
A common feature of proteins from M. tuberculosis seems to be their high resistance to thermal denaturation associated with a lower catalytic activity. This is the case for urease (Clemens et al. 1995), for type-II 3-dehydroquinase (Moore et al. 1992) and for adenylate kinase (Munier-Lehmann et al. 1999). TMPKmt also is a very stable protein with a Tm of 68°C. The high thermal resistance of TMPKmt is correlated to a high conformational stability as evidenced by urea-induced denaturation (total standard Gibbs free energy for dissociation and subunit unfolding of 31 kcal/mol). From the quantitative analysis of denaturation transitions, we deduced that the unfolding mechanism proceeds by way of a partially folded monomeric species. The high value of the Gibbs free energy calculated for the dissociation process (18 kcal/mol) indicates that the stability of TMPKmt essentially is a result of strong interactions stabilizing the monomer-monomer interface within the dimeric species with a dissociation constant of about 3.5 × 10⁻¹⁴ M. The irreversibility of the thermal unfolding likely corresponds to the high propensity of the partly folded monomeric intermediates to aggregate, which competes with the productive second order kinetics step leading to native dimers. That the aggregation is prominent in the thermal unfolding indicates that the dimerisation step is a slow process as usually found in the folding mechanism of oligomeric proteins (Clark et al. 1997).
Lavie et al. (1998b) proposed a classification based on the capacity to phosphorylate AZT-MP: type I with TMPKy as representative and type II with TMPKec as representative, which differ in the way they stabilize the transition state by the presence of key arginine residues in the P-loop (type I) or in the LID region (type II). The larger AZT-MP compared to dTMP is well accommodated in TMPKec (type II), but in TMPKy (type I), the shift of a catalytic residue results in a substantial loss of activity. According to this classification, TMPKmt and TMPK from Yersinia pestis (TMPKyp), which possesses a LID domain very similar or identical to that of TMPKec, should belong to type II TMPKs and thus should phosphorylate AZT-MP with a good kcat. However, we found that TMPKmt does not phosphorylate AZT-MP and TMPKyp had a very low AZT-MP phosphorylating activity (Chenal-Francisque et al. 1999). The classification should thus be revised and residues other than arginines should be included to explain the different capacity of TMPKs in their AZT-MP phosphorylation.
In this context, we proposed a structural model of TMPKmt, based on the solved three-dimensional structures of TMPKec and TMPKy (Lavie et al. 1997; 1998a,b), in order to explain at least in part our results and to provide a basis for developing potent inhibitors of TMPKmt. The overall sequence conservation suggested that the TMPKmt structure likely deviates from the already known TMPK structures by an estimated root-mean-square deviation on the common Cα atom positions of ∼ 1 Å. However, our current model is in agreement with all our experimental data, especially those derived from trypsin digestion, stabilisation effects by ATP (low) and dTMP (high), CD and fluorescence spectroscopy, as well as the specificity for the various substrate analogs tested here. Analysis of the modeled active site leads us to predict the role of some residues lying within the phosphate donor or substrate binding pockets and Figure 2A ▶ presented the residues of TMPKmt involved in ATP and dTMP binding. According to the modeled structure, the methyl group of the dTMP base moiety would interact closely with the side chains of Phe36, Pro37, Arg74, and Arg95, which are in the same environment as in TMPKy (Fig. 2B ▶) and TMPKec (Fig. 2C ▶). The presence of the guanidinium group of Arg74 (distance to the methyl ∼3.9 Å) in an otherwise hydrophobic pocket would explain the measured affinity of the halogenated substrates. The corresponding substitution of Glu12 and Phe167 in TMPKec (Fig. 2C ▶) to Asp9 and Gln172 in TMPKmt and Asp14 and Gln157 in TMPKy (Fig. 2B ▶), respectively, might explain the much lower activity of TMPKy and TMPKmt on AZT-MP. While TMPKmt is already slightly less active on natural dTMP, some other structural factors might further decrease and finally abolish the activity on AZT-MP. Similarly, 3′ halogenated or deoxygenated dTMP analogs also are poor substrates for TMPKmt. Based on structural comparison, we suggest three possibilities to explain these catalytic properties of TMPKmt: the presence of specific substitutions (e.g., Arg14 and Asn100) in the active site of TMPKmt compared to the two other TMPKs, the overall low sequence similarity (∼25%; greater with hyperthermophilic TMPKs) and its enhanced thermal stability, suggesting a lower flexibility at 37°C.
New substitutions of the 3′ hydroxyl of dTMP already can be proposed based on the predicted close interaction of this ribose hydroxyl with Asp9, which carboxyl group repels any negatively charged fluoro or azido group. Furthermore, our model indicated that TMPKmt might accomodate in its dTMP binding site bulky substituants linked to C2 of the pyrimidine ring. Enough space is left in between Ser104 and the base moiety to be filled by groups such as urea or guanidium. Thus two different substitutions at position 2 on the base moiety were tested. For 5-methyl iso dCMP, the carbonyl group of dTMP is replaced by a polar group, an amine group, which would interact unfavorably with the surrounding aromatic side chains from residues Phe70, Tyr103, and Tyr165, normally involved in the interaction with dTMP (Fig. 2A ▶). On the contrary, the bulkier acetyl group in 2N-acetyl 5-methyl iso dCMP would not alter the interaction with the surrounding aromatic chains and would fit nicely in the pocket formed by Ser104 and Asn100. As predicted by the model, 5-methyl iso dCMP is a competitive inhibitor for TMPKmt whereas 2N-acetyl 5-methyl iso dCMP is a substrate for TMPKmt.
Local variation and fine structural divergence in essential enzyme such as dihydrofolate reductase (Li et al. 2000) or adenosine kinase (Carret et al. 1999) turned out to be attractive features for designing precisely tuned new drugs. Our study suggested that despite their global conservation among living organisms, TMPKs also could be targeted in a species-specific manner. The main advantage of this strategy is to select well-characterized protein families for which known inhibitors might become useful tools for rapid drug discovery as in the successful case of human immunodeficiency virus (HIV) protease (Wlodawer and Vondrasek 1998).
Materials and methods
Chemicals
Adenine nucleotides, restriction enzymes, T4 DNA polymerase, and coupling enzymes for determination of TMPK activity were from Roche Molecular Biochemicals. T4 DNA ligase and Vent DNA polymerase were from New England Biolabs, Inc. [α35S]ATP (1000 Ci/mmol) was a product from the Radiochemical Center (Amersham, UK). The sequencing reactions were performed using the Fidelity DNA Sequencing System from Q.BIOgene. Oligonucleotides were synthesized according to the phosphoramidate method using a commercial DNA synthesizer (Cyclone TM Biosearch). Blue-Sepharose and Ultrogel AcA54 were obtained from Amersham Pharmacia Biotech. L-1–(tosylamino)-2-phenylethyl chloromethyl ketone (TPCK)-treated trypsin, 5F-dUMP, 5Br-dUMP, 5I-dUMP and AZT-MP were from Sigma and ultra pure urea from ICN Biochemicals, Inc.
Bacterial strains and growth conditions
The E. coli NM554 (Raleigh et al. 1988) and BLI5 (Serina et al. 1995) strains were used for DNA purification and sequencing, and for production of recombinant TMPKmt encoded by the plasmid pHL50, respectively. Cultures were grown at 37°C in 2YT medium (Sambrook et al. 1989) supplemented with 100 μg/mL ampicillin and 30 μg/mL chloramphenicol. Production of recombinant TMPKmt was induced with isopropyl-1-thio-β-D-thiogalactoside (1 mM final concentration) when cultures reached an absorbance of 1.5 at 600 nm. Bacteria were harvested by centrifugation 3 h after induction.
Plasmids
The 642 bp fragment corresponding to the tmk gene of M. tuberculosis (MTCY20B11 gene in Genebank) was amplified by PCR (Sambrook et al. 1989) using the cosmid SCY20B11 as the matrix. The two synthetic oligonucleotides used for amplification were 5′-GGGGCATATGCTAATCGCGATTGAGGGCGTTGAC-3′ and 5′-CCCCAAGCTTTCAACTTGGCACGTCTGGAGGCG-3′. During amplification, NdeI and HindIII restriction sites (in bold letters in the oligonucleotide sequences) were created at both ends of the amplified fragment. After digestion by NdeI and HindIII, the amplified tmk gene was inserted into the pET22b plasmid (Novagen, Inc.) digested with the same enzymes. Three clones containing the M. tuberculosis tmk gene and overexpressing TMPKmt were characterised and one of them (pHL50) was kept for further studies. The DNA insert was sequenced using the double-stranded dideoxynucleotide sequencing technique (Sanger et al. 1977) in order to verify the absence of any mutational events in the course of amplification.
Purification and activity assay of TMPK from M. tuberculosis
Bacteria suspended in 50 mM Tris-HCl pH 7.4 were disrupted by sonication. After centrifugation at 14000 rpm for 30 minutes, the bacterial extract was loaded onto a Blue-Sepharose column equilibrated with the same buffer (10 mg of protein/mL of swollen gel). The column was washed with 10 volumes of 50 mM Tris-HCl pH 7.4 followed by 1 M NaCl in 50 mM Tris-HCl pH 7.4 (4 volumes). TMPKmt was eluted with 4 volumes of 2 M NaCl in 50 mM Tris-HCl pH 7.4. Fractions containing TMPKmt were pooled, concentrated and loaded onto a 1 × 110 cm Ultrogel AcA54 column equilibrated with 50 mM Tris-HCl pH 7.4 and fractions of 1.8 mL were collected at flow rates of 9 mL/h. TMPKmt activity was determined at 30°C using the coupled spectrophotometric assay at 334 nm (0.5 mL final) on an Eppendorf ECOM 6122 photometer (Blondin et al. 1994). One unit of enzyme activity corresponds to 1 μmole of the product formed in 1 minute at 30°C and pH 7.4.
Equilibrium sedimentation
The experiments were performed at 20°C on a Beckmann Optima XL-A analytical centrifuge using an An-60 Ti rotor and a cell with a 12 mm optical path length. Samples (150 μL) in 50 mM Tris-HCl pH 7.4 at ∼0.2 mg/mL were centrifuged at 20,000 rpm. Radial scans of absorbance at 280 nm were taken at 2 h intervals. Equilibrium was achieved after 14 h. Data were analyzed by the XL-A program supplied by Beckman. The partial specific volume of TMPKmt (0.718 cm3/g) was calculated from the sequence (Zamyatnin 1984).
Differential scanning microcalorimetry
Differential scanning microcalorimetry was carried out on a Micro Cal MCS calorimeter controlled by the MCS Observer program (MicroCal). Samples were extensively dialyzed against the buffer used in scanning experiments (50 mM Tris-HCl pH 7.4) and were routinely degassed for 5 minutes before they were used for a calorimetric analysis. They were scanned after the actual calorimetric scan for a second time to estimate the reversibility of the unfolding transition. Buffer baselines were measured under identical conditions and were subtracted from the corresponding data of the protein samples.
Equilibrium unfolding experiments
Urea was used as chemical denaturant. Typically, the protein at constant concentration (10–7, 2.10–7, 10–6 and 4.10–6 M) was incubated for 48 h at 25°C with urea at various concentrations ranging from 0.25 to 8 M in 50 mM Tris-HCl pH 7.4. For refolding experiments, protein at 10–6 M was first totally unfolded at 8 M urea for 24 h, then diluted 10-fold to a constant final concentration of 10–7 M in solution containing urea at various concentrations and incubated for 48 h at 25°C before measuring the fluorescence intensity or the ellipticity. For each experiment, a series of samples containing only urea at various concentrations in 50 mM Tris-HCl pH 7.4 was used as baseline controls.
Fluorescence measurements
All fluorescence measurements were carried out using a Perkin-Elmer LS5B spectrofluorometer, with a 1 × 1 cm cell thermostated at 25°C. Emission spectra were acquired between 310 and 410 nm upon excitation at 295 nm (bandwidth 5 nm). The emission bandwidth was set according to the protein concentration. When working at a constant emission wavelength, fluorescence intensity was recorded for 1 min with a sampling period and an integration time of 1 s and then averaged.
Circular dichroism measurements
All CD measurements were acquired with a CD6 spectropolarimeter from Jobin-Yvon. The far UV CD spectra were recorded in a 0.01 cm path length cell to minimize the buffer contribution, with a step of 0.5 nm and an integration time of 1 s. Five successive scans were averaged. For unfolding transitions, the ellipticity was recorded at 225 nm because of the high absorption of urea at lower wavelengths. Standard cells with path lengths of 0.5 cm and 0.2 cm were used for the series at protein concentrations of 10–6 and 4.10–6 M, respectively. Ellipticity was measured for 1 min with a sampling period and time constant of 1 s. The final ellipticity was calculated by averaging the 60 recorded data values.
Data analysis
Nonlinear least square fittings of the equilibrium transitions were achieved using equations derived from three different models: the 2-state dissociation equilibrium of a dimer into monomers; the 3-state double equilibrium coupling the dissociation process to the isomerization of the monomeric intermediate state; and the 3-state double equilibrium in which isomerization occurs in the dimeric state.
The corresponding equations have been established as follows. The signal S(C) (fluorescence intensity or maximum emission wavelength, ellipticity) measured at a given denaturant concentration C results from the linear combination of the individual contributions of all the species in equilibrium (2 or 3 species):
 |
Si and fi are the specific signal and the fraction of the species i, respectively. The nonhorizontality of the signal baselines at low (native state) and high (denatured state) denaturant concentrations is taken into account as a linear dependence upon denaturant concentration with the slope coefficients, positive or negative, αn and αu respectively:
 |
 |
Sn,0 and Su,0 are the specific signals of the native and denatured species extrapolated at 0 concentration of denaturant.
The dependence on free energy for each individual equilibrium ΔG is supposed to vary linearly with the denaturant concentration:
 |
ΔG0 corresponds to the free energy of the individual equilibrium in the absence of denaturant.
2-state dissociation process:
 |
The signal at a given concentration C of denaturant is given by equation 1:
 |
 |
(N2)0 is the total protein concentration expressed in terms of dimer.
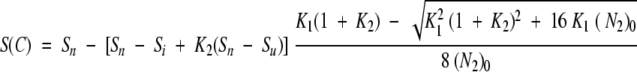
3-state dissociation process with dimeric intermediate:
 |
The signal at a given concentration C of denaturant is given by equation 2:
 |
 |
(N2)0 is the total protein concentration expressed in terms of dimer.
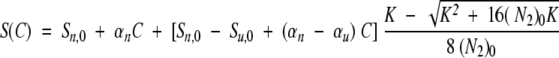
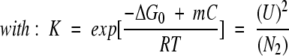
3-state dissociation process with monomeric intermediate:
 |
The signal at a given concentration C of denaturant is given by equation 3:
 |
 |
(N2)0 is the total protein concentration expressed in terms of dimer.
Sequence comparison and molecular modeling
Protein sequence database searches were performed with the PSI-BLAST version 2.0.5 program (Altschul et al. 1997) with default parameters. Pairwise and multiple alignments were confirmed by hydrophobic cluster analysis as previously described (Callebaut et al. 1997), in order to delineate structurally conserved regions along the amino acid sequences. Alignment refinement was subsequently performed using the program TITO (Labesse and Mornon 1998) where the TMPKec and TMPKy were used as templates (Lavie et al. 1998a, b). TMPKmt secondary structures (α-helix, β-strand) were assigned during TITO processing and the secondary structure derived by homology for TMPKmt were used as additional restraints in the following modeling steps. Three-dimensional models were built using the TMPKec and TMPKy as combined templates in MODELLER 4.0 (Sali and Blundell 1993) and assessed using Verify3D (Eisenberg et al. 1997). These three-dimensional structures were visualized on a UNIX workstation using XmMol (Tuffery 1995).
Synthesis of 2N-acetyl-5-methyl-2′-deoxyisocytidine 5′-monophosphate and of 5-methyl-2′-deoxyisocytidine 5′-monophosphate
5-methyl-2′-deoxyisocytidine, synthesised from 2,5′-anhydrothymidine according to Jurczyk et al. (1998), was converted into 2N-acetyl-5-methyl-2′-deoxyisocytidine by peracetylation followed by selective saponification (Gait 1984). 5′-Dimethoxytritylation of the N-protected nucleoside, followed by 3′-acetylation and subsequent 5′-deprotection under acidic conditions afforded 3′-O,2N-diacetyl-5-methyl-2′-deoxyisocytidine. Phosphorylation according to classical procedure (Tener 1961) followed by deprotection under mild basic conditions (2% sodium methylate in methanol) afforded 2N-acetyl-5-methyl-2′-deoxyisocytidine 5′-monophosphate. Complete deprotection by heating at 55°C overnight yielded 5-methyl-2′-deoxyisocytidine 5′-monophosphate. Both nucleotides were purified by reverse phase HPLC (C18 column, gradient of acetonitrile in 10 mM TEAA buffer) and isolated as sodium salt by passing through a Dowex 50WX8 column. Their structures were confirmed by NMR using a 300-MHz Bruker spectrometer. 2N-Acetyl-5-methyl-2′-deoxyisocytidine 5′-monophosphate as triethylammonium salt 1H (D2O): δ 1.98 (s, 3H, CH3, J = 0.8 Hz); 2.45 (m, 2H, H2′ and H2"); 4.03 (s, 3H, CH3); 4.11 (m, 2H, H5′ and H5"); 4.23 (m, 1H, H4′); 4.60 (m, 1H, H3′); 6.36 (t, 1H, H1′, J = 6.5 Hz); 7.96 (s, 1H, H6, J = 0.9 Hz). 13C: δ 13.50 (CH3); 40. 21(C2′); 56.87 (CH3); 64.97 and 65.03 (C5′); 71.52 (C3′); 86.84 and 86.95 (C4′); 87.60 (C1′); 117.48 (C5); 137.23 (C6); 157.17 (C2 and CO); 175.95 (C4). 31P: δ 0.81 and 5-Methyl-2′-deoxyisocytidine 5′-monophosphate as sodium salt 1H (D2O): δ 1.94 (d, 3H, CH3, J = 1 Hz); 2.38 (m, 2H, H2′ and H2"); 4.06 (m, 2H, H5′ and H5"); 4.18 (m, 1H, H4′); 4.60 (m, 1H, H3′); 6.37 (t, 1H, H1′, J = 7.2 Hz); 7.81 (d, 1H, H6, J = 1 Hz). 13C: δ 13.43 (CH3); 39.45 (C2′); 63.91 (C5′); 70.23 (C3′); 85.98 and 86.08 (C4′); 86.67 (C1′); 114.47 (C5); 133.46 (C6); 153.96 (C2); 170.18 (C4). 31P: δ 1.73. Mass spectrometry by ESI-MS confirmed the presence of M = 321 and M +Na +K for 5-methyl-2′-deoxyisocytidine 5′-monophosphate.
Other analytical procedures
Protein concentration was measured according to Bradford (1976), using a Bio-Rad kit or by amino-acid analysis on a Beckman system 6300 high-performance analyzer after 6 N HCl hydrolysis for 22 h at 110°C. SDS-PAGE was performed as described by Laemmli (1970).
Acknowledgments
We are grateful to K. Eiglmeier and S. T. Cole for the kind gift of cosmids. M. Goldberg for equilibrium sedimentation experiments, P. Christova for differential scanning calorimetry, A. Namane for electrospray ionisation spectrometry, O. Barzu for support and fruitful comments, and G. Bentley and S. Michelson for constructive criticism.
This work was supported by grants from the Institut Pasteur, the Institut National de la Santé et de la Recherche Médicale (U414), the Centre National de la Recherche Scientifique (URA 2185 and UMR 5048), and from GIP-HMR.
The publication costs of this article were defrayed in part by payment of page charges. This article must therefore be hereby marked "advertisement" in accordance with 18 USC section 1734 solely to indicate this fact.
Abbreviations
TMPK, thymidylate kinase
TMPKec, thymidylate kinase from E. coli
TMPKmt, thymidylate kinase from M. tuberculosis
TMPKy, thymidylate kinase from yeast
NMPK, nucleoside monophosphate kinase
AZT-MP, 3′-azido-3′-deoxythymidine monophosphate
Article and publication are at www.proteinscience.org/cgi/doi/10.1110/ps.45701.
References
- Altschul, S.F., Madden, T.L., Schäffer, A.A., Zhang, J., Zhang, Z., Miller, W. and Lipman, D.J. 1997. Gapped BLAST and PSI-BLAST: a new generation of protein database search programs. Nucleic Acids Res. 25 3389–3402. [DOI] [PMC free article] [PubMed] [Google Scholar]
- Barry, C.E.3rd and Mdluli, K. 1996. Drug sensitivity and environmental adaptation of mycobacterial cell wall components. Trends Microbiol. 4 275–281. [DOI] [PubMed] [Google Scholar]
- Blondin, C., Serina, L., Wiesmuller, L., Gilles, A.-M. and Barzu, O. 1994. Improved spectrophotometric assay of nucleoside monophosphate kinase activity using the pyruvate kinase/lactate dehydrogenase coupling system. Anal. Biochem., 220 219–221. [DOI] [PubMed] [Google Scholar]
- Bradford, M.M. 1976. A rapid and sensitive method for the quantitation of microgram quantities of protein utilizing the principle of protein-dye-binding. Anal. Biochem. 72 248–254. [DOI] [PubMed] [Google Scholar]
- Bucurenci, N., Sakamoto, H., Briozzo, P., Palidroba, N., Serina, L., Sarfati, R.S., Labesse, G., Briand, G., Danchin, A., Barzu, O., et al. 1996. CMP kinase from Escherishia coli is structurally related to other nucleoside monophosphate kinases. J. Biol. Chem. 271 2856–2862. [DOI] [PubMed] [Google Scholar]
- Callebaut, I., Labesse, G., Durand, P., Poupon, A., Canard, L., Chomilier, J., Henrissat, B. and Mornon, J.-P. 1997. Deciphering protein sequence information through Hydrophobic Cluster Analysis (HCA): current status and perspectives. Cell. Mol. Life Sci. 53 621–645. [DOI] [PMC free article] [PubMed] [Google Scholar]
- Carret, C., Delbecq, S., Labesse, G., Carcy, B., Precigout, E., Moubri, K., Schetters, T.P.M. and Gorenflot, A. 1999. A characterization and molecular cloning of an adenosine kinase from Babesia canis rossi. Eur. J. Biochem. 265 1015–1021. [DOI] [PubMed] [Google Scholar]
- Chenal-Francisque, V., Tourneux, L., Carniel, E., Christova, P., Li de la Sierra, I., Barzu, O. and Gilles, A.-M. 1999. The highly similar TMP kinases of Yersinia pestis and Escherishia coli differ markedly in their AZTMP phosphorylating activity. Eur. J. Biochem. 265 112–119. [DOI] [PubMed] [Google Scholar]
- Clark, A.C., Raso, S.W., Sinclair, J.F., Ziegler, M.M., Chafotte, A.F. and Baldwin, T.O. 1997. Kinetic mechanism of luciferase subunit folding and assembly. Biochemistry 36 1891–1899. [DOI] [PubMed] [Google Scholar]
- Clemens, D.L., Lee, B.-Y., and Horwitz, M.A. 1995. Purification, characterization, and genetic analysis of Mycobacterium tuberculosis urease, a potentially critical determinant of host-pathogen interaction. J. Bacteriol. 177 5644–5652. [DOI] [PMC free article] [PubMed] [Google Scholar]
- Cole, S.T. 1994. Mycobacterium tuberculosis: drug-resistance mechanisms. Trends Microbiol. 2 411–415. [DOI] [PubMed] [Google Scholar]
- Eisenberg, D., Luthy, R. and Bowie, J.U. 1997. VERIFY3D: assessment of protein models with three-dimensional profiles. Methods Enzymol. 277 396–404. [DOI] [PubMed] [Google Scholar]
- Gait, M.J. 1984. Oligonucleotide synthesis: A Pratical Approach. (D. Rickwood, B.D. Hames, eds.) IRL Press, Oxford, England.
- Jong, A.Y.S., Kuo, C.-L. and Campbell, J.L. 1984. The cdc8 gene of yeast encodes thymidylate kinase. J. Biol. Chem. 259 11052–11059. [PubMed] [Google Scholar]
- Jurczyk, S.C., Kodra, J.T., Rozell, J.D., Benner, S. and Battersby, T.R. 1998. Synthesis of oligonucleotides containing 2′-deoxyguanosine and 2′-deoxy-5-methylisocytidine using phosphoramidite chemistry. Helv. Chem. Acta 81 793–811. [Google Scholar]
- Labesse, G. and Mornon, J.-P. 1998. A Tool for Incremental Threading Optimization (TITO) to help alignment and modelling of remote homologs. Bioinformatic 14 206–211. [DOI] [PubMed] [Google Scholar]
- Laemmli, U.K. 1970. Cleavage of structural proteins during the assembly of the head of bacteriophage T4. Nature 227 680–685. [DOI] [PubMed] [Google Scholar]
- Lavie, A., Konrad, M., Brundiers, R., Goody, R.S., Schlichting, I. and Reinstein, J. 1998a. Crystal structure of yeast thymidylate kinase complexed with the bisubstrate inhibitor P1–(5′-adenosyl) P5–(5′-thymidyl) pentaphosphate (TP5A) at 2.0 Å resolution: implications for catalysis and AZTactivation. Biochemistry 37 3677–3686. [DOI] [PubMed] [Google Scholar]
- Lavie, A., Ostermann, N., Brundiers, R., Goody, R.S., Reinstein, J., Konrad, M. and Schlichting, I. 1998b. Structural basis for efficient phosphorylation of 3′-azidothymidine monophosphate by Escherichia coli thymidylate kinase. Proc. Natl. Acad. Sci. 95 14045–14050. [DOI] [PMC free article] [PubMed] [Google Scholar]
- Lavie, A., Vetter, I.R., Konrad, M., Goody, R.S., Reinstein, J. and Schlichting, I. 1997. Structure of thymidylate kinase reveals the cause behind the limiting step in AZT. Nat. Struct. Biol. 4 601–604. [DOI] [PubMed] [Google Scholar]
- Li, R., Sirawaraporn, R., Chitnumsub, P., Sirawaraporn, W., Wooden, J., Athappilly, F., Turley, S. and Hol, W.G.J. 2000. Three-dimensional structure of M. tuberculosis dihydrofolate reductase reveals opportunities for the design of novel tuberculosis drugs. J. Mol. Biol. 295 307–323. [DOI] [PubMed] [Google Scholar]
- Mahan, M.J., Slauch, J.M. and Mekalanos, J.J. 1993. Selection of bacterial virulence genes that are specifically induced in host tissues. Science 259 686–688. [DOI] [PubMed] [Google Scholar]
- Moore, J.D., Lamb, H.K., Garbe, T., Servos, S., Dougan, G., Charles, I.G., and Hawkins, A.R. 1992. Inducible overproduction of the Aspergillus nidulans pentafunctional AROM protein and the type-I and -II 3-dehydroquinases from Salmonella typhi and Mycobacterium tuberculosis. Biochem. J. 287 173–181. [DOI] [PMC free article] [PubMed] [Google Scholar]
- Moors, M.A. and Portnoy, D.A. 1995. Identification of bacterial genes that contribute to survival and growth in an intracellular environment. Trends Microbiol. 3 83–85. [DOI] [PubMed] [Google Scholar]
- Munier-Lehmann, H., Burlacu-Miron, S., Craescu, C.T., Mantsch, H.H., Schultz, C.P. 1999. A new subfamily of short bacterial adenylate kinases with the Mycobacterium tuberculosis enzyme as model: A predictive and experimental study. Proteins 36 238–248. [PubMed] [Google Scholar]
- Raleigh, E.A., Murray, N.E., Revel, H., Blumenthal, R.M., Westaway, D., Reith, A.D., Rigby, P.W.J., Elhai, J. and Hanahan, D. 1988. McrA and McrB restriction phenotypes of some E. coli strains and implications for gene cloning. Nucleic Acids Res. 16 1563–1575. [DOI] [PMC free article] [PubMed] [Google Scholar]
- Sali, A. and Blundell, T.L. 1993. Comparative protein modelling by satisfaction of spatial restraints. J. Mol. Biol. 234 779–815. [DOI] [PubMed] [Google Scholar]
- Sambrook, J., Fritsch, E.F. and Maniatis, T. 1989. Molecular cloning: A laboratory manual. Cold Spring Harbor Laboratory Press, Cold Spring Harbor, NY.
- Sanger, F., Nicklen, S. and Coulson, A.R. 1977. DNA sequencing with chain terminating inhibitors. Proc. Natl. Acad. Sci. 74 5463–5467. [DOI] [PMC free article] [PubMed] [Google Scholar]
- Schulz, G.E., Müller, C.W. and Diederichs, K. 1990. Induced-fit movements in adenylate kinases. J. Mol. Biol. 213 627–630. [DOI] [PubMed] [Google Scholar]
- Sclafani, R.A. and Fangman, W.L. 1984. Yeast gene cdc8 encodes thymidylate kinase and is complemented by herpes thymidine kinase gene TK. Proc. Natl. Acad. Sci. 81 5821–5825. [DOI] [PMC free article] [PubMed] [Google Scholar]
- Serina, L., Blondin, C., Krin, E., Sismeiro, O., Danchin, A., Sakamoto, H., Gilles, A.-M. and Barzu, O. 1995. Escherichia coli UMP-kinase, a member of the aspartokinase family, is a hexamer regulated by guanine nucleotides and UTP. Biochemistry 34 5066–5074. [DOI] [PubMed] [Google Scholar]
- Sippl, M.J. and Weitckus, S. 1992. Detection of native-like models for amino acid sequences of unknown three-dimensional structure in a data base of known protein conformations. Proteins 13 258–271. [DOI] [PubMed] [Google Scholar]
- Tener, G.M. 1961. 2-Cyanoethyl phosphate and its use in synthesis of phosphate esters. J. Am. Chem. Soc. 83 159–168. [Google Scholar]
- Tuffery, P. 1995. XmMol: An X11 and motif program for macromolecular visualization and modeling. J. Mol. Graph. 13 67–72. [DOI] [PubMed] [Google Scholar]
- Valdivia, R.H. and Falkow, S. 1997. Fluorescence-based isolation of bacterial genes expressed within host cells. Science 277 2007–2011. [DOI] [PubMed] [Google Scholar]
- White, J.H.M., Green, S.R., Barker, D.G., Dumas, L.B. and Johnston, L.H. 1987. The cdc8 transcript is cell cycle regulated in yeast and is expressed coordinately with cdc9 and cdc21 at a point preceding histone transcription. Exp. Cell Research 171 223–231. [DOI] [PubMed] [Google Scholar]
- Wlodawer, A. and Vondrasek, J. 1998. Inhibitors of HIV-1 protease: a major success of structure-assisted drug design. Annu. Rev. Biophys. Biomol. Struct. 27 249–284. [DOI] [PubMed] [Google Scholar]
- World Health Organization. 1996. The world health report 1996: Fightingdisease, fostering development. pp. 15–29, World Health Organization, Geneva, Switzerland.
- Zamyatnin, A.A. 1984. Amino acid, peptide, and protein volume in solution. Annu. Rev. Biophys. Bioeng. 13 145–165. [DOI] [PubMed] [Google Scholar]