

Abstract
Translation initiation factor 1A (aIF-1A) from the archaeon Methanococcus jannaschii was expressed in Escherichia coli, purified, and characterized in terms of its structure and dynamics using multidimensional NMR methods. The protein was found to be a member of the OB-fold family of RNA-associated proteins, containing a barrel of five beta-strands, a feature that is shared with the homologous eukaryotic translation initiation factor 1A (eIF-1A), as well as the prokaryotic translation initiation factor IF1. External to the β barrel, aIF-1A contains an α-helix at its C-terminal and a flexible loop at its N-terminal, features that are qualitatively similar to those found in eIF-1A, but not present in prokaryotic IF1. The structural model of aIF-1A, when used in combination with primary sequence information for aIF-1A in divergent species, permitted the most-conserved residues on the protein surface to be identified, including the most likely candidates for direct interaction with the 16S ribosomal RNA and other components of the translational apparatus. Several of the conserved surface residues appear to be unique to the archaea. Nitrogen-15 relaxation and amide exchange rate data were used to characterize the internal motions within aIF-1A, providing evidence that the protein surfaces that are most likely to participate in intermolecular interactions are relatively flexible. A model is proposed, suggesting some specific interactions that may occur between aIF-1A and the small subunit of the archaeal ribosome.
Keywords: Translation initiation factor, protein structure, NMR, aIF-1A, eIF-1A, IF-1
The process by which the ribosome, transfer RNAs, initiation factors, and elongation factors work together to synthesize a protein encoded by a messenger RNA is of central importance within all of the diverse forms of life, including the prokaryotes, eukaryotes, and archaea. In humans and other eukaryotes, translation is almost always initiated at the AUG triplet closest to the 5′ end of the messenger RNA, whereas in prokaryotes, translation usually begins at an AUG triplet that closely follows the Shine-Dalgarno sequence. In each case, recognition and initiation at the correct AUG start codon requires the participation of several initiation factor (IF) proteins.
With the completion of the full genome sequencing of the archaeon Methanococcus jannaschii (Bult et al. 1996), it has become apparent that the archaea are indeed a third domain of life, distinct from the eukaryotes and prokaryotes. Although the initiation of translation is not as well characterized in archaea as in the prokaryotes and eukaryotes, it has recently become apparent that the archaea contain an intriguing mix of prokaryotic and eukaryotic features (Bult et al. 1996; Bell and Jackson 1998; Saito and Tomita 1999). As in the prokaryotes, the messenger RNAs of archaea contain a Shine-Dalgarno sequence (Saito and Tomita 1999), are often polycistronic, and do not have the eukaryotic type of capped structure at the 5′ end (Dennis 1997). However, comparison of the proteins present in widely divergent species has revealed that the archaea contain homologs of most of the eukaryotic translation initiation factors, providing strong evidence that the archaea closely resemble the eukaryotes in many aspects of translation initiation. For example, the archaea contain well-conserved homologs of eIF-2, eIF2B, eIF-4A, eIF4F, and eIF6. The archaea do not contain a homolog of the eukaryotic cap-binding protein eIF-4E, which is understandable, because they do not appear to have capped messenger RNAs.
The subject of the present work, archaeal translation initiation factor 1A (aIF-1A), has significant amino acid sequence homology with the eukaryotic translation initiation factor eIF-1A (Fig. 1 ▶); it is likely that these two proteins have similar functional roles in their respective organisms. eIF-1A has been shown recently to be among the essential factors for start codon recognition and initiation, along with eIF-1, eIF-2, eIF-3, eIF-4A, eIF-4B, and eIF-4F (Pestova et al. 1998), and its structure has been reported recently (Battiste et al. 2000). Although the precise role of eIF-1A (or aIF-1A) in translation initiation is still not fully understood, it has been shown recently that in its absence, eukaryotic ribosomes cannot properly scan the mRNA and stall near the 5′ mRNA cap (Pestova et al. 1998). eIF-1A has been shown to be an essential gene in yeast (Wei et al. 1995), and Chaudhuri et al. (1997, 1999) have shown that eIF-1A catalyzes the transfer of the initiator tRNA-eIF2-GTP ternary complex to the ribosomal small (40S) subunit.
Fig. 1.
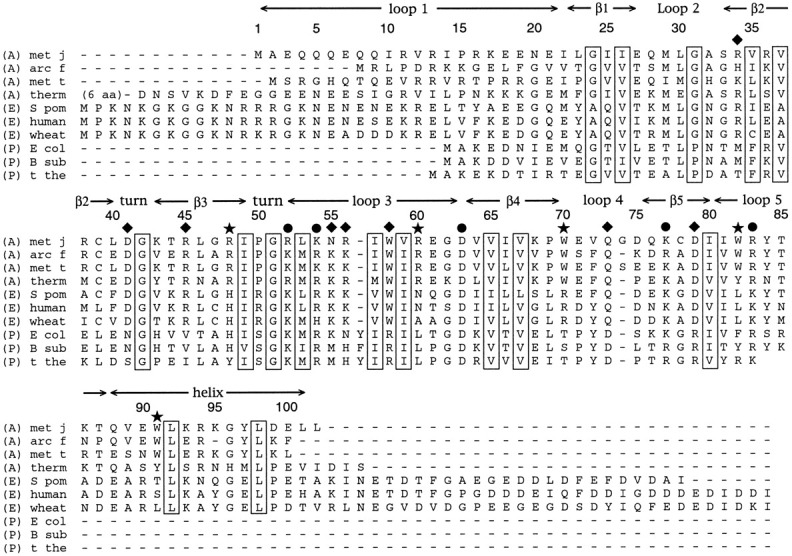
An alignment of the amino acid sequences of the aIF-1A protein from four species of archaea (A), eIF-1A from three species of eukaryotes (E), and IF1 from three species of prokaryotes (P), shown using the one-letter amino acid code. Representative species of archaea are Methanococcus jannaschii (met j), Archaeoglobus fulgidus (arc f), Methanobacterium thermoautotrophicum (met t), Thermoplasma acidophilum (therm), eukaryotes are Saccromyces pombe (S pom), Homo sapiens (human) and Triticum aestivum (wheat); prokaryotes are Escherichia coli (E col), Bacillus subtilis (B sub) and Thermus thermophilus (t the). Residues that are conserved for structural purposes, such as hydrophobic residues in the protein core and glycine and proline residues in turns, are boxed. Surface residues that are universally well conserved among the archaea, eukaryotes, and prokaryotes are identified by circles. Surface residues that usually have similar identities in the archaea and eukaryotes, but differ in the prokaryotes, are identified by diamonds. Surface residues that are well conserved in the archaea, with identities that are distinct from the eukaryotes and prokaryotes, are identified by stars. Although only 10 sequences are shown in the figure, a substantially larger set of sequences was compared when making the decision as to which residues are relatively well conserved.
The present work describes the results of NMR experiments used to characterize the structure and dynamics of aIF-1A, thus providing additional information that can contribute toward a more complete understanding of the process of translation and its initiation. These results are timely in that they add to the rapidly growing list of structurally characterized translation initiation factors, which includes IF1 (Sette et al. 1997), a domain of IF2 (Meunier et al. 2000), IF3 (Biou et al. 1995), eIF-4E (Marcotrigiano et al. 1997; Matsuo et al. 1997), eIF-1 (Fletcher et al. 1999); eIF-4A (Caruthers et al. 2000), a conserved domain within eIF-4G (Marcotrigiano et al. 2001), aIF-5A (Kim et al. 1998), eIF-6 and aIF-6 (Groft et al. 2000). The present work also complements the recently reported high-resolution structures of the ribosome subunits of the archaeon Haloarcula marismortui (Ban et al. 2000) and the prokaryote Thermus thermophilus (Wimberly et al. 2000; Ogle et al. 2001), as well as the structures of IF1 and IF3 in complex with the prokaryotic 30S subunit (McCutcheon et al. 1999; Carter et al. 2001). The availability of a structural model for the initiation factor aIF-1A will aid in determining its mechanism of interaction with the ribosome surface in archaea.
Results
The structure of the full-length (102 amino acid) translation initiation factor aIF-1A from the archaeon M. jannaschii was determined using multidimensional NMR methods. The NMR spectra were of sufficient quality for structure analysis (as indicated by the 15N-1H HSQC spectrum in Fig. 2 ▶); however, it is noted that under some conditions, the resonances were not as sharp as is ideally observed for an 11.5 kD protein. The slight broadness of the resonances was apparent in the one-dimensional proton spectrum and may be a result of a tendency toward aggregation. After experimenting with numerous conditions of salt, buffer, pH, and temperature, it was concluded that a protein concentration of 1 mM, temperature in the range of 35°C to 45°C, 300 mM NaCl, and pH 6 resulted in optimum quality NMR spectra. Resonance assignments (Table S1 of supplemental material) were obtained using what are now standard triple-resonance methods applied to 13C and 15N enriched protein samples (Table 1). In addition, NMR assignment ambiguities were removed by preparing several samples containing specific 15N-labeled amino acids. Backbone resonances were observed and assigned for all residues except for M1 and A2 at the N-terminal, L101 and L102 at the C-terminal, and loop residues A32 and K86, in which the amide protons presumably exchange too rapidly with the solvent to be observed. The protein structure was determined from structural constraints derived from NMR data, specifically, distance constraints derived from NOE data, and torsion angle and hydrogen bond constraints for the regions identified as having regular β-sheet or helical secondary structure.
Fig. 2.

A 15N-1H-correlated HSQC spectrum of the aIF-1A protein from M. jannaschii obtained at 35°C, using presaturation for solvent H2O suppression, so that the amide protons that exchange relatively rapidly with the solvent are attenuated. Assignments for 84 of the best-resolved cross peaks are labeled in the figure. NMR assignments were obtained for 96 of the 102 amino acids, and are summarized in Table S1 of the supplemental material.
Table 1.
Summary of NMR data acquired for the purpose of spectrum assignment, structure determination, and dynamics measurements within the aIF-1A protein
| Spectrum | Sample |
| 2D NOESY | unlabeled, H2O solvent, D2O solvent, mix = 50 ms, 200 ms |
| 2D 2QF-COSY | unlabeled, H2O solvent, D2O solvent |
| 2D TOCSY | unlabeled, H2O solvent, D2O solvent, mix = 60 ms |
| 2D 15N-1H HSQC | uniform 15N-labeled |
| 2D 15N-1H HSQC | 15N glycine and serine labeled |
| 2D 15N-1H HSQC | 15N glycine, serine, cysteine and tryptophan labeled |
| 2D 15N-1H HSQC | 15N lysine labeled |
| 2D 15N-1H HSQC | 15N threonine labeled |
| 3D 15N-edited HSQC-NOESY | uniform 15N-labeled, mix = 50 ms, 160 ms |
| 3D 15N-edited HSQC-TOCSY | uniform 15N-labeled, mix = 50 ms |
| 3D 13C-edited HSQC-NOESY | uniform 13C and 15N-labeled, mix = 120 ms |
| 3D 13C-edited HCCH-TOCSY | uniform 13C and 15N-labeled, mix = 24 ms |
| 3D HNCA | uniform 13C and 15N-labeled |
| 3D HNCO | uniform 13C and 15N-labeled |
| 3D HN(CO)CA | uniform 13C and 15N-labeled |
| 3D HN(CO)CACB | uniform 13C and 15N-labeled |
| 3D NHCACB | uniform 13C and 15N-labeled |
| 3D HCACO | uniform 13C and 15N-labeled |
| 15N NOE, R1 and R2 relaxation | uniform 15N-labeled |
| amide proton exchange rates | uniform 15N-labeled |
NMR data show that the core of the aIF-1A protein (amino acids 21–81) consists of a closed barrel of five β-strands, in a Greek key type of arrangement (Fig. 3 ▶). Within the β-barrel, strands β1 and β2 are connected by a short loop, and β2 and β3 are connected by a compact turn. Strands β3 and β4 are joined by a longer loop consisting of residues 50 to 62; this loop contains a short helical structure, with conserved hydrophobic residues L53, I57, and V59 contributing to the hydrophobic core of the protein. The 14 amino acids nearest the C-terminal of aIF-1A form an α-helix of almost four turns. The nine amino acids nearest to the N-terminal of the protein are disordered or flexible, whereas residues 10 through 21 (immediately preceding the first strand of the β-barrel) form an ordered loop structure (loop 1). The C-terminal helix is located near loop 1 and a hydrophobic face of the β-barrel, with the side chains of amino acids V12, L23, I25, V64, I66, V89, and W91 being relatively near each other, as indicated by NOE cross peaks, and forming a small hydrophobic core external to the β-barrel.
Fig. 3.

A diagram showing the β-sheet structure within the five-stranded β-barrel of the aIF-1A protein, as derived from NMR data. Strand β5 appears twice in the figure to show its antiparallel arrangement, relative to strand β4, and parallel arrangement relative to strand β3. Pairs of protons for which interstrand NOEs are observed are indicated by thin lines, and interstrand hydrogen bonds are indicated by dotted lines.
All regions of the aIF-1A protein structure are not equally well defined by the NMR-derived structural constraints, as indicated in a plot of the root mean square deviation for the coordinates of the backbone-heavy atoms for the aIF-1A protein, calculated from 12 structures that satisfy the NMR constraints equally well (Figs. 4,5 ▶ ▶). The five-stranded β-barrel contains the highest density of long-range NOE distance constraints, and is therefore the best-defined structural feature. The N-terminal 10 amino acids are the least well-defined region of the protein structure.
Fig. 4.

A plot of the root mean square deviation (RMSD) for the coordinates of the backbone heavy atoms for the aIF-1A protein vs. residue number, calculated using 12 structures that satisfy the NMR-derived structural constraints, which are a fair representation of the full range of structures that are consistent with NMR data. The RMSD values were calculated using a set of 12 structures that were superimposed by minimizing the differences in the coordinates of the backbone atoms of residues 9 through 102. The figure shows that the β-barrel is quite well-defined by NMR data (RMSD ∼1 Å), and the loops connecting the strands of the β-barrel are moderately well defined (RMSD ∼2 Å), whereas the positions of the 10 residues nearest the N-terminal and the two residues nearest the C-terminal are not well determined (RMSD > 5 Å). Because all parts of the structure are not equally well determined, the RMSD statistics can vary significantly, depending on which parts of the structure are included in the calculation. If the structures are superimposed using only residues 22 to 81, the RMSD for the β-strand residues is 0.47 Å (see Fig. 5 ▶ and Table 2).
Fig. 5.
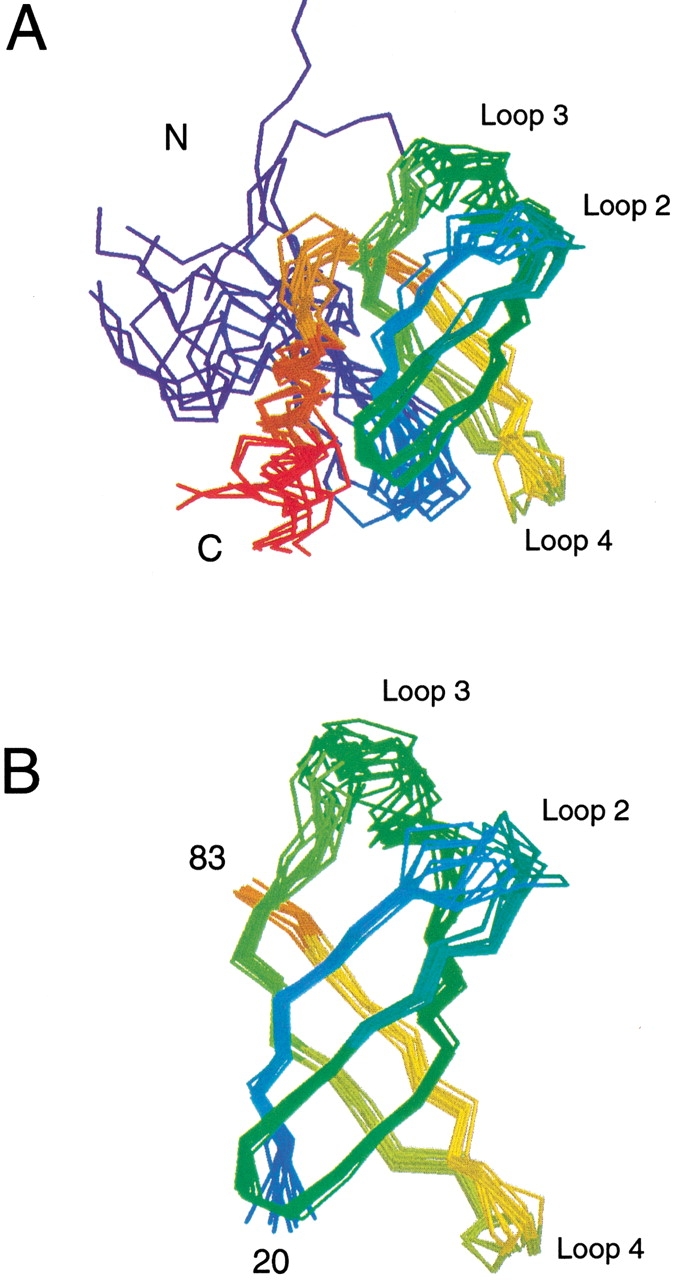
A superposition of the backbones of 12 low-energy structures of aIF-1A that are equally consistent with the NMR data, which are color-ramped from blue at the N-terminal to red at the C-terminal of the protein. The 12 models are a fair representation of the full range of structures that are consistent with the NMR-derived constraints. (A) The superposition of the 12 models is performed by minimizing the differences in the coordinates of residues 12 to 102; all 102 residues of the protein are shown. (B) The superposition of the models is performed by minimizing the differences in the coordinates of residues 20 to 83; only residues 20 to 83 are shown.
It should be noted that the number of long-range NOE-derived distance constraints (between residues that are five or more apart in the primary sequence) is not as great as is sometimes found in NMR investigations of β-barrel proteins. Identification of unambiguous long-range NOEs within the core of the β-barrel was found to be quite difficult, because the interior of the barrel consists almost entirely of isoleucine, leucine, and valine side chains, with many of the protons and carbon nuclei resonating within a very narrow chemical shift range (the β-barrel does not contain any buried aromatic residues that can usually be counted on to provide some dispersion in chemical shifts and long-range NOEs). Furthermore, the resonances of some of the side chains within the β-barrel (particularly in strand β4) were broad in NOE spectra and unobserved in through-bond correlated spectra, most likely because of conformational exchange. Consequently, NOEs were not assigned unambiguously for all of the possible isoleucine, leucine, and valine side-chain protons within the core of the β-barrel. The backbone of the β-barrel is, however, quite well defined by NOEs involving the amide, α, and β protons of the residues within the β-strands, and the assigned long-range NOEs establish clearly that the five strands of the β-sheet form a closed barrel (see Fig. 3 ▶), which provides a strict constraint on the protein structure. The NOE information is sufficient to distinguish the surface residues from the core residues of the β-barrel and overall protein, indicated by the observation that these residues are consistently the same in the various calculated models. The locations of the side chains within the protein structure are thus well established; however, there is significant uncertainty in the precise conformations of many of the side chains (indicated by the statistics in Table 2). The helix at the C-terminal of the protein is well defined internally by medium-range NOEs, and its points of contact with the β-barrel and loop 1 are established by long-range NOEs from helix residues V89, W91, and L92; however, no long-range NOEs between the helix and the β-barrel were identified for helix residues 93 to 102. Consequently, there is a moderate amount of uncertainty in the position of the several residues closest to the extreme C-terminal of the protein (Fig. 5 ▶).
Table 2.
Summary of refinement and structural statistics for the aIF-1A protein a
| Intraresidue NOEs | 514 |
| Sequential NOEs (residue i to i + 1) | 282 |
| Medium range NOEs (i to i + 2, 3, 4) | 34 |
| Long range NOEs | 113 |
| Dihedral angle restrains (phi and psi) | 88 |
| Hydrogen bond restraints | 39 |
| Total structural restraints | 1070 |
| Number of unique starting structures for simulated annealing | 12 |
| Number of simulated annealing runs, differing in initial trajectories | 240 |
| Rmsd for backbone atoms, residues 1 to 102 | 3.45 Å |
| Rmsd for sidechains, residues 1 to 102 | 3.90 Å |
| Rmsd for backbone atoms, residues 9 to 100 | 1.94 Å |
| Rmsd for sidechains, residues 9 to 100 | 2.98 Å |
| Rmsd for backbone atoms, residues 22 to 81 | 0.91 Å |
| Rmsd for sidechains, residues 22 to 81 | 1.77 Å |
| Rmsd for backbone atoms, β-strand residues only | 0.47 Å |
| Average number of NOE violations > 0.2 Å (per structure) | 5.2 |
| Average number of NOE violations > 0.5 Å | 0.3 |
| Number of NOE violations > 0.6 Å | 0 |
| Average number of dihedral angle violations > 5° | 0.2 |
| Residues in most favored regions of Ramachandran plot | 74.2% |
| Residues in additional allowed regions of Ramachandran plot | 20.7% |
| Residues in generously allowed regions of Ramachandran plot | 5.1% |
| Side chains in favored regions of chi1-chi2 plots | 83.7% |
| Rmsd for covalent bonds | 0.0056 Å |
| Rmsd for covalent angles | 0.76° |
| Rmsd for improper angles | 0.69° |
a Statistics are derived from a set of 12 low-energy structures, a set that is representative of the range of structures that are consistent with the structural constraints. The values of the X-PLOR energy function, averaged for 12 low-energy structural models are Etotal = 462.3, Ebond = 56.6, Eangle = 281.5, Eimproper = 65.9, Evdw = 78.8, Ecdih = 35.6, Enoe = 100.4, scale(noe) = 100, scale(cdih) = 200. The set of 12 structural models contains 60 close contacts (< 2 Å), none of which are outside of a 6.0*RMSD range about the standard dictionary values. All covalent bonds and covalent angles lie within a 6.0*RMSD range about the standard dictionary values. Statistics from the Ramachandran plot are indicated in the table; a Ramachandran plot of the residues in the 12 low-energy structural models is included as a supplementary figure.
The connectivity of the β-strands within the barrel conforms to the oligomer-binding (OB) fold (Murzin 1993) and is similar to that found in the prokaryotic translation initiation factor 1 (IF-1) (Sette et al. 1997), as well as a number of other RNA-associated proteins (for review, see Draper 1999), including ribosomal protein S17 (Golden et al. 1993) and the β-barrel domain of ribosomal protein S1 (Bycroft et al. 1997). Similarity between IF-1 and eIF-1A was predicted by Kyrpides and Woese (1998), based on their observation of fairly subtle primary sequence similarities.
Amino acids are conserved within similarly structured proteins from widely divergent species for reasons related to either structure or function; residues within a protein core are often conserved for structural reasons, whereas conserved residues on a protein surface are often important for function. When the amino acid sequences of aIF-1A from several species are aligned (as in Fig. 1 ▶), and this alignment is compared with the structural model, it becomes possible to identify those amino acids that are most likely essential for either structural or functional purposes. Hydrophobic residues within the core of the protein, as well as conserved glycines and prolines in turns (Fig. 1 ▶, boxed residues) are likely to have essential structural roles. Well-conserved amino acids on the surface of the protein were also identified (Fig. 1 ▶); these residues are the most likely to make essential contacts with other RNA or protein components of the translational apparatus as part of the mechanism of initiation.
The most-conserved surface residues are clustered into two regions on the protein surface. Seven residues that are well conserved in the archaea (R52, K54, R56, W58, D63, W82, and R83) are located either within or spatially close to loop 3 of the protein, which connects strands β3 and β4 of the five-strand β-barrel, and forms the single mostconserved surface (Fig. 6 ▶). Residues R48, W70, K77, and D79 are relatively distant from loop 3 and form a second conserved region on the protein surface (Fig. 6 ▶). Interestingly, a large surface on the back face of the protein (as shown in Fig. 6B ▶) contains no well-conserved surface residues. Whereas this protein surface is primarily hydrophilic, the identities and charges of the hydrophilic residues are not conserved, suggesting that this back face of the protein remains solvent exposed when aIF-1A interacts with other RNA or protein components of the translational apparatus.
Fig. 6.
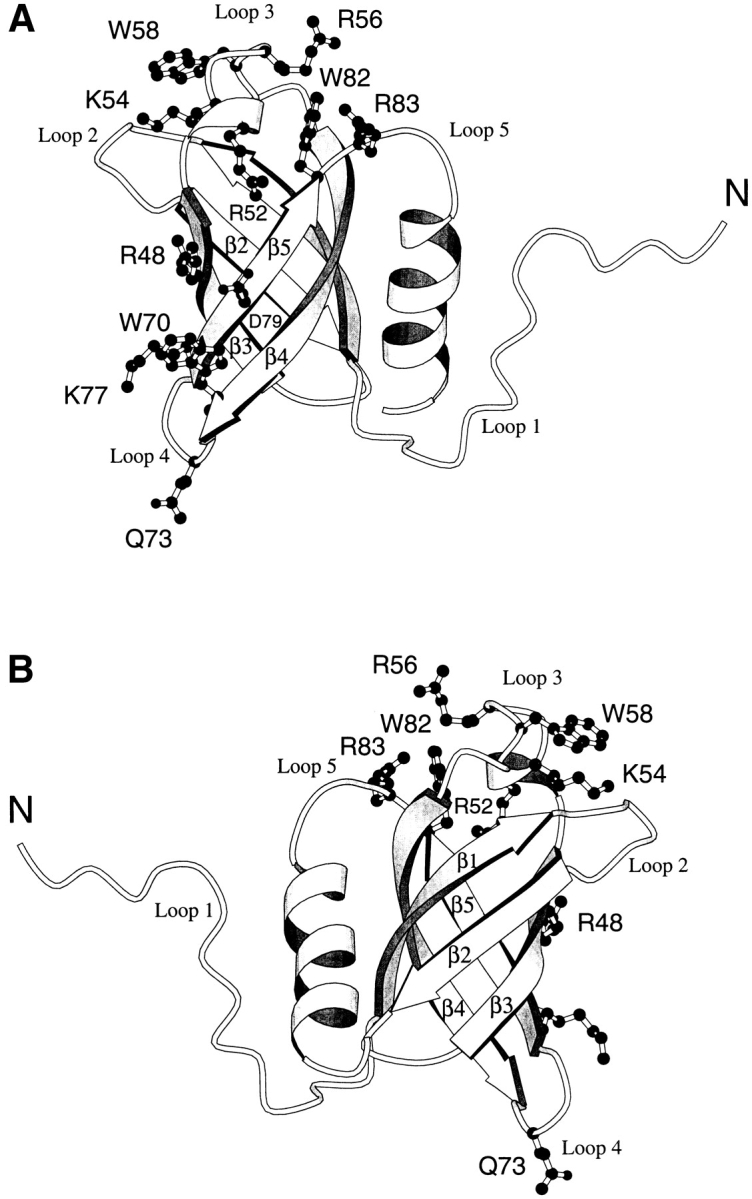
Ribbon diagrams of the protein aIF-1A, created using MOLSCRIPT (Kraulis 1991), with the relative positions of some of the most-conserved surface residues indicated. (A) Front view of the protein. (B) Back view of the protein. The conserved surface residues are concentrated in loop 3 and on the front surface of the protein, whereas the back surface of the protein is populated with unconserved hydrophilic residues. Conserved surface residues R52, K54, R56, W58, D63, and R83 are located within or near loop 3, a surface loop that connects strands β3 and β4. Residues R48, W70, K77, and D79 form a second conserved cluster on the protein surface. The helix at the C-terminal of the protein covers a conserved hydrophobic patch centered at residues L23, I25, V64, and I66 on the surface of the 5-stranded β-barrel. It should be noted that NMR data do not establish the exact conformations of the side chains. Hence, the purpose of this figure is to indicate the locations of those residues that are on the protein surface, rather than to indicate precise side-chain conformations.
Comparison of aIF-1A with eukaryotic eIF-1A and prokaryotic IF1
The alignment of IF1 and aIF-1A primary sequences (Fig. 1 ▶) shows that the relatively small (72 amino acid) prokaryotic IF1 contains significant homology with residues 14 to 85 of aIF-1A. The most obvious difference between the structures is that IF1 lacks the N-terminal loop and C-terminal helix present in aIF-1A (Fig. 7 ▶). The residues that are most conserved across the archaea and prokaryotes are the hydrophobic amino acids that form the internal core of the β-barrel (Fig. 1 ▶). Prokaryotic IF1 in most species has hydrophilic amino acids at positions 64 and 66 (using aIF-1A numbering; Fig. 1 ▶), whereas the proteins of archaea have hydrophobic residues at these positions, which makes sense because these residues participate in hydrophobic interactions with the C-terminal helix of aIF-1A, which is external to the β-barrel. In prokaryotic IF1, as in aIF-1A, many of the most-conserved surface residues occur in loop 3. In the recent crystal structure of IF1 in complex with the prokaryotic 30S ribosomal subunit (Carter et al. 2001), loop 3 residues were identified as making specific interactions with nucleotides of helix 44 and the 530 loop of the 16S RNA. Because of the density of conserved residues, loop 3 also appears to be a strong candidate for functional importance in aIF-1A.
Fig. 7.

Ribbon diagrams of the translation initiation factors IF1, aIF-1A, and eIF-1A. The ribbon diagrams were created using MOLSCRIPT (Kraulis 1991) and using coordinates from PDB entry 1AH9 for IF1 (Sette et al. 1997) and PDB entry 1D7Q for eIF-1A (Battiste et al. 2000). The coordinates for aIF-1A have been submitted to the Protein Data Bank and have been assigned PDB code 1JT8. All 71 residues are displayed for IF1; residues 7 to 102 are displayed for aIF-1 and residues 20 to 108 are displayed for eIF-1A.
The similarity between aIF-1A and eIF-1A is even more striking than the similarity between aIF-1A and IF1 (Fig. 7 ▶), perhaps an expected result given that the majority of eukaryotic translation initiation factors have homologs in archaea, suggesting substantial similarity in their translational mechanisms. The hydrophobic core residues, including those involved in the hydrophobic interaction between the C-terminal helix and the β-barrel, are conserved among the eukaryotes and archaea, as are a substantial fraction of the surface residues (Fig. 1 ▶). Surface amino acids R34, D41, R45, W58, Q73, and D79 are well conserved among the archaea and eukaryotes, whereas the corresponding positions are occupied by distinctly different types of residues in prokaryotes. By titrating eIF-1A with various fragments of RNA, Battiste et al. (2000) identified residues that are most likely to interact directly with RNA. Although these residues corresponded to a large fraction of the surface of eIF-1A, their greatest concentration is in loop 3, which is also the site of many conserved residues in aIF-1A. Despite their extensive similarities, there are some significant differences between archaeal aIF-1A and eukaryotic eIF-1A. For example, the aIF-1A protein lacks the flexible charged tail present at the C-terminal of eIF-1A. Residues 48 and 60 are nearly always arginines in the archaea but differ in the prokaryotes and eukaryotes. Residues 70, 82, and 90 are quite well conserved as tryptophans among the species of archaea, but tryptophans do not generally occupy these positions in the eukaryotes and prokaryotes. Surface residues 48, 60, 70, 82, and 90 are, therefore, the most likely to participate in interactions that are unique to the archaea.
Dynamic properties of aIF-1A in solution
In general, proteins are not rigid structures, but exist in equilibrium between a large number of possible conformations, with the population of each conformation being governed by its free energy. One area in which NMR spectroscopy has an advantage over X-ray crystallography as a method of structural analysis is in its ability to provide information regarding the dynamic features of a protein in solution. In the present study, two complementary NMR methods were used to investigate the dynamics of aIF-1A, specifically, an analysis of amide 15N relaxation rates and 15N-1H NOE values, and measurements of the rates at which amide protons exchange with solvent. Amide 15N relaxation rates are sensitive to motions occurring on a nanosecond to picosecond time scale, whereas amide proton exchange rates are related to the solvent accessibility of each residue, as well as the frequencies with which hydrogen bonds open, and to the presence of exchange catalysts, which may be provided by local structural features. Results of the 15N relaxation and amide proton exchange rate analyses are summarized in Figure 8 ▶.
Fig. 8.

A summary of the NMR results related to internal motions within the aIF-1A protein. (A) A color-coded stereo view representation of the values of the order parameters (S2) derived from 15N relaxation rate data for the backbone amide nuclei. Residues with order parameters < 0.5 are indicated in red; residues with order parameters between 0.5 and 0.7 are indicated in orange; residues with order parameters between 0.7 and 0.8 are indicated in green; residues with order parameters > 0.8 are indicated in blue. Backbone amide nuclei with the greatest values of the order parameter generally have the most-restricted motion on the picosecond-to-nanosecond time scale. Residues 1, 84–87, 101, and 102 are not included in the figure, because their amide protons exchange too rapidly with the solvent for 15N relaxation rate data to be obtained; other residues for which no 15N relaxation rate data was obtained, such as the prolines and the isolated unassigned residues, are labeled with the color appropriate for the adjacent residues. (B) A representation of the rates, with which backbone amide protons exchange with deuterium, which are derived from NMR data. Amide protons with exchange rates > 10−1 s−1 are indicated in red; exchange rates between 10−1 and 10−2 s−1 are indicated in orange; exchange rates between 10−2 and 10−4 s−1 are green; exchange rates < 10−4 s−1 are indicated in blue. Solvent exchange rates are normalized to pH 7, assuming a 10-fold increase in exchange rate for each increase of 1 pH unit. In general, amide groups with the lowest solvent exchange rates tend to be in the least flexible and least solvent-exposed parts of the protein.
Order parameters (S2) derived from 15N relaxation data, as well as the amide proton exchange rate data, each indicate that the highest degree of ordering occurs in residues located within the elements of regular secondary structure, specifically, the strands of the β-barrel and the central region of the helix at the C-terminal of the molecule. Together, relatively high values of the order parameter (S2 > 0.8), large values for the 15N-1H NOE, and amide protons that exchange with the solvent on time scales of several hours to several (or more) days, all indicate that these are the least flexible regions of the molecule.
The 15N relaxation and amide proton exchange data provide evidence that some regions of the molecule are quite flexible, such as the first 10 amino acids at the N-terminal of the protein and amino acids 31 to 33 in loop 2. At the N-terminal of the protein, residues 3 to 10 have very small or negative NOE values and low values of the order parameter, indicating relatively little spatial restriction in motions on the picosecond time scale. Fast amide proton exchange rates, on the order of 1 sec or less, provide further evidence of flexibility (Fig. 8 ▶). 15N relaxation and quantitative amide exchange data were not obtained for six residues within these most flexible regions: M1 and A2 at the N-terminal of the protein, A32 within loop 2, K86 within loop 5, and 101 and 102 at the C-terminal of the molecule, because their amide protons were not observed, most likely because of their rapid exchange with solvent.
15N relaxation and amide exchange rate data provide a differing, though not contradictory, indication of the local motions for the loop 3 and loop 4 regions of the protein molecule. Relatively high-order parameters and large values of the 15N-1H NOE indicate that loops 3 and 4 are well ordered on the picosecond to nanosecond time scale and have an average tumbling time that is similar to that of the core of the protein (Fig. 8A ▶). The relatively rapid solvent exchange rates for most of the residues of loops 3 and 4 (Fig. 8B ▶) can in some instances be attributed simply to solvent accessibility. However, all of the amide groups within loops 3 and 4 are not equally solvent exposed. Transient local unfolding of the structures of loops 3 and 4, occurring on a relatively slow time scale (in the range of microseconds to several seconds), would account for the observation of rapid solvent exchange rates combined with relatively high-order parameters.
Discussion
The components and mechanism of the initiation of protein synthesis are likely to have evolved at a very early stage along the path from primordial to modern life. The initiation of translation can be hypothesized to be a critical divergence point that separates the archaea, prokaryotes, and eukaryotes. This hypothesis is consistent with the observation that translation in archaea contains a mosaic of prokaryotic and eukaryotic features (Bult et al. 1996; Bell and Jackson 1998), as well as the observation in the present work that aIF-1A has structural similarity to IF1 as well as eIF-1A.
Evolutionary relationships among the translation initiation factors of prokaryotes have been investigated using comparisons of primary sequence as well as tertiary structure (Cousineau et al. 1997; Brock et al. 1998), and a model of three separate gene duplication/fusion events has been proposed to illustrate the origin and evolution of translation initiation factors IF1, IF2, and IF3 in E. coli (Cousineau et al. 1997). In this model, the prokaryotic initiation factors are considered to have evolved from one ancestral protein, IF1, which consists of a single unit of the oligomer-binding (OB) motif. This idea is consistent with the hypothesis that many of the modern proteins have evolved from a small set of rudimentary structural domains (Doolittle 1995). The eukaryotes and archaea contain a larger set of translation initiation factors, which can be grouped by primary sequence homology, and more recently, by structure, into several potential families. One of these families contains aIF-1A and eIF-1A, which through their apparent relationship to IF1, appear to form a set of universally conserved translation initiation factors (Krypdes et al. 1998).
How might aIF-1A interact with the small subunit of the ribosome?
Ramakrishnan and coworkers reported recently a crystal structure of the prokaryotic initiation factor IF1 in complex with the 30S subunit of the T. thermophilus ribosome (Carter et al. 2001). IF1 was shown to occlude the ribosomal A-site (Dahlquist and Puglisi 2000) by making specific contacts with A1492 and A1493 in helix 44 and phosphate groups along the backbones of helix 44 and the 530 loop, as well as with ribosomal protein S12 (Carter et al. 2001). The contacts with A1492 and A1493 are particularly interesting because these absolutely conserved nucleotides make specific contacts with the minor groove side of the tRNA anticodon loop when the A-site is occupied (Ogle et al. 2001). The nucleotides A1492 and A1493 have also received recently considerable attention because of their conformational change on binding the aminoglycoside antibiotics paromomycin and gentamicin (Fourmy et al. 1998; Lynch and Puglisi 2001a,b). Blocking the A-site, thus preventing occupancy by aminoacylated tRNA before initiation, could be an essential function of IF1.
Several pieces of evidence suggest that the aIF-1A protein of archaea may be the functional homolog of IF1 in prokaryotes, with aIF-1A binding to the A-site of archaeal ribosome in a manner analogous to IF1 binding the prokaryotic ribosome: (1) The IF1 and aIF-1A proteins are structurally similar with a significant number of conserved surface residues in common. There do not appear to be any other candidates for structural similarity to IF1 among the known archaeal translation initiation factors. (2) The conserved residues on the surface of IF1 that make specific contacts with helix 44 and the 530 loop (specifically, residues 54, 56, 58, and 77) correspond to conserved residues in aIF-1A that are capable of making the same or similar contacts within the A-site of the archaeal ribosome. For example, R54 of T. thermophilus IF1 (numbered as in Fig. 1 ▶) has a specific interaction with A1492 of helix 44; this same interaction could be made by K54 of aIF-1A in M. jannaschii. Amino acid R58 of T. thermophilus IF1 is stacked on the adenine base of A1493 (Carter et al. 2001); this same stacking interaction could be accomplished by W58 of aIF-1A in M. jannaschii. (3) IF1 and eIF-1A (and by analogy most likely, aIF-1A) each are known to bind to the small ribosomal subunit early in the initiation process before the arrival of the initiator tRNA (Moazed et al. 1995; Merrick and Hershey 1996, Pestova et al. 1998), thus providing a further hint of possible analogous functional roles.
To further investigate how aIF-1A may specifically contact the small subunit of the archaeal ribosome, we superimposed the structure of aIF-1A (determined in the present work) onto the structure of IF1 in complex with the 30S subunit (Carter et al. 2001), using the β-barrel of each protein to align aIF-1A and IF1 structures. When superimposed in this way, residues K54, R56, W58, and K77 of aIF-1A are in excellent position to make the same contacts with helix 44 and the 530 loop as the corresponding residues of IF1 make in the prokaryotic ribosome (schematically illustrated in Fig. 9 ▶). Interestingly, our prediction that aIF-1A has front and back sides (Fig. 6 ▶), with the back side being solvent exposed in the complex, is consistent with this speculation, because IF1 contains a solvent-exposed surface analogous to the back side of aIF-1A. The C-terminal helix of aIF-1A, which has no homologous counterpart in IF1, is not part of the conserved surface of aIF-1A and would not interfere with the hypothesized interactions. A test of the above speculation regarding the specific interactions between aIF-1A and the archaeal ribosome (as proposed in Fig. 9 ▶) may be accomplished by additional structural studies.
Fig. 9.

A schematic representation of where the aIF-1A protein might bind near the A-site of the archaeal ribosome small subunit. Possible RNA-protein interactions were identified by superimposing the β-barrel of the aIF-1A structure, determined in the present work, onto the β-barrel of IF1 in complex with the prokaryotic 30S ribosomal small subunit (Carter et al. 2001). Based on this superposition of structures, it is hypothesized that K54 and W58 of aIF-1A may make specific contacts with bases A1493 and A1492 of helix 44, and R56 and K77 may make specific contacts with phosphate groups on the backbone of the 530 loop and helix 44, respectively. These hypothetical interactions could potentially be confirmed by additional structural studies. It should be noted that the conformations of the side chains are not exactly established by NMR data. Hence, the purpose of this figure is to indicate conserved residues that are on the protein surface and available for binding and their locations on the protein surface, rather than to indicate precise side-chain conformations.
Materials and methods
Protein expression and purification
The gene encoding aIF-1A was obtained by PCR from an E. coli clone from the American type culture collection (ATCC clone number AMJPC53), containing a plasmid with the appropriate fragment of M. jannaschii genomic DNA. The PCR product was cut with restriction enzymes NdeI and BamHI, ligated into the plasmid pet25b (Novagen), and transformed into the E. coli strain BL21(DE3)pLysS (Novagen). Recombinant aIF-1A was obtained by growing typically 3 L of the overproducing E. coli strain in Luria Broth with 100-mg/L ampicillin and 30-mg/L chloramphenicol. Protein expression was induced by the addition of isopropyl-β-D-thiogalactopyranoside (IPTG) when cell density was such that OD600 = 0.5. Cells were lysed by freezing and thawing, and cellular nucleic acids were precipitated by the addition of polyethyleneimine to a concentration of 1%. After centrifugation, the supernatant containing the aIF-1A protein was precipitated by adding ammonium sulfate to 70% saturation. The precipitated proteins were centrifuged, the pellet dissolved in 10-mM phosphate buffer at pH 6, and flowed through a column of DEAE Sepharose (Pharmacia). Proteins that did not bind to the DEAE column, including the aIF-1A, were loaded to a column of SP-Sepharose (Pharmacia). The aIF-1A was eluted using an NaCl gradient, dialyzed, and concentrated using Centricon-10 microconcentrators (Amicon). The yield of aIF-1A was typically 10-mg purified protein per liter of culture. 15N and/or 13C isotopically enriched samples were prepared by growing E. coli on minimal media containing M9 salts, with 0.5-g/L 15N ammonium chloride and/or 1.0-g/L 13C glucose (Cambridge Isotopes) as the carbon and nitrogen sources. A sample of aIF-1A selectively labeled with 15N-lysine was prepared by growing E. coli in media containing unlabeled glucose and ammonium chloride, 50-mg/L 15N-labeled lysine, and 100 mg/L of the other 19 unlabeled amino acids; a sample enriched with 15N-threonine was prepared in an analogous manner. Samples of aIF-1A selectively labeled with 15N-glysine and 15N-serine were individually prepared using media containing 100-mg/L 15N-labeled glycine, no serine, and 100 mg/L of the other 18 unlabeled amino acids. A sample of aIF-1A selectively labeled with 15N-glycine, 15N-serine, 15N-cysteine, and 15N-tryptophan was prepared using media containing unlabeled glucose and ammonium chloride, 100-mg/L 15N-labeled glycine, no serine, cysteine or tryptophan, and 50 mg/L of the other 16 unlabeled amino acids.
NMR experiments and spectrum assignments
All NMR spectra were collected at 500 MHz using a triple-resonance Varian Inova spectrometer. Protein samples typically contained 10-mM phosphate buffer at pH 6, 5-mM sodium azide, and 300-mM sodium chloride in a volume of 550 μL. NMR data for spectrum assignment purposes were collected at temperatures between 35° and 45°C, with a protein concentration typically 1 mM in 90% H2O/10% D2O or 99.9% D2O solvent. NMR data used for the structure analysis, as well as 15N relaxation rate and amide exchange rate studies were collected at 35°C. 1H, 13C, and 15N chemical shift assignments for backbone nuclei were obtained using three-dimensional HNCO, HNCA, HNCACB, HN(CO)CACB, HN(CO)CA, and HCACO spectra. Side-chain 1H resonance assignments were obtained using two-dimensional 2QF-COSY and TOCSY spectra, and three-dimensional 15N-1H-1H HMQC-TOCSY and 1H-1H-13C HCCH-TOCSY spectra. NOE cross peaks were identified in two-dimensional 1H-1H NOE spectra, three-dimensional 15N-1H-1H HMQC-NOE spectra, and a three-dimensional 13C-1H-1H HMQC-NOE spectrum (Table 1). The 13C-edited 1H-1H NOE spectrum was collected in 90% H2O/10%D2O solvent, so that NOE peaks between amide and side-chain protons could be resolved by the chemical shift of a side-chain 13C nucleus. 1H, 13C, and 15N chemical shifts are referenced as recommended by Wishart et al. (1995), with 1H chemical shifts referenced to internal 2,2-dimethyl-2-silapentane-5-sulfonate (DSS) at 0 ppm. The 0-ppm 13C and 15N reference frequencies were determined by multiplying the 0-ppm 1H reference frequency by 0.251449530 and 0.101329118, respectively. A summary of the 1H, 13C, and 15N NMR spectrum assignments, order parameters, and amide proton exchange rates for the aIF-1A protein appears in Table S1 of the supplemental material.
Structure determination
The structure determination of the aIF-1A protein was performed using the hybrid distance geometry-simulated annealing and energy minimization protocols within the X-PLOR program suite (Brünger 1993), with the goal of identifying the full range of structures that are consistent with the distance and angle constraints derived from the NMR data, while having reasonable molecular geometry consistent with a minimum value of the X-PLOR energy function. Distance constraints were derived from the cross peaks within multidimensional NOE spectra acquired at a temperature of 35°C. Two-dimensional 1H-1H NOE spectra and three-dimensional 15N-1H-1H HSQC-NOE spectra were acquired using a relatively short NOE mixing time of 50 msec to minimize the effects of spin diffusion on peak intensities, and a 13C-1H-1H HSQC-NOE spectrum was acquired using an NOE mixing time of 120 msec. Depending on its intensity, NOE cross peaks identified in the spectra with short (50 msec) mixing times or the 13C-1H-1H HSQC-NOE spectrum were placed into one of four categories ranging from very strong to weak, and assigned to interproton distance bounds as follows: Strong (1.8–3.0 Å), medium (1.8–4.0 Å), weak (2.5–5.0 Å), and very weak (2.5–6.0 Å). NOEs detected in spectra with mixing times of up to 200 msec were assigned to distance ranges of < 6.0 Å. Backbone torsion angle restraints of φ = −120 ± 40° were included for residues with large (> 8 Hz) CαH-NH coupling constants, or restricted to −60 ± 25° for residues with small (< 4 Hz) CαH-NH coupling constants determined from splittings in the 1H-15N correlation peaks in an HMQC-COSY spectrum and carbonyl 13C chemical shifts typical of α-helix (Cornilescu et al. 1999). Distance restraints for hydrogen bonds were added for residues within the regions of regular α-helix or β-strand secondary structure, as indicated by observed characteristic NOE cross peaks, and where the amide proton was substantially protected from solvent exchange. Twelve unique and diverse starting structures were used for 240 runs of the simulated annealing protocol to insure that the full range of structures consistent with the NMR-derived constraints was obtained. A large fraction of the simulated annealing runs resulted in similar refined structures, and a set of 12 structures with the lowest X-PLOR energy term were used to represent the final model, with no more than two structures arising from each of the 12 unique starting models. After simulated annealing, models of the aIF-1A protein structure were considered acceptable if the following criteria were met: (1) The minimum value of the X-PLOR energy function was reached. (2) No interproton distance constraint violations exceeded 0.6 Å. (3) No torsion angle constraint violations exceeded 7°. Structural statistics (Table 2) were calculated with the assistance of the program PROCHECK-NMR (Laskowski et al. 1996). The coordinates for the M. jannaschii aIF-1A protein have been submitted to the Protein Data Bank and have been assigned PDB code 1JT8.
15N NMR relaxation rates
Measurements of 15N T1, T2, and 15N-1H NOE were performed at a proton frequency of 500 MHz using the pulse sequences described by Farrow et al. (1994), featuring gradient selection and sensitivity enhancement, and pulses for minimizing saturation of the solvent water. Six two-dimensional datasets were acquired for the T1 relaxation measurements, with relaxation delays of 10, 212, 410, 610, 810, and 1010 msec, respectively. Similarly, for the T2 relaxation measurements, five two-dimensional datasets were acquired with relaxation delays of 14.5, 29, 58, 87, and 144 msec. In all experiments, a 5-sec relaxation delay was used between the acquisition of each free induction decay, with the exception of the 1H-presaturated 15N-1H NOE experiment, in which a 1-sec delay followed by a 4-sec-long series of 120° nonselective 1H pulses separated by 5-msec delays was substituted. The T1 and T2 data were fitted to a single exponential decay equation of the form I = IO e−t/Td, in which t is time, Td is the decay constant T1 or T2, respectively, I is the intensity of the signal at time t, and IO is the intensity at time t = 0. The 15N relaxation data were interpreted within the framework of Lipari and Szabo (1982) model-free formalism, using the Modelfree 4.0 program developed by Palmer and coworkers (Mandel et al. 1995). A spectral density model was fit to the experimental R1, R2, and NOE data using the simplest model whenever possible, in which only the overall tumbling of the molecule (τm) and an order parameter (S2) were used as variables. In a few instances, this simple model proved insufficient for back-calculating the observed relaxation data, and additional variables τe and/or Rex were used to describe additional motions and chemical exchanges, respectively, as previously described (Lillemoen and Hoffman 1998).
Measurement of 1H-2H exchange rates
Because the 1H-2H exchange rates for amide protons within aIF-1A are distributed over a range of approximately seven orders of magnitude, it was necessary to use different experimental methods in determining the relatively slow and relatively fast exchange rates. Exchange rates for relatively slow exchanging amide protons (with exchange lifetimes of ∼10 min or more) were determined as follows: A sample of aIF-1A in NMR buffer with 100% 1H2O was frozen and lyophilized, then dissolved in D2O and immediately transferred to an NMR tube and inserted into the spectrometer, which had been tuned previously and equilibrated at 35°C. A series of five 15N-1H HMQC spectra were acquired, and each spectrum was processed identically. Amide proton exchange rates were determined by measuring peak heights in the HMQC spectra, which were then fitted to a first-order exponential decay equation.
Exchange rates for the amide protons that exchanged too rapidly to be evaluated by the 1H to 2H exchange experiment described above were evaluated using a saturation-transfer method, essentially as described by Spera et al. (1991) and Lillemoen and Hoffman (1997). Samples of fully 15N-labeled aIF-1A protein were equilibrated in NMR buffer at pH of 5, 6.5, and 8. Two 15N-1H HMQC spectra were obtained at each pH value: One spectrum was acquired using the jump-return method for water suppression (Plateau and Guéron 1982), and a second spectrum was acquired using the jump-return water suppression method, but in addition, the water resonance was presaturated for 3 sec. Saturation of the water resonance results in attenuation of the amide resonances by saturation transfer because of amide exchange with the water, as well as NOE and T1 relaxation effects. The effects of these different processes were separated by assuming that the attenuation attributable to NOE remained constant at the various pH values sampled, whereas amide proton exchange rates increase by 10-fold for each unit increase in pH. After correcting for NOE effects, the amide exchange and T1 contributions to resonance intensity were evaluated as previously described (Lillemoen and Hoffman 1997). For comparison, exchange rates were normalized to pH 7, assuming a 10-fold change in kHX for each change of 1 pH unit.
Acknowledgments
This work was supported by a grant from the Robert A. Welch Foundation and a grant from the American Cancer Society.
The publication costs of this article were defrayed in part by payment of page charges. This article must therefore be hereby marked "advertisement" in accordance with 18 USC section 1734 solely to indicate this fact.
Article and publication are at http://www.proteinscience.org/cgi/doi/10.1101/ps.18201.
Supplemental material: See www.proteinscience.org.
References
- Ban, N., Nissen, P., Hansen, J., Moore, P.B., and Steitz, T.A. 2000. The complete atomic structure of the large ribosomal subunit at 2.4 Å resolution. Science 289 905–920. [DOI] [PubMed] [Google Scholar]
- Battiste, J.L., Pestova, T.V., Hellen, C.U., and Wagner, G. 2000. The eIF1A solution structure reveals a large RNA-binding surface important for scanning function. Mol. Cell 5 109–119. [DOI] [PubMed] [Google Scholar]
- Bell, S.D. and Jackson, S.P. 1998. Transcription and translation in Archaea: A mosaic of eukaryal and bacterial features. Trends Microbiol. 6 222–228. [DOI] [PubMed] [Google Scholar]
- Biou, V., Shu, F., and Ramakrishnan, V. 1995. X-ray crystallography shows that translational initiation factor IF3 consists of two compact alpha/beta domains linked by an alpha-helix. EMBO J. 14 4056–4064. [DOI] [PMC free article] [PubMed] [Google Scholar]
- Brock, S., Szkaradkiewicz, K., and Sprinzl, M. 1998. Initiation factors of protein biosynthesis in bacteria and their structural relationship to the elongation and termination factors. Mol. Microbiol. 29 409–417. [DOI] [PubMed] [Google Scholar]
- Brünger, A.T. 1993. X-PLOR Version 3.1: A System for X-ray Crystallography and NMR. Yale University Press, New Haven.
- Bult, C.J., White, O., Olsen, G.J., Zhou, L., Fleischmann, R.D., Sutton, G.G., Blake, J.A., FitzGerald, L.M., Clayton, R.A., Gocayne, J.D., Kerlavage, A.R., Dougherty, B.A., Tomb, J.F., Adams, M.D., Reich, C.I., Overbeek, R., Kirkness, E.F., Weinstock, K.G., Merrick, J.M., Glodek, A., Scott, J.L., Geoghagen, N.S.M., and Venter, J.C. 1996. Complete genome sequence of the methanogenic archaeon, Methanococcus jannaschii. Science 273 1058–1073. [DOI] [PubMed] [Google Scholar]
- Bycroft, M., Hubbard, T.J., Proctor, M., Freund, S.M., and Murzin, A.G. 1997. The solution structure of the S1 RNA binding domain: A member of an ancient nucleic acid-binding fold. Cell 88 235–242. [DOI] [PubMed] [Google Scholar]
- Carter, A.P., Clemons, W.H., Broderson, D.E., Morgan-Warren, R.J., Hartsch, T., Wimberly, B.T., and Ramakrishnan, V. 2001. Crystal structure of an initiation factor bound to the 30S ribosomal subunit. Science 291 498–501. [DOI] [PubMed] [Google Scholar]
- Caruthers, J.M., Johnson, E.R., and McKay, D.B. 2000. Crystal structure of yeast initiation factor 4A, a DEAD-box RNA helicase. Proc. Natl. Acad. Sci. 97 13080–13085. [DOI] [PMC free article] [PubMed] [Google Scholar]
- Chaudhuri, J., Si, K., and Maitra, U. 1997. Function of eukaryotic translation initiation factor 1A (eIF1A) (formerly called eIF-4C) in initiation of protein synthesis. J. Biol. Chem. 272 7883–7891. [DOI] [PubMed] [Google Scholar]
- Chaudhuri, J., Chowdhury, D., and Maitra, U. 1999. Distinct functions of eukaryotic translation initiation factors eIF1A and eIF3 in the formation of the 40 S ribosomal preinitiation complex. J. Biol. Chem. 274 17975–17980. [DOI] [PubMed] [Google Scholar]
- Cornilescu, G., Delaglio, F., and Bax, A. 1999. Protein backbone angle restraints from searching a database for chemical shift and sequence homology. J. Biomol. NMR 13 289–302. [DOI] [PubMed] [Google Scholar]
- Cousineau, B., Leclerc, F., and Cedergren, R. 1997. On the origin of protein synthesis factors: A gene duplication/fusion model. J. Mol. Evol. 45 661–670. [DOI] [PubMed] [Google Scholar]
- Dahlquist, K.D. and Puglisi, J.D. 2000. Interaction of translation initiation factor IF1 with the E. coli ribosomal A site. J. Mol. Biol. 299 1–15. [DOI] [PubMed] [Google Scholar]
- Dennis, P.P. 1997. Ancient cyphers: Translation in Archaea. Cell 89 1007–1010. [DOI] [PubMed] [Google Scholar]
- Doolittle, R.F. 1995. The multiplicity of domains in proteins. Ann. Rev. Biochem. 64 287–314. [DOI] [PubMed] [Google Scholar]
- Draper, D.E. 1999. Themes in RNA-protein recognition. J. Mol. Biol. 293 255–270. [DOI] [PubMed] [Google Scholar]
- Farrow, N.A., Muhandiram, R., Singer, A.U., Pascal, S.M., Kay, C.M., Gish, G., Shoelson, S.E., Pawson, T., Forman-Kay, J.D., and Kay, L.E. 1994. Backbone dynamics of a free and phosphopeptide-complexed Src homology 2 domain studied by 15N NMR relaxation. Biochemistry 33 5984–6003. [DOI] [PubMed] [Google Scholar]
- Fletcher, C.M., Pestova, T.V., Hellen, C.U., and Wagner, G. 1999. Structure and interactions of the translation initiation factor eIF1. EMBO J. 18 2631–2637. [DOI] [PMC free article] [PubMed] [Google Scholar]
- Fourmy, D., Yoshizawa, S., and Puglisi, J.D. 1998. Paromomycin binding induces a local conformational change in the A-site of 16 S rRNA. J. Mol. Biol. 277 333–345. [DOI] [PubMed] [Google Scholar]
- Golden, B.L., Hoffman, D.W., Ramakrishnan, V., and White, S.W. 1993. Ribosomal protein S17: Characterization of the three-dimensional structure by 1H and 15N NMR. Biochemistry 32 12812–12820. [DOI] [PubMed] [Google Scholar]
- Groft, C.M., Beckmann, R., Sali, A., and Burley, S.K. 2000. Crystal structures of ribosome anti-association factor IF6. Nat. Struct. Biol. 7 1156–1164. [DOI] [PubMed] [Google Scholar]
- Kim, K.K., Hung, L.W., Yokota, H., Kim, R., and Kim, S.H. 1998. Crystal structures of eukaryotic translation initiation factor 5A from Methanococcus jannaschii at 1.8 Å resolution. Proc. Natl. Acad. Sci. 95 10419–10424. [DOI] [PMC free article] [PubMed] [Google Scholar]
- Kraulis, P.J. 1991. MOLSCRIPT: A program to produce both detailed and schematic plots of protein structures. J. Appl. Cryst. 24 946–950. [Google Scholar]
- Kyrpides, N.C. and Woese, C.R. 1998. Universally conserved translation initiation factors. Proc. Natl. Acad. Sci. 95 224–228. [DOI] [PMC free article] [PubMed] [Google Scholar]
- Laskowski, R.A., Rullmann, J.A.C., MacArthur, M.W., Kaptein, R., and Thornton, J.M. 1996. AQUA and PROCHECK-NMR: Programs for checking the quality of protein structures solved by NMR. J. Biomol. NMR 8 477–486. [DOI] [PubMed] [Google Scholar]
- Lillemoen, J. and Hoffman, D.W. 1998. An investigation of the dynamics of ribosomal protein L9 using heteronuclear NMR relaxation measurements. J. Mol. Biol. 281 539–551. [DOI] [PubMed] [Google Scholar]
- Lillemoen, J., Cameron, C.S., and Hoffman, D.W. 1997. Stability and dynamics of ribosomal protein L9: An investigation of a molecular strut by amide proton exchange and circular dichroism. J. Mol. Biol. 268 482–493. [DOI] [PubMed] [Google Scholar]
- Lipari, G. and Szabo, A. 1982. Model-free approach to the interpretation of nuclear magnetic resonance relaxation in macromolecules. 1. Theory and range of validity. J. Am. Chem. Soc. 104 4546–4559. [Google Scholar]
- Lynch, S.R. and Puglisi, J.D. 2001a. Structure of a eukaryotic decoding region A-site RNA. J. Mol. Biol. 306 1023–1035. [DOI] [PubMed] [Google Scholar]
- ———. 2001b. Structural origins of aminoglycoside specificity for prokaryotic ribosomes. J. Mol. Biol. 306 1037–1058. [DOI] [PubMed] [Google Scholar]
- Mandel, A. M., Akke, M., and Palmer, III, A. G. 1995. Backbone dynamics of Escherichia coli ribonuclease HI: Correlations with structure and function in an active enzyme. J. Mol. Biol. 246 144–163. [DOI] [PubMed] [Google Scholar]
- Marcotrigiano, J., Gingras, A.C., Sonenberg, N., and Burley, S.K. 1997. Cocrystal structure of the messenger RNA 5′ cap-binding protein (eIF4E) bound to 7-methyl-GDP. Cell 89 951–961. [DOI] [PubMed] [Google Scholar]
- Marcotrigiano, J., Lomakin, I.B., Sonenberg, N., Pestova, T.V., Hellen, C.U., and Burley, S.K. 2001. A conserved HEAT domain within eIF4G directs assembly of the translation initiation machinery. Mol. Cell 7 193–203. [DOI] [PubMed] [Google Scholar]
- Matsuo, H., Li, H., McGuire, A.M., Fletcher, C.M., Gingras, A.C., Sonenberg, N., and Wagner, G. 1997. Structure of translation factor eIF4E bound to m7GDP and interaction with 4E-binding protein. Nat. Struct. Biol. 4 717–724. [DOI] [PubMed] [Google Scholar]
- McCutcheon, J.P., Agrawal, R.K., Philips, S.M., Grassucci, R.A., Gerchman, S.E., Clemons, W.M. Jr., Ramakrishnan, V., and Frank, J. 1999. Location of translational initiation factor IF3 on the small ribosomal subunit. Proc. Natl. Acad. Sci. 96 4301–4306. [DOI] [PMC free article] [PubMed] [Google Scholar]
- Merrick, W.C. and Hershey, J.W.B. 1996. Translational Control. pp. 31–69. Cold Spring Harbor Laboratory Press, New York.
- Meunier, S., Spurio, R., Czisch, M., Wechselberger, R., Guenneugues, M., Gualerzi, C.O., and Boelens, R. 2000. Structure of the fMet-tRNA(fMet)-binding domain of B. stearothermophilus initiation factor IF2. EMBO J. 19 1918–1926. [DOI] [PMC free article] [PubMed] [Google Scholar]
- Moazed, D., Samaha, R.R., Gualerzi, C., and Noller, H.F. 1995. Specific protection of 16 S rRNA by translational initiation factors. J. Mol. Biol. 248 207–210. [DOI] [PubMed] [Google Scholar]
- Murzin, A.G. 1993. OB(oligonucleotide/oligosaccharide binding)-fold: Common structural and functional solution for non-homologous sequences. EMBO J. 12 861–867. [DOI] [PMC free article] [PubMed] [Google Scholar]
- Ogle, J.M., Brodersen, D.E., Clemons, W.M., Tarry, M.J., Carter, A.P., and Ramakrishnan, V. 2001. Recognition of cognate transfer RNA bythe 30S ribosomal subunit. Science 292 897–902. [DOI] [PubMed] [Google Scholar]
- Pestova, T.V., Borukhov, S.I., and Hellen, C.U. 1998. Eukaryotic ribosomes require initiation factors 1 and 1A to locate initiation codons. Nature 394 854–859. [DOI] [PubMed] [Google Scholar]
- Plateau, P. and Guéron, M. 1982. Exchangeable proton NMR without line distortion. J. Am. Chem. Soc. 104 7310–7311. [Google Scholar]
- Saito, R. and Tomita, M. 1999. Computer analyses of complete genomes suggest that some archaebacteria use both eukaryotic and eubacterial mechanisms in translation initiation. Gene 238 79–83. [DOI] [PubMed] [Google Scholar]
- Sette, M., van Tilborg, P., Spurio, R., Kaptein, R., Paci, M., Gualerzi, C.O., and Boelens, R. 1997. The structure of the translational initiation factor IF1 from E. coli contains an oligomer-binding motif. EMBO J. 16 1436–1443. [DOI] [PMC free article] [PubMed] [Google Scholar]
- Spera, S., Ikura, M., and Bax, A. 1991. Measurement of the exchange rates of rapidly exchanging amide protons: Application to the study of calmodulin and its complex with the myosin light chain kinase. J. Biomol. NMR 1 155–165. [DOI] [PubMed] [Google Scholar]
- Wei, C.L., Kainuma, M., and Hershey, J.W. 1995. Characterization of yeast translation initiation factor 1A and cloning of its essential gene. J. Biol. Chem. 270 22788–22794. [DOI] [PubMed] [Google Scholar]
- Wimberly, B.T., Brodersen, D.E., Clemons, W.M. Jr., Morgan-Warren, R.J., Carter, A.P., Vonrhein, C., Hartsch, T., and Ramakrishnan, V. 2000. Structure of the 30S ribosomal subunit. Nature 407 327–339. [DOI] [PubMed] [Google Scholar]
- Wishart, D.S., Bigam, C.G., Yao, J., Abildgaard, F., Dyson, H.J., Oldfield, E., Markley, J.L., and Sykes, B.D. 1995. 1H, 13C and 15N chemical shift referencing in biomolecular NMR. J. Biomol. NMR 6 135–140. [DOI] [PubMed] [Google Scholar]