Abstract
The contribution of induced fit to enzyme specificity has been much debated, although with little experimental data. Here we probe the effect of induced fit on enzyme specificity using the trypsin(ogen) system. BPTI is known to induce trypsinogen to assume a trypsinlike conformation. Correlations are observed between BPTI affinity and the values of kcat/Km for the hydrolysis of two substrates by eight trypsin(ogen) variants. The slope of both correlations is −1.8. The crystal structures of the BPTI complexes of four variant trypsinogens were also solved. Three of these enzymes, K15A, ΔI16V17/D194N, and ΔI16V17/Q156K trypsinogen, are 10- to 100-fold more active than trypsinogen. The fourth variant, ΔI16V17 trypsinogen, is the lone outlier in the correlations; its activity is lower than expected based on its affinity for BPTI. The S1 site and oxyanion hole, formed by segments 184A–194 and 216–223, are trypsinlike in all of the enzymes. These structural and kinetic data confirm that BPTI induces an active conformation in the trypsin(ogen) variants. Thus, changes in BPTI affinity monitor changes in the energetic cost of inducing a trypsinlike conformation. Although the S1 site and oxyanion hole are similar in all four variants, the N-terminal and autolysis loop (residues 142–152) segments have different interactions for each variant. These results indicate that zymogen activity is controled by a simple conformational equilibrium between active and inactive conformations, and that the autolysis loop and N-terminal segments control this equilibrium. Together, these data illustrate that induced fit does not generally contribute to enzyme specificity.
Keywords: Serine protease, zymogen, trypsinogen, trypsin, enzyme catalysis, transition state analogy, induced fit
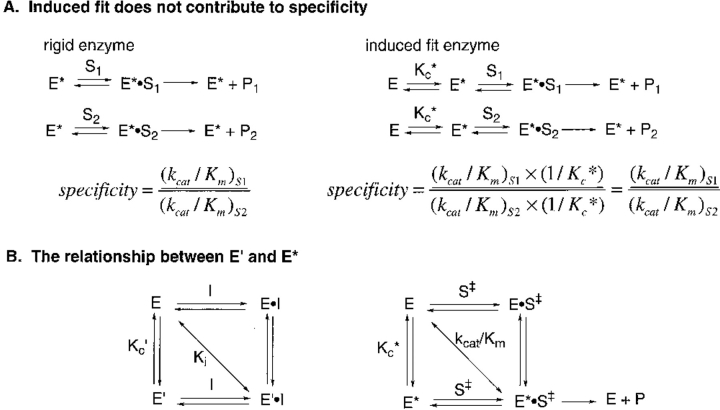
Koshland (1958) first proposed that induced fit provides a mechanism for substrate discrimination, namely, that a good substrate can induce an enzyme to adopt an active conformation, whereas a poor substrate cannot facilitate this conformational change. This idea has been much debated and refined over the years, albeit with a remarkable absence of experimental data. Specificity is determined by the ratio of the values of kcat/Km for good and poor substrates. Fersht (1974, 1985) has argued that induced fit does not provide specificity in the simple case in which chemistry is rate limiting in the enzymatic reaction. As shown in Figure 1A ▶, the values of kcat/Km for both a good substrate and a poor substrate will be reduced by the factor 1/Kc*, where Kc* is the equilibrium constant for the interconversion of the inactive E and active E* conformations (because E dominates the equilibrium, Kc* < 1; more generally with no assumptions on the value of Kc*, the factor will be Kc*/[1 + Kc*]; Fersht 1974, Fersht 1985). Thus, an induced fit enzyme is no more specific than its rigid counterpart. However, induced fit can provide specificity in other cases: (1) The conformational change encloses the substrate within the enzyme, thus providing binding interactions with a good substrate that would not be available with a poor substrate (Wolfenden 1974); and (2) chemistry is rate limiting for the poor substrate, whereas substrate binding or product release limits the reaction of the good substrate (Herschlag 1988). In addition, Post and Ray (1995) noted that induced fit can decrease specificity if the two substrates induce different active conformations.
Fig. 1.
Schemes describing induced fit and conformational equilibrium. (A) Induced fit does not contribute to enzyme catalysis (Fersht 1985). E* denotes the active enzyme conformation; E, the inactive conformation; Kc*, the equilibrium constant for the interconversion of E and E*; S1 and S2, the two different substrates; and P1 and P2, their respective products. (B) The relationship between E′ and E*. I denotes the inhibitor; E′ indicates the enzyme conformation that binds inhibitor; Kc′, the equilibrium constant for the interconversion of E and E′; and S‡, the transition state structure of substrate S which is converted to product P. The experimental value of Ki measures the overall dissociation reaction of E′ • I to E and I as denoted by the diagonal. Similarly, the value of kcat/Km measured the transformation of E and S to E* • S‡. If E′ and E* are similar, then Kc′ and Kc*. should be related and a correlation will be observed between Ki and kcat/Km.
The trypsin/trypsinogen system presents an opportunity to experimentally test these ideas. The active site of trypsin has a relatively rigid structure that does not appear to undergo a significant conformational change during catalysis. The trypsin active site is an exact complement to the inhibitory loop of BPTI (Huber and Bode 1978). However, although 85% of the trypsinogen structure is identical to trypsin, the active site is disordered, rendering the zymogen inactive (Fig. 2 ▶; Fehlhammer et al. 1977; Kossiakoff et al. 1977). The active site of trypsinogen assumes an ordered trypsinlike structure when BPTI binds, although the structure displays higher B factors than the trypsin-BPTI complex and still contains some disordered sections in the case of the rat trypsinogen-BPTI complex (Huber and Bode 1978; Pasternak et al. 1999). Nevertheless, the energetic cost of ordering the active site of trypsinogen can be estimated by comparing the BPTI affinities of trypsinogen and trypsin. Because the interface between BPTI and trypsin is very similar to the interface between BPTI and trypsinogen, the total binding energy of BPTI must also be similar. Therefore, the difference in BPTI affinity of trypsin and trypsinogen must correspond to the energy required to change the conformation of trypsinogen and can be used to determine Kc′ (Fig. 1B ▶; Bode and Huber 1976). If the conformation induced by BPTI is similar to the conformation required for substrate hydrolysis (i.e., E′ is similar to E*), then Kc′ should approximate Kc* (Fig. 1B ▶). The trypsinogen/trypsin system, therefore, permits experimental tests of the relationship between induced fit and specificity. Mutations can be introduced which perturb Kc*, both by destabilizing the active conformation of trypsin and by stabilizing the active conformation of trypsinogen. BPTI affinity provides a measure of Kc′, and hence Kc*. If E′ and E* are similar, then the values of kcat/Km for substrate hydrolysis should correlate with the values of Ki for BPTI inhibition. If the scheme in Figure 1A ▶ is correct, then parallel correlations should be observed for different substrates.
Fig. 2.
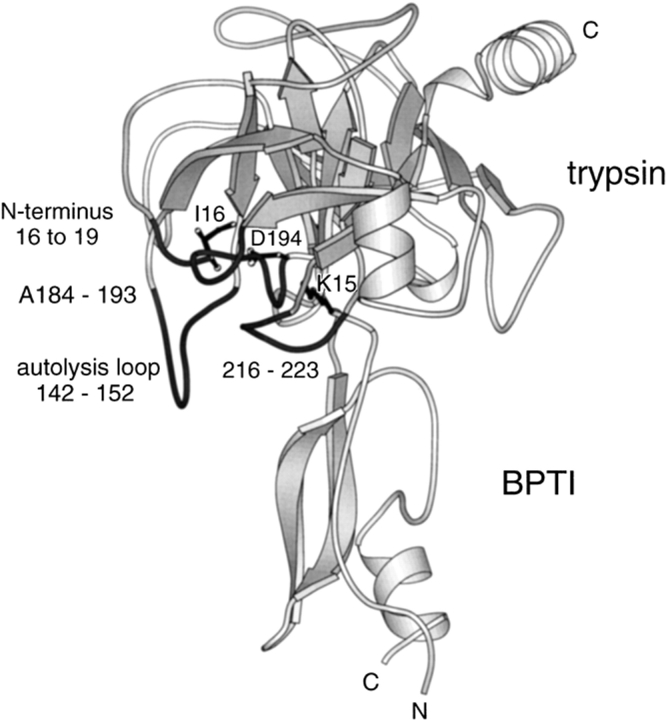
The structure of the rat trypsin-BPTI complex. The structure of rat trypsinogen has not been solved. Nevertheless, several lines of experimentation suggest that the activation domain of rat trypsinogen is disordered as observed in bovine trypsinogen (Pasternak et al. 1999). The four segments of the activation domain that are disordered in bovine trypsinogen (and presumably in rat trypsinogen) are shown in dark gray.
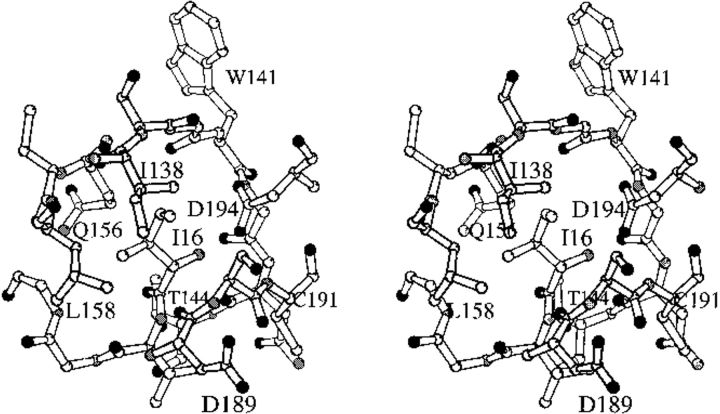
The disordered region of trypsinogen is termed the activation domain and is comprised of four segments: the N terminus to Gly19,7 Gly142 to Pro152 (the autolysis loop), Gly184A to Gly193, and Gly216 to Asn223 (Fig. 2 ▶). These latter two segments form the S1 binding site and oxyanion hole, whereas the autolysis loop forms part of the S2′ site (nomenclature of Schechter and Berger 1967). Trypsinogen is converted to trypsin by proteolytic cleavage of a peptide from its N terminus. The amino group of the new N-terminal Ile16 binds in a pocket, forming a salt bridge with the carboxylate of Asp194 (Fig. 3 ▶). These interactions stabilize the segments that form the S1 binding site and the oxyanion hole of the trypsin active site, as well as part of the S2′ site. Not surprisingly, destabilization of this structure by the substitution of Ile16 with smaller residues or by the substitution of Asp194 with Asn impairs the protease activity of trypsin (Hedstrom et al. 1996). However, the Asp194Asn mutation increases the activity of trypsinogen constructs (Pasternak et al. 1998). K15A trypsinogen (Pasternak et al. 1998) and ΔI16V17/Q156K trypsinogen (reported herein) also appear to be more active than trypsinogen.8
Fig. 3.
The structure of the Ile16 pocket of the wild-type trypsin-BPTI complex. Residues shown are Ile16-Gly19, Ile138-Thr144, Glu156-Leu158, Asp189-Cys191, and Asp194. The N-terminal amino group of Ile16 forms a salt bridge with the carboxylate group of Asp194. The side chain of Ile16 interacts with Ile138, Gln156, Leu158, and Ser190. The carboxylate of Asp194 also forms hydrogen bonds to the amide nitrogens of Gly142 and Cys191.
We have previously reported that a correlation is observed between BPTI affinity and kcat/Km for these trypsin(ogen) variants (Pasternak et al. 1998). However, one outlier was identified, ΔI16V17 trypsinogen, where the value of kcat/Km is lower than would be predicted from the value of Ki (Pasternak et al. 1998). Interestingly, the rate of BPTI binding to ΔI16V17 trypsinogen is much slower than that to the other variants. This observation suggests that the interconversion of ΔI16V17 trypsinogen conformations is slow. A kinetic barrier may prevent the formation of E* during catalysis but would not prohibit the formation of the BPTI complex. Alternatively, the enzyme-BPTI interface may be different for ΔI16V17 trypsinogen.
Here we report the crystal structures of the BPTI complexes of three trypsinogen variants possessing increased activity (ΔI16V17/D194N trypsinogen, ΔI16V17/Q156K trypsinogen, and K15A trypsinogen), as well as the outlier ΔI16V17 trypsinogen. These structures confirm that BPTI induces a trypsinlike active site conformation in all of the trypsin(ogen) mutants, including ΔI16V17 trypsinogen. These results validate the use of BPTI affinity to determine the value of Kc, as well as provide valuable insight into the structural elements that control zymogen activity in the trypsin family of serine proteases. In addition, we extend the correlation of Kc and kcat/Km to a second substrate to show experimentally the effect of induced fit on enzyme specificity.
Results
Substitution of Lys at position 156 increases the activity of ΔI16V17 trypsinogen
The zymogen of t-PA is active because of the formation of a salt bridge between Asp194 and a Lys at position 156 (Renatus et al. 1997). This alternative salt bridge is also observed in the crystal structure of bovine trypsinogen and PSTI (Bolognesi et al. 1982). Interestingly, rat trypsinogen contains a Gln at position 156 and appears to be less active than bovine trypsinogen (Pasternak et al. 1999). These observations suggested that Gln156Lys mutation might increase the activity of trypsinogen. To avoid complications associated with autoactivation of rat trypsinogen, the Gln156Lys mutation was constructed in the ΔI16V17 trypsinogen framework (Hedstrom et al. 1996; Pasternak et al. 1998). The activity of ΔI16V17/Q156K trypsinogen is increased 10-fold relative to ΔI16V17 trypsinogen as measured by kcat/Km (Table 1). This increase in activity was accompanied by a corresponding increase in BPTI affinity (Table 1).
Table 1.
Hydrolysis of Tos-Gly-Pro-Arg-AMC by mutant trypsinogens
| Enzyme | kcat/Km (M−1s−1) | ΔΔG (kcal/mol) | Ki (μM) | ΔΔGBPTI (kcal/mol) |
| Wild-type trypsinc | 9 × 10⁶ | — | 0.00044b | — |
| S195A trypsinogenc | NA | NA | ≥300a | ≥8 |
| I16G trypsinogenc | 0.069 | 11.0 | 110a | 7.3 |
| ΔI16V17 trypsinogenc | 0.025 | 11.6 | 9a | 5.9 |
| K15A trypsinogenc | 4.4 | 8.6 | 12.4b | 6.0 |
| ΔI16V17/D194N trypsinogenc | 3.9 | 8.6 | 12a (29)b | 6.0 |
| ΔI16V17/Q156K trypsinogen | 0.22 | 10.3 | 65b | 7.0 |
Michaelis-Menten parameters are listed below for the hydrolysis of Tos-Gly-Pro-Arg-AMC by wild-type and mutant trypsinogens. Values reported are the average of at least two independent experiments ± SEM. Assays were performed in 50 mM Hepes, pH 8.0, 100 mM NaCl and 10 mM CaCl2 at 25°C. ΔΔG is calculated from the ratio of kcat/Km for mutant to wild-type trypsin. The values of Kd for the dissociation of BPTI complexes were determined either by aisothermal titration calorimetry or bmonitoring the inhibition of enzyme activity. cData from Pasternak et al (Pasternak et al. 1998). ΔΔGBPTI is determined from the ratio of the Ki's of the mutant trypsinogens to trypsin.
Correlations of the values of kcat/Km for substrate hydrolysis with Ki for BPTI
We have previously reported a linear correlation of the values of kcat/Km for the hydrolysis of Tos-Gly-Pro-Arg-AMC and Ki of BPTI for nine trypsin(ogen) variants, including wild-type and I16V trypsin. This correlation has a slope of −1.56 with r = 0.98. However, the induced fit treatment requires that Kc* is <1 (see Introduction). The value of Kc* is ≥100 for wild-type and I16V trypsins (Hedstrom et al. 1996). Therefore, these variants have been removed from the correlations of Figure 4 ▶, as has the previously identified outlier ΔI16V17 trypsinogen.
Fig. 4.
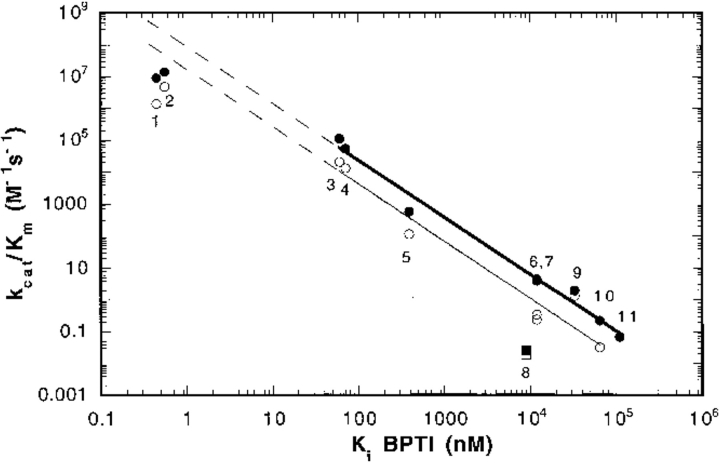
The correlation between BPTI affinity and kcat/Km for mutant rat trypsin(ogens). The values of the Ki of BPTI inhibition and kcat/Km for the hydrolysis of Tos-Gly-Pro-Arg-AMC (closed circles and square) and Tos-Gly-Pro-Lys-AMC (open circles and square) of the following rat trypsin(ogen) II mutants: wild-type (1), I16V trypsin (2), I16A trypsin (3), D194N trypsin (4), I16G trypsin (5), K15A trypsinogen (6), ΔI16V17/D194N trypsinogen (7), ΔI16V17 trypsinogen (8), ΔI trypsin (9), ΔI16V17/Q156K trypsinogen (10), and I16G trypsinogen (11). The data for ΔI16V17 trypsinogen (squares) were omitted from the correlation. Data for wild-type trypsin, D194N trypsin, I16V trypsin, I16A trypsin, and I16G trypsin were reported in Hedstrom et al. (1996); data for K15A trypsinogen, I16 trypsinogen, ΔI16V17/D194N trypsinogen, ΔI16 trypsin in Pasternak, et al. (1998); data for ΔI16V17/Q156K trypsinogen in this study; and data for ΔI16V17 trypsinogen in Pasternak, et al. (1998). No Tos-Gly-Pro-Lys-AMC data is available for I16G trypsinogen. The dashed lines show the extrapolation of the correlation to wild-type trypsin.
Trypsin prefers P1 residue Arg over Lys by a factor of ∼7 in amide hydrolysis (Hedstrom et al. 1996). This specificity is maintained in the variants (Fig. 4 ▶). Parallel linear correlations are observed for the values of kcat/Km versus Ki of BPTI for the hydrolysis of both Tos-Gly-Pro-Arg-AMC and Tos-Gly-Pro-Lys-AMC, with slopes of −1.78 (r = 0.977) and −1.79 (r = 0.995), respectively.
Structures of the BPTI complexes of mutant trypsinogens
We have solved the X-ray crystal structures of the BPTI complexes of K15A trypsinogen, ΔI16V17/D194N trypsinogen, ΔI16V17/Q156K trypsinogen, and ΔI16V17 trypsinogen to confirm that a trypsinlike active site conformation is formed and to gain further insight into the structural basis of zymogen activity. All of the structures were solved to a resolution of at least 1.7 Å. Table 2 summarizes the crystallographic statistics. These structures were compared with the BPTI complexes of trypsin and S195A trypsinogen solved previously (see below; Pasternak et al. 1999). The general features of all the structures are identical, that is, the two β barrel domains of trypsin(ogen), BPTI, and most of the enzyme/BPTI interface, as expected given the similarity of the BPTI complexes of trypsin and S195A trypsinogen. The N terminus is disordered before residue 14 in all cases. In particular, the S1 sites and oxyanion holes have the same conformation as trypsin (Fig. 5 ▶). The autolysis loop is more ordered and/or trypsinlike in these mutants than in S195A trypsinogen. However, each mutant uses the autolysis loop (residues 142–153) and N-terminal segments differently to support the S1 site and oxyanion hole. The differences in autolysis loop structure change the S2′ interactions in some cases. To put these structures into context, we will first review the structures of the BPTI complexes of rat trypsin and S195A trypsinogen.
Table 2.
Crystallographic statistics for BPTI complexes of rat trypsin and trypsinogen mutants
| ΔI16V17 trypsinogen | ΔI16V17/D194N trypsinogen | ΔI16V17/Q156K trypsinogen | K15A trypsinogen | |
| Data Collection | ||||
| Molecules per asymmetric unit | 1 | 1 | 1 | 1 |
| Space group | P3221 | P3221 | P3221 | P3221 |
| Unit cell | a = b = 92.60 | a = b = 92.53 | a = b = 92.57 | a = b = 92.70 |
| Dimensions (Å) | c = 62.06 | c = 62.07 | c = 62.13 | c = 62.08 |
| Resolution range (Å) | 10–1.7 | 10–1.7 | 22–1.65 | 20–1.55 |
| Reflections observed | 160,328 | 181,142 | 195,481 | 172,527 |
| Unique reflections | 32,489 | 32,654 | 34897 | 44,058 |
| Rmergea (%) | 5.9 | 5.7 | 5.0 | 5.6 |
| Completeness (%) | 95.2 | 95.8 | 93.7 | 95.7 |
| Refinement | ||||
| Resolution range (Å) | 10–1.7 | 10–1.7 | 22–1.65 | 30–1.55 |
| Reflections used | 29240/3249 | 29389/3265 | 31408/3489 | 38611/4305 |
| (Working/free; F/σ(F) > 0)) | no cutoff | no cutoff | no cutoff | no cutoff |
| Final R factorb (%) | 18.4 | 18.4 | 19.0 | 19.9 |
| Final R free (%) | 21.3 | 21.8 | 22.0 | 20.9 |
| Number of nonhydrogen | 2072 | 2105 | 2071 | 2042 |
| Protein atoms | ||||
| Number of Ca+2 ions | 1 | 1 | 1 | 1 |
| Number of H2O | 232 | 213 | 270 | 153 |
| Number of SO4−2 | 3 | 3 | 0 | 2 |
| Temperature factor model | individual | individual | individual | individual |
| Rms deviations from ideal geometry | ||||
| Bond lengths (Å) | 0.01 | 0.01 | 0.005 | 0.0049 |
| Bonds angles (deg) | 1.5 | 1.6 | 1.3 | 1.3 |
| Improper angles (deg) | 0.82 | 0.89 | 0.78 | 0.76 |
| Dihedral angles (deg) | 26.8 | 27.0 | 25.3 | 25.4 |
a Rmerge = ∑/Ii − 〈I〉 I/∑Ii, where Ii is the scaled intensity of the ith measurement; and 〈I〉 is the mean intensity for that reflection.
b R factor = ∑/Fobs − Fcalc I/∑Fobs for all reflections.
Fig. 5.
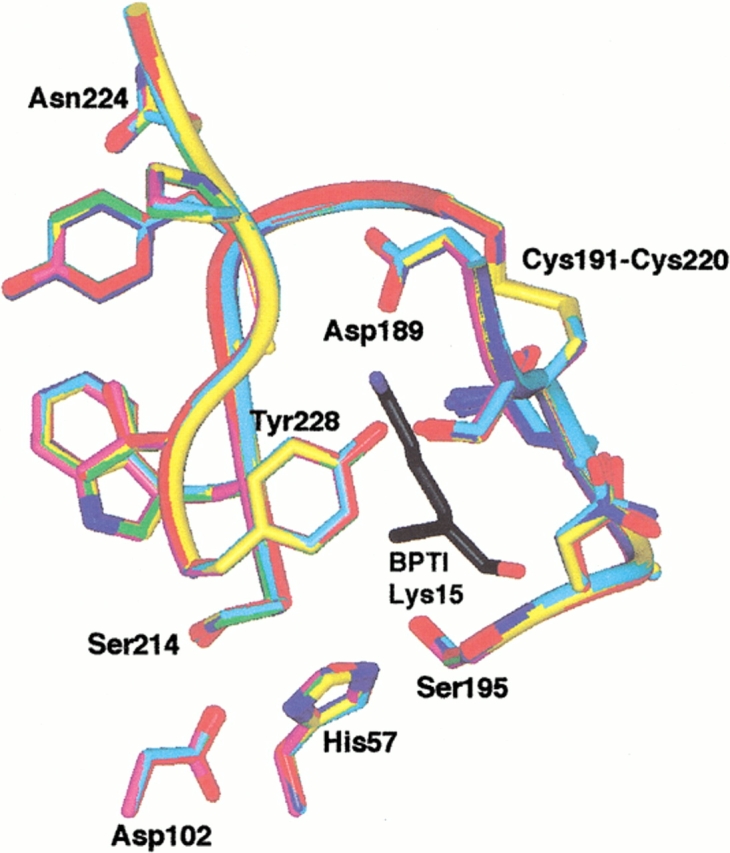
Active site structure of trypsin and mutant trypsin(ogens). The S1 site and oxyanion hole residues are shown. Lys15, the P1 residue of BPTI, is shown in black. The following color scheme is used: wild-type, purple; K15A trypsinogen, green; ΔI16V17/Q156K trypsinogen, yellow; S195A trypsinogen, red; ΔI16V17 trypsinogen, blue; and ΔI16V17/D194N trypsinogen, cyan. The structures were superimposed by least squares superposition of the backbone atoms of residues 20–140 and 154–245.
Structures of rat trypsin and S195A trypsinogen
The structure and kinetic properties of anionic rat trypsin are very similar to those of cationic bovine trypsin, with the exception of BPTI affinity. The value of Kd for bovine trypsin is 10−13 M versus 4 × 10⁻¹⁰ M for rat trypsin (Vincent and Lazdunski 1972; Hedstrom et al. 1996). Nevertheless, BPTI can induce a trypsinlike conformation in rat trypsinogen as observed in bovine trypsinogen. Overall, the rat trypsin and S195A trypsinogen BPTI complexes are very similar (Pasternak et al. 1999). However, striking differences are observed in the N terminus (residues 15–19; the residues before Lys15 are disordered) and the autolysis loop (residues 142–153). Ile16 occupies a very similar position in both rat trypsin and S195A trypsinogen (unlike bovine trypsinogen; Huber and Bode 1978). However, in S195A trypsinogen, the remainder of the N terminus prevents formation of the Ile16-Asp194 salt bridge. Instead, the amide nitrogen of Ile16 is interacts with Asp194 via a water-mediated hydrogen bond. The hydrogen bond between the carboxylate of Asp194 and the amide nitrogen of Cys191 is formed as observed in trypsin. However, the side chain of Lys15 pushes Gly142 and Asn143 away from their positions in trypsin and disrupts the hydrogen bond between the Asp194 carboxylate and the amide nitrogen of Gly142. In addition, Pro152 and Asp153 are moved to new positions. Thus, although the remainder of the autolysis loop is disordered, it clearly can not be in a trypsinlike orientation. The changes in the autolysis loop create a new interface at the S2′ site. Two hydrogen bonds are formed between BPTI and trypsin at this subsite: the amide nitrogen of Arg17I and the carbonyl oxygen of Phe41 and NE of Arg17I and OE2 of Glu151. The formation of the Arg17I-Glu151 salt bridge requires an adjustment of the Arg17I side chain of BPTI; this salt bridge is solvent exposed and has high B factors (Perona et al. 1993). The interaction between Arg17I and Glu151 is lost in S195A trypsinogen and is replaced with a hydrogen bond between NH1 of Arg17I and the carbonyl oxygen of His40.
K15A trypsinogen
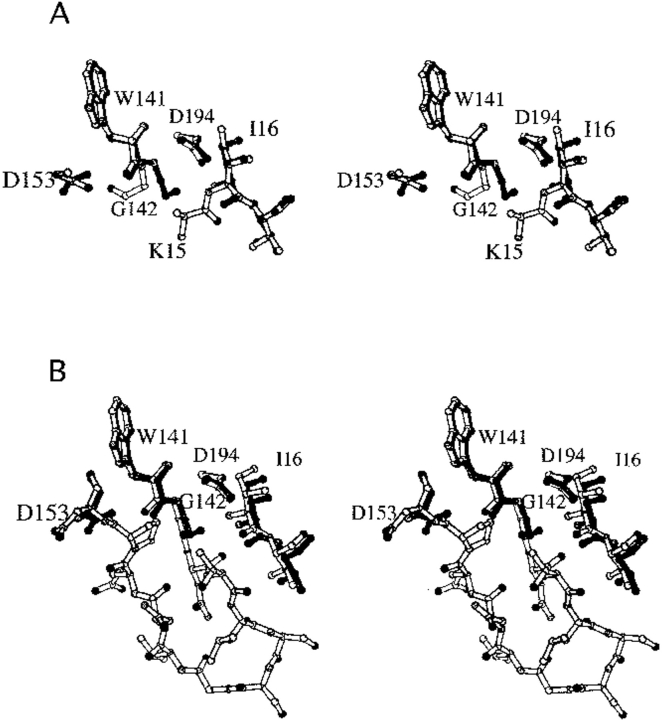
The substitution of Ala for Lys15 increases the activity of trypsinogen by ∼100-fold relative to I16G trypsinogen (a model for wild-type trypsinogen; Table 1; Pasternak et al. 1998). The crystal structure shows that removal of the Lys15 side chain permits the autolysis loop to assume a more trypsinlike conformation (Fig. 6 ▶). The hydrogen bond between the amide nitrogen of Gly142 and the carboxyl group of Asp194 is restored, holding Asp194 in the active conformation. These interactions are expected to stabilize the active trypsinlike conformation. The remainder of the autolysis loop is disordered to Asp153. No interactions are observed between the enzyme and the side chain of P2′ residue Arg17I.
Fig. 6.
Structure of K15A trypsinogen-BPTI complex. (A) Stereo view of S195A trypsinogen (light bonds) and K15A trypsinogen (dark bonds) in their BPTI complexes. Ile16 and Asp194 have similar positions in both structures. In S195A trypsinogen, electron density is only observed for the β carbon of Lys15, whereas electron density is not observed for Ala15 in K15A trypsinogen. The autolysis loop is disordered in both structures, with electron density observed only for Trp141-Gly142 and Asp153. Nevertheless, it is clear that the autolysis loop has different conformations in the two structures as seen by the position of Gly142. The side chain of Lys15 would sterically clash with the autolysis loop conformation observed in the K15A trypsinogen structure. (B) Stereo view of wild-type trypsin (light bonds) and K15A trypsinogen (dark bonds) in their BPTI complexes. The entire autolysis loop is observed in the trypsin structure. The position of Gly142 in K15A trypsinogen is similar to that in trypsin, which suggests that the autolysis loop of K15A trypsinogen has a more trypsinlike conformation than S195A trypsinogen.
ΔI16V17/D194N trypsinogen
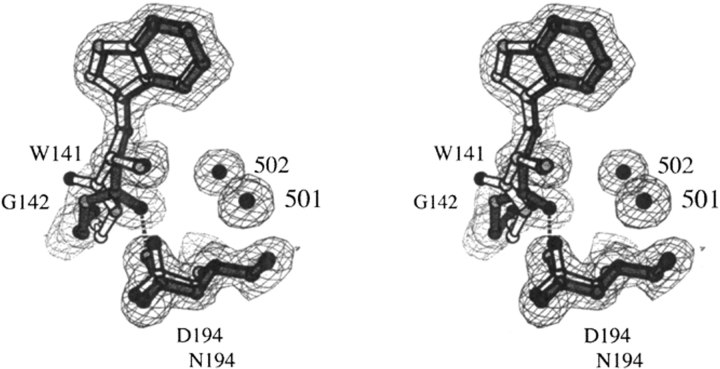
ΔI16V17/D194N trypsinogen is ∼100-fold more active than I16G trypsinogen and ΔI16V17 trypsinogen (Table 1; Pasternak et al. 1998). The crystal structure shows that a hydrogen bond forms between the OD1 oxygen of Asn194 and the amide nitrogen of Cys191 as observed with Asp194 in trypsin. A hydrogen bond also forms between the ND2 amide of Asn194 and the carbonyl oxygen of Trp141 (Fig. 7 ▶). To accommodate this new hydrogen bond, the ξ angle of Trp141 is rotated nearly 180° relative to its position in trypsin. This movement displaces residues 139–141 slightly outward from the Ile16 pocket, forcing the autolysis loop into a new conformation. The autolysis loop is more ordered than in S195A or ΔI16V17 trypsinogen; residues 142, 143, and 149–153 are visible. The S2′ site resembles that of S195A trypsinogen: A hydrogen bond is observed between NH1 of Arg17I and the carbonyl oxygen of His40. On the other side of the Ile16 pocket, residues 18–26 move an average of 0.5 Å inward. The Ile16 pocket contains five water molecules. Water 561 makes a hydrogen bond to the side chain amide of Asn194. A cluster of three weakly bound water molecules (waters 641, 642, and 676) occupy the place where the main chain of Ile16 resides in wild-type trypsin.
Fig. 7.
Structure of the ΔI16V17/D194N trypsinogen-BPTI (light bonds) and trypsin-BPTI complexes (dark bonds). Electron density is from a 2Fo-Fc map drawn at a contour level of 1.0 σ. The psi angle of Trp141 is rotated approximately 180° from its position in trypsin. The hydrogen bond (2.9 Å) between the carbonyl oxygen of Trp141 and the ND2 nitrogen of Asn194 is shown by the dotted lines.
ΔI16V17/Q156K trypsinogen
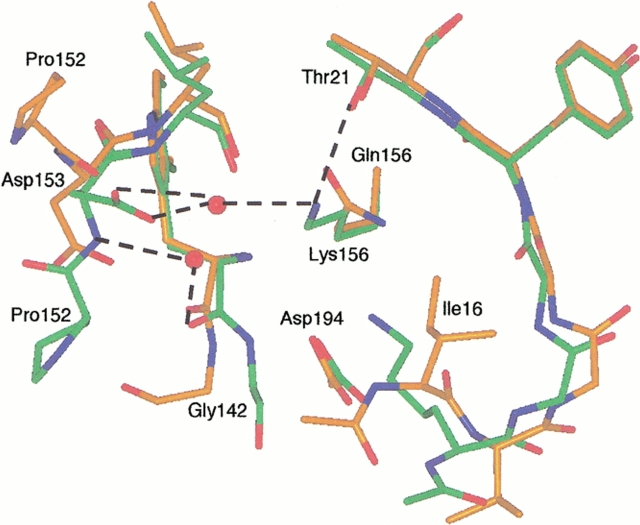
As described above, the Gln156Lys mutation was designed to provide an alternate cation for Asp194. However, the Lys156-Asp194 salt bridge is not observed in the crystal structure of ΔI16V17/Q156K trypsinogen. Instead, the ɛ-amino group of Lys15 moves into the Ile16 pocket and forms a salt bridge with the carboxylate of Asp194. A water molecule also forms a hydrogen bond with the ɛ-amino group of Lys15. These interactions are made possible by the deletion of Ile16Val17 and are also observed in the ΔI16V17 trypsinogen-BPTI complex (see below). The Gln156Lys mutation appears to stabilize the autolysis loop via a hydrogen bond between the ɛ-amino group of Lys156 and the hydroxyl group of Thr21 (Fig. 8 ▶). A water-mediated hydrogen-bonding network forms between Asn143 and the carbonyl oxygen of Leu154. These interactions lock Gly142, Pro152, and Asp153 into trypsinlike conformations and order residues Asn143 and Glu 151. Thus, the autolysis loop appears more ordered and trypsinlike in ΔI16V17/Q156K trypsinogen than in S195A trypsinogen. In addition, a water-mediated salt bridge forms between the ɛ-amino group and the carboxylate of Asp153. This salt bridge does not appear to be required for stabilizing the autolysis loop because Asp153 is also found in alternate conformation that cannot form this salt bridge. The S2′ site resembles that of S195A trypsinogen, with a hydrogen bond between NH1 of Arg17I and the carbonyl oxygen of His40.
Fig. 8.
Structure of the ΔI16V17/Q156K trypsinogen-BPTI (green) and S195A trypsinogen-BPTI complexes (orange). The dashed lines indicate hydrogen bonds. The hydrogen bonding distances are Lys156-Thr21, 3.0 Å; Lys156-water 633, 3.0 Å; and water 633-Asp153, 2.6Å. As in ΔI16V17 trypsinogen, Lys15 forms a salt bridge with Asp194 and can be seen overlaying Ile16 of S195A trypsinogen. The autolysis loop of ΔI16V17/Q156K trypsinogen assumes a trypsinlike conformation and is more ordered than in S195A trypsinogen, with electron density visible for Trp141-Gly142-Asn143 and Pro152-Asp153. Asp153 has two conformations (only one is shown for clarity) in the ΔI16V17/Q156K trypsinogen structure. Although only the β carbon of Lys15 is visible in S195A trypsinogen, it is clear that the side chain of Lys15 would clash with Asn153 in the trypsinlike conformation of ΔI16V17/Q156K trypsinogen.
ΔI16V17 trypsinogen
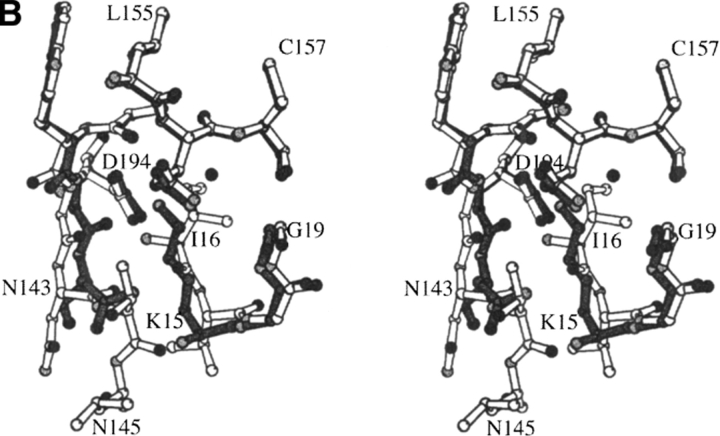
In the BPTI complex, the autolysis loop of ΔI16V17 trypsinogen also assumes a more trypsinlike conformation than S195A trypsinogen (Fig. 9 ▶). This conformation is stabilized by the formation of a salt bridge between the ɛ-amino group of Lys15 and Asp194 as observed in ΔI16V17/Q156K trypsinogen. The autolysis loop has a conformation very similar to that of trypsin and is one residue more ordered (Asn143) than S195A trypsinogen. Gly142 and Asn143 move inward to conform to the Lys15 side chain, whereas residues 152–156 shift away from the Ile16 pocket. The S2′ site resembles that of S195A trypsinogen, with a hydrogen bond between NH1 of Arg17I and the carbonyl oxygen of His40.
Fig. 9.
Structure of the ΔI16V17 trypsinogen-BPTI complex. (A) The Lys15-Asp194 salt bridge. Dashed lines indicate hydrogen bonding distances of 3.0 Å (to OD1) and 2.6 Å (to OD2). Electron density is from a 2Fo-Fc map drawn at a contour level of 1.0 σ. (B) Stereo comparison of the Ile16 pocket of trypsin (white bonds) and ΔI16V17 trypsinogen (dark bonds). In the absence of Ile16-Val17, Lys15 occupies the Ile16 pocket, forming a salt bridge with Asp194. A cavity exists in ΔIle16Val17 trypsinogen-BPTI, where the sidechain of Ile16 would be in wild-type trypsin. Water molecule 560 resides in this cavity. Although the N terminus is not shown beyond residue 15 for ΔIle16Val17 trypsinogen-BPTI, electron density is observed for residue 14.
Discussion
BPTI affinity calibrates the energetic cost of ordering the active site
As expected, BPTI induces a trypsinlike active site conformation in all of the mutant trypsinogens, ordering the S1 site and oxyanion hole. Although the S2′ site interactions are variable, they seem unlikely to contribute a significant amount of binding energy because the P2′ residue Arg17I is solvent accessible and very mobile in all of the complexes. Therefore, we believe that BPTI affinity provides a quantitative measure of the energetic cost of organizing the active sites. However, as observed in the structures of the BPTI complexes of bovine trypsinogen and S195A rat trypsinogen (Huber and Bode 1978; Pasternak et al. 1999), the B factors of the active site residues appear to be significantly higher than for the trypsin-BPTI complex (Table 3). The active sites of the zymogen complexes attain the general architecture of the trypsin but lack the rigidity of the mature enzyme (although this conclusion can not be rigorous given the different resolutions of the structures). If this additional rigidity is important for activity, then BPTI affinity will underestimate the cost of organizing the active site for catalysis.
Table 3.
Average B factors for residues 189–195
| Residue | Trypsin | S195A | ΔI16V17 tgn | ΔI16V17/ D194N tgn | ΔI16V17/ Q156K tgn | K15A |
| 189 | 8.5 | 14.5 | 10.0 | 14.5 | 17.5 | 16.4 |
| 190 | 7.8 | 11.1 | 8.4 | 12.1 | 15.3 | 13.8 |
| 191 | 7.9 | 12.5 | 9.5 | 13.4 | 15.1 | 13.4 |
| 192 | 5.9 | 10.4 | 10.0 | 12.4 | 14.9 | 13.3 |
| 193 | 5.7 | 7.00 | 7.3 | 5.8 | 12.2 | 11.1 |
| 194 | 5.5 | 11.1 | 7.5 | 8.6 | 11.8 | 11.2 |
| 195 | 6.2 | 9.1 | 6.2 | 6.7 | 10.0 | 9.6 |
| Resolution (Å) | 1.8 | 2.2 | 1.7 | 1.7 | 1.65 | 1.55 |
B factors were averaged over all the atoms of the residue.
BPTI complexes recapitulate 55% of the active complex
A correlation is observed between Ki for BPTI inhibition and kcat/Km for substrate hydrolysis for a series of trypsin(ogen) variants. This correlation indicates that the binding energy of BPTI is related to the binding energy of the substrate in the transition state, and suggests that E′ is similar to E* (Fig. 1B ▶). However, the slopes of these correlations are −1.8, not −1 as expected if BPTI induced a perfect trypsinlike conformation. Simply, this slope suggests that 55% of the structural requirements of E • S‡ are manifest in the BPTI complexes. The remaining 45% represents structural features that are not required for BPTI binding. Catalysis may require more precise organization of the active site, as discussed above. A more rigid active site and autolysis loop may be required to shield the active site from solvent. Alternatively, catalysis may require a slightly different conformation than the one induced by BPTI, or dynamic motions that might not be relevant to BPTI binding. As with any correlation of this nature, more examples are more convincing and such work is underway.
Contribution of induced fit to specificity
Fersht's (1974, 1985) treatment indicates that induced fit should not change the specificity in the case in which the chemical transformation is rate limiting. Serine proteases operate via a three-step mechanism consisting of substrate binding, acylation of the active site serine, and deacylation (Fig. 10 ▶). Acylation is most likely rate limiting for the hydrolysis of both Tos-Gly-Pro-Arg-AMC and Tos-Gly-Pro-Lys-AMC by the trypsin(ogen) variants (with the exception of wild type and I16V, in which deacylation is limiting; Hedstrom, et al. 1996). Parallel lines (slope = −1.8) are obtained when the values of kcat/Km are plotted against Ki (Fig. 4 ▶), which shows that induced fit does not change specificity with respect to these two substrates. However, both of these substrates are good substrates of trypsin, with values of kcat/Km in the range of 106 to 107 M−1s−1. It is possible that the discrimination between good and poor substrates will be altered. Unfortunately, data for poorer substrates is unavailable—the activity of the trypsinogen variants can not be assayed with such substrates. However, previous characterization of D194N, I16A, and I16G trypsin variants shows that these mutations have equivalent effects on good and poor substrates (Hedstrom et al. 1996).
Fig. 10.
The serine protease reaction (Bartlett and Marlowe 1983).
Value of Kc′ for wild-type trypsin
The data of Figure 4 ▶ can be used to estimate the value of Kc′ for wild-type trypsin. The values of kcat/Km for wild-type and I16V trypsin lie below the correlation, as expected given that when Kc′ ≥ 1, the value of kcat/Km is reduced by a factor of Kc′/(1 + Kc′). This relationship indicates that the value of Kc′; is ≥50 for wild-type trypsin, which agrees well with the previous estimate of ≥100 (this estimate is only a lower limit because acylation is not rate limiting for wild-trypsin; Hedstrom et al. 1996).
Meaning of transition state analogy
A correlation between kcat/Km and Ki for a series of substrate/inhibitor pairs has been used to show that an inhibitor is a transition state analog (Bartlett and Marlowe 1983; Hanson et al. 1989; Brady and Abeles 1990). This conclusion has also been put forth when a correlation is observed for a series of mutant enzymes and a single substrate/inhibitor pair (Phillips et al. 1992; Hedstrom et al. 1996; Kerr and Hedstrom 1997). However, such conclusions unduly emphasize the relationship between I and S‡. This bias is inconsequential if the enzyme has a rigid structure complementary to S‡, as in the case of trypsin—the structure of the enzyme does not change during the course of the reaction. However, the transition state of an enzymatic reaction clearly must include the enzyme. Therefore, in reality such correlations imply that the structure of the E • I complex recapitulates the structure of the E • S‡ complex. In the case of an enzyme that undergoes conformational changes during a reaction, a correlation will be observed if the inhibitor induces the enzyme conformation found in the transition state. Such is the case for the correlation reported here: BPTI induces the active conformation of the trypsin(ogen) variants, so a correlation is observed between kcat/Km and Ki.
In addition, transition state analogy tends to be narrowly defined based on the geometry and electrostatic properties at the immediate site of chemical transformation, ignoring longer range interactions. For example, peptide aldehydes are readily accepted as transition state analogs of protease reactions because they form tetrahedral adducts similar to the structure of S‡. Although BPTI does not contain such a tetrahedral center, the P3-P1 residues of BPTI are constrained to the canonical conformation that is also an important feature of S‡. Therefore, we believe that BPTI should be considered a transition state analog.
Stability of an enzyme active site is an important component of catalytic power
An enzyme active site presents an electrostatic surface complementary to the charge distribution of S‡. Warshel (1998) and others have argued that the catalytic power of enzymes originates in the preorganization of this electrostatic surface (Cannon and Benkovic 1998). In the uncatalyzed reaction, solvent interactions can also stabilize S‡. However, solvent dipoles must be oriented appropriately. This organization of solvent molecules has an enormous energetic cost. In contrast, the energetic cost of preorganizing the dipoles of the enzyme active site is paid by the favorable energy of protein folding. Thus enzyme catalytic power is "not stored in the enzyme-substrate interaction but in the enzyme itself" (Warshel 1998). This view suggests that catalytic efficiency should be directly related to the folding energy of the enzyme active site. However, the stability of an enzyme active site is difficult to determine. The active site is frequently less stable than the enzyme structure as a whole (Tsou 1993) and can be further obscured if an enzyme undergoes large conformational changes. However, BPTI affinity calibrates the stability of the active site of trypsin(ogen), and the correlation between BPTI affinity and kcat/Km illustrates that catalytic power is stored in the folding energy of the enzyme active site.
Conformational changes must be kinetically competent to contribute to enzyme catalysis
ΔI16V17 trypsinogen is the lone mutant to date in which the correlation between BPTI affinity and activity does not hold: Activity is less than predicted from BPTI affinity (Pasternak et al. 1998). The structure of the BPTI complex of ΔI16V17 trypsinogen does not suggest a reason for this discrepancy; the contacts between BPTI and enzyme are similar to other mutant trypsinogens. The formation of the ΔI16V17 trypsinogen-BPTI complex is much slower than other trypsinogen mutants (Pasternak et al. 1998), which indicates that a kinetic barrier prevents equilibration of the E and E′; a similar kinetic barrier in the formation of E* • S would impair activity.
Implications for the structural determinants of zymogen activity and enzyme specificity in the trypsin family
Serine proteases and their zymogens possess varying degrees of activity depending on their particular physiological functions. For example, rat trypsinogen is 108 times less active than trypsin, whereas the zymogen form of t-PA has activity comparable to the mature enzyme form (Boose et al. 1989; Pasternak et al. 1999). The correlation between BPTI affinity and kcat/Km for the mutant trypsin(ogens) also indicates that zymogen activity can generally be described as a relatively simple problem of conformational equilibrium. In all four structures reported here, the S1 site and oxyanion hole assume a conformation similar to trypsin, and the remainder of the activation domain is more ordered than in S195A trypsinogen. However, the autolysis loops assume different conformations depending on the variant, as do the N-terminal segments. The plasticity of the autolysis loop and N-terminal peptide appear to be key structural determinants of zymogen activity. Manipulating these regions, either by changing their structures or by providing interactions with other cofactors, will regulate enzyme activity.
The redesign of the S1 site of trypsin has proven a difficult task (Hedstrom et al. 1992, 1994). Trypsin can be converted into an enzyme with chymotrypsinlike activity, but this conversion requires substitutions that extend beyond the S1 site. The stability of the S1 site is clearly one of the obstacles to redesign efforts. Therefore the autolysis loop is also likely to be an important structural determinant of protease specificity. The correlation of BPTI affinity with kcat/Km indicates that BPTI variants can be used to screen for proteases with new protease specificity.
Materials and methods
Materials
Tos-Gly-Pro-Arg-AMC and Tos-Gly-Pro-Lys-AMC were purchased from Bachem Biosciences. SBTI-Sepharose was obtained from Sigma Chemical Co. BPTI was obtained from Boehringer. Oligonucleotides were purchased from Operon Technologies.
Construction of rat trypsinogen mutants
Site-directed mutagenesis was performed using the QuikChange method (Stratagene). Mutants were completely sequenced to ensure that only the desired mutations were introduced.
Expression and purification of trypsinogen and trypsin mutants
Recombinant rat trypsinogen II was produced as an α-factor fusion protein in a Saccharomyces cerevisiae expression system and purified as previously described (Hedstrom et al. 1992; Pasternak et al. 1998). Trypsinogens were stored in 1 mM HCl. Trypsinogen concentration was determined by absorbance at 280 nm (e = 34,800 M-1 cm-1).
Activity of trypsinogens
Substrate stock solutions were prepared in dimethylformamide. The final concentration of dimethylformamide in the assays was <2%. Assay mix contained 100 mM NaCl, 10 mM CaCl2, and 50 mM Hepes, pH 8.0. Hydrolysis of the AMC substrates was monitored fluorimetrically, with excitation wavelength at 380 nm and emission wavelength at 460 nm. Assays were performed in 0.1 mL of assay mix containing substrate at 25°C in a PerSeptive Biosystems Cytofluor II multi-well plate reader. The values of kcat, Km, and kcat/Km were determined with KinetAsyst software, and the reported values are the average of at least two experiments.
Crystallization
The mutant trypsinogens were concentrated to 10 to 15 mg/mL in 1 mM HCl and mixed with 1.1 equivalents of BPTI. CaCl2 was added to a final concentration of 10 mM. Crystals were obtained via hanging drop vapor diffusion at room temperature. Drops contained 5 μL of the protein solution and 5 æL of the well solution. A crystal of ΔI16V17/D194N trypsinogen-BPTI was grown from 24% PEG 3350, 0.2 M LiSO4, and 0.1 M Tris, pH 8.5. A crystal of ΔI16V17 trypsinogen-BPTI was grown from 35% PEG 4000, 0.2 M LiSO4, and 0.1 M Tris, pH 8.5. K15A trypsinogen-BPTI complex was grown in 26% PEG 3350, 0.2 M LiCl, 0.1 M Tris, pH 8.0, at 4°C. ΔI16V17/Q156K trypsinogen-BPTI was grown from 22% PEG 3380, 0.3 M ammonium acetate, 0.1 M sodium citrate, pH 6.5.
Structure determination
Data on a single ΔI16V17/D194N trypsinogen-BPTI crystal were collected at 4°C with a scan width of 0.5° per frame and an exposure time of 30 min per frame for 40° on an R-AXIS IIC image plate system mounted on a Rigaku RU-200B X-ray generator running at 45 kV and 120 mA. Data on a single ΔI16V17 trypsinogen-BPTI crystal were collected similarly for a total of 90°. Data on a single crystal of K15A trypsinogen-BPTI complex were collected at 4°C with a scan width of 0.5° per frame and an exposure time of 20 min per frame for 75° on an R-AXIS IV image plate system mounted on a Rigaku RU-300B, run at 40 kV and 30 mA. Data on a single crystal of ΔI16V17/Q156K trypsinogen-BPTI complex were collected at 4°C with a scan width of 1° per frame and an exposure time of 15 min per frame for a total of 80° on a R-AXIS IV image plate system mounted on a Rigaku RU-300 X-ray generator running at 38 kV and 28 mA and 1.5418 Å wavelength. For all of the structures, frames were integrated and the data were scaled and merged together using the HKL package (DENZO and SCALEPACK) from Molecular Structures Corp. (Table 3).
All of the crystals were isomorphous to structures of other rat trypsin and trypsinogen-BPTI complexes (Perona et al. 1993; Pasternak et al. 1999). The initial model for the ΔI16V17 trypsinogen-BPTI complex was the Ser195Ala trypsinogen-BPTI complex (PDB code 3TGJ; Pasternak et al. 1999). The initial model for the ΔI16V17/D194N trypsinogen-BPTI complex was the ΔI16V17 trypsinogen-BPTI complex (PDB code 1FY8). The initial model for the K15A trypsinogen-BPTI complex was the wild-type trypsin plus BPTI complex (PDB entry 3TGI; Pasternak et al. 1999). The initial model for the ΔI16V17/Q156K trypsinogen-BPTI complex was the ΔI16V17 trypsinogen-BPTI complex (PDB code 1FY8). The ΔI16V17 trypsinogen-BPTI and ΔI16V17/D194N trypsinogen-BPTI structures were refined using the X-PLOR package (Brünger et al. 1987), with 10% of the data set aside to compute Rfree (Brünger 1992). Initially, an overall temperature factor of 20 Å2 was used. Rigid body refinement was performed, treating trypsinogen and BPTI as separate rigid bodies. Positional refinement and B-factor refinement were monitored by the Rfree to prevent overrefinement (Brünger 1992). Water molecules were added in three rounds using the waterpick script in X-PLOR, keeping waters for which electron density was seen both in the difference Fourier electron density map with coefficients Fo-Fc, and in the difference Fourier electron density map with coefficients 2Fo-Fc. In addition, after refinement the waters were required to be within hydrogen bond distance (3.4 Å) from hydrogen bond donors or acceptors, and waters with temperature factors greater than 60 Å2 were deleted from the models. Disordered residues were omitted from the structure factor calculation. Simulated annealing omit maps (1000 K to 300 K; Hodel et al. 1982) were calculated in attempts to locate the autolysis loop and the N-terminus, and were also used in positioning the residues at the boundaries of these regions. These residues were included in structure factor calculations for the subsequent refinement. Examination of and manual adjustments to the structure were performed between rounds of refinement using the program O (Jones et al. 1991) on a Silicon Graphics workstation. Ramachandran plots generated by PROCHECK (Laskowski et al. 1993) on the final coordinates indicated that all residues in both structures fell into the "most favored" or "allowed" regions. The ΔI16V17/Q156K trypsinogen-BPTI structure was refined using the CNS package (Brunger et al. 1998), with 10% of the data set aside to compute Rfree. The starting overall temperature factor was 15.0 Å2. Rigid body refinement was performed treating trypsinogen and BPTI as separated rigid bodies. Examination and manual adjustment of the structure were performed between rounds of refinement using the program O on a Silicon Graphics work station. The K15A trypsinogen-BPTI complex structure was refined using the CNS package (Brunger et al. 1998) with 10% of the data set aside to compute Rfree. The starting overall temperature factor was 15.0 Å2. Rounds of refinement were alternated with manual adjustments using the program O (Jones et al. 1991) on a Silicon Graphics workstation. Water molecules were added as described above for the ΔI16V17 trypsinogen-BPTI and ΔI16V17/D194N trypsinogen-BPTI structures. Figures were created using the programs MOLSCRIPT (Kraulis 1991) and Insight.
The crystal structures reported in this paper have been submitted to the Protein Data Bank under the following accession numbers: K15A trypsinogen-BPTI, 1F7Z; ΔI16V17 trypsinogen-BPTI, 1FY8; ΔI16V17/Q156K trypsinogen-BPTI, 1F5R; and ΔI16V17/D194N trypsinogen-BPTI, 3TGK.
Acknowledgments
This work was supported by NIH HL50366 (L.H.), NIH Molecular Structure and Function Training Grant GM07956 (N.M.), and a grant from the Lucille P. Markey Charitable Trust to Brandeis University. We are indebted to Adrian Whitty for thoughtful criticism.
The publication costs of this article were defrayed in part by payment of page charges. This article must therefore be hereby marked "advertisement" in accordance with 18 USC section 1734 solely to indicate this fact.
Abbreviations
AMC, 7-amino-4-methylcoumarin
BPTI, bovine pancreatic trypsin inhibitor
PSTI, porcine pancreatic secretory trypsin inhibitor
t-PA, tissue type plasminogen activator
u-PA, urokinase type plasminogen activator
Article and publication are at www.proteinscience.org/cgi/doi/10.1110/ps.44101.
Footnotes
Chymotrypsinogen numbering is used throughout. BPTI residues are denoted with "I," as in Arg17I.
Unfortunately, rat anionic trypsinogen rapidly autoactivates. Since trypsin is approximately 107-fold more active than trypsinogen, a minute amount of trypsin contamination will dominate an activity measurement, so that it is impossible to determine the activity of trypsinogen directly. Therefore we estimate the activity of trypsinogen based on the activity of I16G, ΔI16 and ΔI16V17 trypsinogens (Hedstrom et al. 1996).
References
- Bartlett, P.A. and Marlowe, C.K. 1983. Phosphonoamidates as transition state analogue inhibitors of thermolysin. Biochemistry 22 4618–4624. [DOI] [PubMed] [Google Scholar]
- Bode, W. and Huber, R. 1976. Induction of the bovine trypsinogen-trypsin transition by peptides sequentially similar to the N terminus of trypsin. FEBS Lett. 68 231–236. [DOI] [PMC free article] [PubMed] [Google Scholar]
- Bolognesi, M., Gatti, G., Menegatti, E., Guarneri, M., Marquart, M., Papamokos, E., and Huber, R. 1982. Three dimensional structure of the complex between pancreatic secretory trypsin inhibitor (Kazal type) and trypsinogen at 1.8 α resolution: Structure solution, crystallographic refinement and preliminary structural interpretation. J. Mol. Biol. 162 839–868. [DOI] [PubMed] [Google Scholar]
- Boose, J.A., Kuismanen, E., Gerard, R., Sambrook, J., and Gething, M.-J. 1989. The single chain form of tissue-type plasminogen activator has catalytic activity: Studies with a mutant enzyme that lacks the cleavage site. Biochemistry 28 635–643. [DOI] [PubMed] [Google Scholar]
- Brady, K. and Abeles, R.H. 1990. Inhibition of chymotrypsin by peptidyl trifluoromethyl ketones: Determinants of slow binding kinetics. Biochemistry 29 7608–7617. [DOI] [PubMed] [Google Scholar]
- Brünger, A.T. 1992. Free R value: A novel statistical quantity for assessing the accuracy of crystal structures. Nature 355 472–475. [DOI] [PubMed] [Google Scholar]
- Brunger, A.T., Adams, P.D., Clore, G.M., DeLano, W.L., Gros, P., Grosse-Kunstleve, R.W., Jiang, J.S., Kuszewski, J., Nilges, M., Pannu, N.S., et al. 1998. Crystallography & NMR system: A new software suite for macromolecular structure determination. Acta Crystallogr. D Biol. Crystallogr. 54 905–921. [DOI] [PubMed] [Google Scholar]
- Brünger, A.T., Kuriyan, J., and Karplus, M. 1987. Crystallographic R-factor refinement by molecular dynamics. Science 235 458–460. [DOI] [PubMed] [Google Scholar]
- Cannon, W.R. and Benkovic, S.J. 1998. Solvation, re-organization energy and biological catalysis. J. Biol. Chem. 273 26257–26260. [DOI] [PubMed] [Google Scholar]
- Fehlhammer, H., Bode, W., and Huber, R. 1977. Crystal structure of bovine trypsinogen at 1.8 α resolution. II. Crystallographic refinement, refined crystal structure and comparison with bovine trypsin. J. Mol. Biol. 111 415–438. [DOI] [PubMed] [Google Scholar]
- Fersht, A.R. 1974. Catalysis, binding and enzyme-substrate complementarity. Proc. R. Soc. Lond. B. 187 397–407. [DOI] [PubMed] [Google Scholar]
- ———. 1985. Enzyme structure and mechanism, 2nd ed. W.H. Freeman and Co., New York.
- Hanson, J.E., Kaplan, A.P., and Bartlett, P.A. 1989. Phosphonate analogues of carboxypeptidase A substrates are potent transition-state analogue inhibitors. Biochemistry 28 6294–6305. [DOI] [PubMed] [Google Scholar]
- Hedstrom, L., Szilagyi, L., and Rutter, W.J. 1992. Converting trypsin to chymotrypsin: The role of surface loops. Science 255 1249–1253. [DOI] [PubMed] [Google Scholar]
- Hedstrom, L., Perona, J., and Rutter, W.J. 1994. Converting trypsin to chymotrypsin: Residue 172 is a substrate specificity determinant. Biochemistry 33 8757–8763. [DOI] [PubMed] [Google Scholar]
- Hedstrom, L., Lin, T.-Y., and Fast, W. 1996. Hydrophobic interactions control zymogen activation in the trypsin family of serine proteases. Biochemistry 35 4515–4523. [DOI] [PubMed] [Google Scholar]
- Herschlag, D. 1988. The role of induced fit and conformational changes in specificity and catalysis. Bioorg. Chem. 16 62–96. [Google Scholar]
- Hodel, A., Kim, S.-H., and Brünger, A.T. 1982. Model bias in macromolecular crystal structures. Acta. Cryst. A 48 851–858. [Google Scholar]
- Huber, H. and Bode, W. 1978. Structural basis for the activation and action of trypsin. Acct. Chem. Res. 11 114–122. [Google Scholar]
- Jones, T.A., Zou, J.-Y., Cowan, S.W., and Kjeldgaard, M. 1991. Improved methods for building models in electron density maps and the location of errors in these models. Acta. Cryst. A 47 110–119. [DOI] [PubMed] [Google Scholar]
- Kerr, K.M., and Hedstrom, L. 1997. The roles of conserved carboxylate residues in IMP dehydrogenase and identification of a transition state analog. Biochemistry 36 13365–13373. [DOI] [PubMed] [Google Scholar]
- Koshland, D.E. 1958. Application of a theory of enzyme specificity to protein synthesis. Proc. Natl. Acad. Sci. 44 98–104. [DOI] [PMC free article] [PubMed] [Google Scholar]
- Kossiakoff, A.A., Chambers, J.L., Kay, L.M., and Stroud, R.M. 1977. Structure of bovine trypsinogen at 1.8 α resolution. Biochemistry 16 654–664. [DOI] [PubMed] [Google Scholar]
- Kraulis, P.J. 1991. MolScript: A program to produce both detailed and schematic plots of protein structures. J. Appl. Cryst. 24 946–950. [Google Scholar]
- Laskowski, R.A., MacArthur, M.W., Moss, D.S., and Thornton, J.M. 1993. PROCHECK: A program to check the stereochemical quality of protein structures. J. Appl. Cryst. 26 283–291. [Google Scholar]
- Pasternak, A., Liu, X., Lin, T.-Y., and Hedstrom, L. 1998. Activating a zymogen without proteolytic processing: mutation of Lys15 and Asp194 activates trypsinogen. Biochemistry 37 16201–16210. [DOI] [PubMed] [Google Scholar]
- Pasternak, A., Ringe, D., and Hedstrom, L. 1999. Comparison of anionic and cationic trypsinogens: The anionic activation domain is more flexible in solution and differs in its mode of BPTI binding in the crystal structure. Protein Science 8 253–258. [DOI] [PMC free article] [PubMed] [Google Scholar]
- Perona, J.J., Hsu, C.A., Craik, C.S., and Fletterick, F.J. 1993. Crystal structures of rat anionic trypsin complexed with the protein inhibitors APPI and BPTI. J. Mol. Biol. 230 919–933. [DOI] [PubMed] [Google Scholar]
- Phillips, M.A., Kaplan, A.P., Rutter, W.J., and Bartlett, P.A. 1992. Transition state characterization: A new approach combining inhibitor analogues and variation in enzyme structure. Biochemistry 31 959–963. [DOI] [PubMed] [Google Scholar]
- Post, C.B. and Ray, W.J., Jr. 1995. Reexamination of induced fit as a determinant of substrate specificity in enzymatic reactions. Biochemistry 34 15881–15885. [DOI] [PubMed] [Google Scholar]
- Renatus, M., Engh, R.A., Stubbs, M.T., Huber, R., Fischer, S., Kohnert, U., and Bode, W. 1997. Lysine 156 promotes the anomalous proenzyme activity of tPA: X-ray crystal structure of single-chain human tPA. EMBO J. 16 4797–4805. [DOI] [PMC free article] [PubMed] [Google Scholar]
- Schechter, I. and Berger, A. 1967. On the size of the active site in proteases. I. Papain. Biochem. Biophys. Res. Commun. 27 157–162. [DOI] [PubMed] [Google Scholar]
- Tsou, C.-L. 1993. Conformational flexibility of enzyme active sites. Science 262 380–381. [DOI] [PubMed] [Google Scholar]
- Vincent, J.-P. and Lazdunski, M. 1972. Trypsin-pancreatic trypsin inhibitor association. Dynamics of the interaction and role of disulfide bridges. Biochemistry 11 2967–2977. [DOI] [PubMed] [Google Scholar]
- Warshel, A. 1998. Electrostatic origin of the catalytic power of enzymes and the role of pre-organized active sites. J. Biol. Chem. 273 27035–27038. [DOI] [PubMed] [Google Scholar]
- Wolfenden, R. 1974. Enzyme catalysis: conflicting requirements of substrate access and transition state affinity. Mol. Cell. Biochem. 3 207–211. [DOI] [PubMed] [Google Scholar]


