

Abstract
The DNA-repair protein XPA is required to recognize a wide variety of bulky lesions during nucleotide excision repair. Independent NMR solution structures of a human XPA fragment comprising approximately 40% of the full-length protein, the minimal DNA-binding domain, revealed that one-third of this molecule was disordered. To better characterize structural features of full-length XPA, we performed time-resolved trypsin proteolysis on active recombinant Xenopus XPA (xXPA). The resulting proteolytic fragments were analyzed by electrospray ionization interface coupled to a Fourier transform ion cyclotron resonance mass spectrometry and SDS-PAGE. The molecular weight of the full-length xXPA determined by mass spectrometry (30922.02 daltons) was consistent with that calculated from the sequence (30922.45 daltons). Moreover, the mass spectrometric data allowed the assignment of multiple xXPA fragments not resolvable by SDS-PAGE. The neural network program Predictor of Natural Disordered Regions (PONDR) applied to xXPA predicted extended disordered N- and C-terminal regions with an ordered internal core. This prediction agreed with our partial proteolysis results, thereby indicating that disorder in XPA shares sequence features with other well-characterized intrinsically unstructured proteins. Trypsin cleavages at 30 of the possible 48 sites were detected and no cleavage was observed in an internal region (Q85-I179) despite 14 possible cut sites. For the full-length xXPA, there was strong agreement among PONDR, partial proteolysis data, and the NMR structure for the corresponding XPA fragment.
Keywords: XPA, mass spectrometry, intrinsic disorder, partial proteolysis, unstructured proteins, DNA repair
DNA repair cannot occur unless the lesion on the DNA is detected by the damage-recognition protein(s). DNA damage recognition is likely to be a dynamic process capable of distinguishing a wide variety of lesions and accompanied by interactions with other DNA-repair proteins (Sugasawa et al. 1998; Araujo and Wood 1999; Wakasugi and Sancar 1999). Xeroderma pigmentosum group A protein (XPA) is a crucial component of the nucleotide excision repair (NER) pathway (Friedberg et al. 1995). The structure of full-length XPA has proved intractable by both NMR and X-ray crystallography, and there is only limited structural knowledge for approximately 40% of the protein, the minimal binding domain (MBD). NMR solution structures of the MBD revealed that one-third of its amino acids could not be assigned (Buchko et al. 1998; Ikegami et al. 1998). XPA is a potential example of an intrinsically unstructured protein whose flexibility facilitates complex interactions without sacrificing specificity. To further test this hypothesis, we studied full-length, active protein to determine whether the remaining 60% of XPA is ordered or disordered.
Structural insights into the role of XPA in damage recognition may result from limited proteolysis in solution (Manalan and Klee 1983; Fontana et al. 1986; Hubbard et al. 1994; Weinreb et al. 1996) coupled with mass spectrometry (Massotte et al. 1993; Cohen et al. 1995; Bothner et al. 1998; Gervasoni et al. 1998). Partial proteolysis can identify regions of reduced stability, domain borders, and linker regions. Resistance to proteolysis correlates most strongly with enhanced structural stability (Hubbard et al. 1994, 1998). Traditional proteolysis strategies used chromatographic and electrophoretic techniques coupled with N-terminal sequencing of the partial proteolysis fragments. In contrast, Fourier transform ion cyclotron resonance (ESI-FTICR) mass spectrometry is particularly well-suited to the analysis of complex mixtures of proteins and protein fragments (Pasa-Tolic et al. 1999). Very precise measurements requiring small quantities (1–10 ng) can be completed within minutes so that both the N and C termini can be mapped unambiguously. For example, a single ESI-FTICR mass spectrum yielded high mass measurement accuracy and 100% sequence coverage of enzymatically digested bovine serum albumin (Bruce et al. 1999). Thus, ESI-FTICR mass spectrometry provides a powerful combination of simultaneous mass measurement accuracy (greater confidence for identification), speed, resolution, and sensitivity.
Here, we combine SDS-PAGE with ESI-FTICR mass spectrometry to define partial tryptic products and obtain structural insights about full-length xXPA that has a nanomolar DNA binding constant (L.M. Iakoucheva, R. Walker, B. Van Houten, and E.J. Ackerman, in prep.) and is active in DNA repair (Ackerman and Iakoucheva 2000). The proteolysis results were compared with predictions by the neural network program Predictor Of Natural Disordered Regions (PONDR), designed to identify disorder in protein structure. The strong agreement between ESI-FTICR data and PONDR on the full-length protein (as well as the NMR structure of human XPA fragment) indicate our approach is applicable to other proteins. The presence of disordered regions in XPA adds another example to a growing list of intrinsically unstructured proteins, thus supporting a recent call for the reassessment of the protein structure–function paradigm (Wright and Dyson 1999).
Results
ESI-FTICR analysis of full-length xXPA
The full-length Xenopus XPA protein sequence aligned with the human MBD (hMBD) is shown in Figure 1A ▶1. xXPA protein contains 265 amino acids and 48 potential trypsin cleavage sites. xXPA shares 67% amino acid identity and 82% similarity with human XPA (hXPA); the N-terminal domain has 74% identity and the C-terminal domain has 90% identity (Shimamoto et al. 1991). hMBD consists of 122 amino acids, and it was defined by limited proteolysis and retention of DNA-binding activity. There is 80% identity and 94% similarity between hMBD and its corresponding region in xXPA. An ESI-FTICR mass spectrum of intact, full-length xXPA protein is presented in Figure 1B ▶. These data were acquired without any prior desalting of the sample and showed salt-adduction (mostly K+). Nonetheless, the measured molecular weight of the most abundant isotopic peak of the protein (30922.02 daltons) agrees with the calculated molecular weight (30922.45 daltons). Moreover, the observed isotopic distribution is highly consistent with the expected one (deconvoluted zero charge state spectrum; inset, Fig. 1B ▶).
Fig. 1.


(A) Full-length Xenopus XPA sequence aligned with hMBD. The Zn-finger (shaded) and poly-Glu domain (box) are labeled. The human MBD sequence begins on the second line. (B) ESI-FTICR mass spectrum of the full-length xXPA showing a large distribution of charge states from 20+ to 34+. The measured molecular weight of the pure protein (most abundant isotopic peak =30922.02 daltons) was in good agreement with the mass predicted from the sequence (calculated most abundant isotopic peak = 30922.45 daltons), and the observed isotopic distribution was consistent with the calculated one (inset).
Partial tryptic digestion of xXPA: SDS-PAGE
Correlating polypeptide disorder with protease sensitivity requires determination of both the locations and amounts of cleavage. Partial proteolysis at 1:200 and 1:2000 trypsin:XPA (w/w) (Fig. 2 ▶) revealed several dominant bands between ∼14 to 36 kD, thereby showing that some potential cleavage sites are preferred. The Coomassie-stained gel provides a clear picture of the time course and the amounts of cleavage for the partial-digestion reactions. Quantitative analysis (Fig. 2B ▶) of the three most abundant high molecular weight bands indicates a probable precursor–product relationship among the subset of accessible tryptic sites that generated these bands. The digestion conditions span the proper range from few to multiple cuts per molecule; i.e., from only one large dominant XPA band (filled diamonds in Fig. 2 ▶) to nearly complete cleavage of the smallest dominant band (filled triangles in Fig. 2 ▶).
Fig. 2.

(A) SDS-PAGE of xXPA partial tryptic digestion. Thirty μg of purified xXPA was digested at 1:2000 (w/w) trypsin:XPA (lanes 1–5) and at 1:200 (lanes 6–10). Aliquots were removed at 5 min (lanes 1,6), 15 min (lanes 2,7), 30 min (lanes 3,8), 60 min (lanes 4,9), and 120 min (lanes 5,10) and resolved by 4%–20% gradient SDS-PAGE. (MWM) Molecular weight marker (lane 12), Broad Range Protein Markers, New England BioLabs. Mobility of intact xXPA (lane 11) corresponds to ∼40 kD. The three dominant bands are indicated with a filled diamond, open square, and filled triangle. (B) Quantitation of the three dominant XPA fragments resulting from partial proteolysis. The Coomassie-stained gel was scanned, analyzed with NIH Image (v1.6.1), and quantities of each band indicated by the filled diamond, open square, and filled triangle in Fig. 2A ▶ were plotted vs. gel lane number.
SDS-PAGE lacks sufficient resolution to precisely identify discrete proteolysis fragments, especially those of similar size. The three dominant bands indicated with symbols in Figure 2 ▶ may each consist of several fragments. An additional problem with SDS-PAGE analysis is aberrant mobility. The intact xXPA shows mobility corresponding to 40 kD despite a calculated mass of 30922.45 daltons, nearly 40% larger than expected. Most of the fragments also migrate with anomalous apparent molecular weights (Fig. 2 ▶), confounding the assignment of fragments to their locations in the sequence. Thus, partial proteolysis fragments were subjected to further analysis by ESI-FTICR.
Partial tryptic digestion of xXPA: ESI-FTICR mass spectrometry
ESI-FTICR mass spectrometry provides precise mass determination of individual fragments within complex mixtures and deduction of the sequence corresponding to each fragment, even for similarly sized polypeptides that are unresolved by SDS-PAGE. A summary of all fragments covering the entire XPA sequence from multiple experiments at 1:200 and 1:2000 trypsin:xXPA (w/w) detected by ESI-FTICR mass spectrometry is shown in Figure 3 ▶. At 1:2000 trypsin:XPA (w/w), we found a protease-resistant core that remained uncut after 60 min digestion even though cuts were already observed outside this region after just 5 min (data not shown). Combining data from all time points at these two trypsin:xXPA ratios revealed a total of 43 fragments, yet only 30 of the possible 48 sites were cleaved.
Fig. 3.

Summary of all xXPA partial tryptic fragments identified by ESI-FTICR mass spectrometry. All potential cleavage sites are indicated as white lines in the black bar representing full-length xXPA. Amino acid positions for each fragment's N and C termini are indicated.
Integrating SDS-PAGE and ESI-FTICR data
SDS-PAGE reveals the proteolysis time course, although it cannot identify fragments. ESI-FTICR mass spectrometry is a high-resolution method to identify tryptic fragments, but quantitation of the relative amounts of individual fragments is problematic. The ineffectiveness of integrating peak heights is illustrated by examining the ESI-FTICR data from an HPLC-purified fraction of a 45-min digestion at 1:2000 trypsin:xXPA (w/w) (Fig. 4 ▶). SDS-PAGE analysis of this fraction revealed that it corresponded to the smallest of the three dominant bands; i.e., filled triangles in Figure 2 ▶. The highly convoluted spectrum clearly showed there were different charge states of mainly four fragments, all beginning at position Q85 and terminating at R199, R203, K205, and K207. Although we cannot readily quantitate amounts of various peptides relative to each other (or fragments resulting from cleavage at other sites), no fragments were ever detected at 18 other possible target sites in the protein. Thus, we conclude position R84 was more accessible to protease than the uncut sites.
Fig. 4.

ESI-FTICR mass spectrometry of fragments separated by reverse-phase HPLC. ESI-FTICR mass spectra for one recovered fraction from reverse-phase chromatography after 45-min digestion with 1:200 (w/w) of trypsin:xXPA. The full spectrum was highly convoluted because of the presence of several charge states of the same fragments (insets). Charge state deconvolutions of regions containing isotopic distributions detected by the Horn Mass Transform algorithm (Horn et al. 2000) are shown in insets.
There is an interesting close correlation between unique fragments at particular sites observed by ESI-FTICR mass spectrometry with the SDS-PAGE data. Trypsin cleavage, or lack thereof, observed at each of the 48 possible sites over all experiments revealed there are certain preferred trypsin cleavage sites, and certain target sites are never cut (Fig. 5 ▶). A baseline score means no fragments with an N or C terminus at the indicated position were detected. A nonzero score means there were precisely that number of unique fragments with the same N terminus but different C termini (and/or different N termini with a unique C terminus). For example, the 11 fragments at the ninth cleavage site consisted of 1 unique fragment terminating at R39 and 10 unique fragments originating at L40; hence the Y-axis score of 11 at R39. Positions L40, V60, and Q85 produced the greatest number of unique fragments in the N-terminal region: 11, 4, and 4, respectively. These sites exactly correspond to the dominant bands on SDS-PAGE (Fig. 2A ▶).
Fig. 5.

Summary of cleavage site frequency. All detected unique fragments for trypsin:xXPA 1:200 and 1:2000 (w/w) at 5, 15, 30, 45, and 60 min were analyzed. Each of the 48 possible cleavage positions is indicated on the X-axis beginning with K11 and ending with K264; the Y-axis shows the number of unique detected fragments resulting from cleavage at each possible position. The cleavage positions in the xXPA sequence for the major sites in the N-terminal region are indicated above the peaks (filled diamond, open square, and filled triangle, as in Fig. 2 ▶).
PONDR analysis of xXPA
Our proteolysis data show long regions of either disorder or flexibility in xXPA, thereby providing an opportunity to evaluate the reliability of PONDR, a neural network predictor originally developed from literature searches of intrinsically ordered and disordered regions in proteins (Romero et al. 1997; Li et al. 1999). PONDR analysis of full-length Xenopus XPA was correlated with the proteolysis data and NMR structure of XPA fragment (hMBD) (Fig. 6 ▶). Predicted scores for residues ≥0.5 signify disorder. PONDR predicts long disordered regions at or near xXPA ends, from M1-A55 and S63-P88 at the N terminus and from L183 to E230 near the C terminus. PONDR also predicts an internal ordered core that is similar to the hMBD, consistent with no detectable trypsin cleavage between Q85-I179 despite 14 potential sites. Thus, there was strong agreement between PONDR and ESI-FTICR mass spectrometry data for the full-length XPA, as well as the NMR structure for the hMBD.
Fig. 6.

Comparison of proteolysis data with PONDR predictions and NMR structure. (Top) Full-length Xenopus XPA is depicted as a line, interspersed with all possible trypsin sites as white vertical lines (Xenopus numbering). The line below represents hMBD in the same format. Based on the refined NMR structure of hMBD (Buchko et al. 1999a), four regions with low certainty of assignment or high flexibility are indicated in gray. Assigned structural regions (α, α-helix; β, β-sheet; t, turn) are depicted below hMBD with black vertical lines separating each region. Each of the unique, experimentally observed, 1:200 and 1:2000 (w/w) trypsin:XPA proteolysis fragments corresponding to the three dominant bands on the SDS–polyacrylamide gel in Fig. 2 ▶ (filled diamond, open square, and filled triangle) are drawn as horizontal lines below. (Bottom) PONDR prediction of order/disorder in xXPA. Each residue (X-axis) is assigned a disorder score (Y-axis) by the predictor based on the attributes of amino acids surrounding the residue. Predicted scores for residues ≥0.5 signify disorder.
Some of the 51 attributes used by PONDR to assign disorder include a low aromatic content, the presence of charged residues, a large net charge, and a low value for the average side chain coordination number, which is the average number of neighboring amino acids in buried side chains. The values for 10 selected attributes were compared for groups of ordered and disordered domains (Fig. 7 ▶), with positive values greater for disordered than for ordered, and with negative values for the reverse. For example, the net charge of disordered protein families is higher (i.e., positive Δ/NRL 3D) than the net charge for ordered proteins whereas the aromatic compositions are lower for disordered proteins (i.e., negative Δ/NRL 3D). Overall, XPA's attribute values are different from typical ordered protein and rather similar to the averages for the well-characterized disordered segments.
Fig. 7.

Comparison of PONDR attributes for the XPA N-terminal region to disordered protein families. VL1 (white bars) is one of the databases of disordered sequences from 15 different proteins used to train PONDR. Disordered sequences from three representative protein families (calcineurin [dense diagonal pattern], histone H5 [square pattern], and prions [wide diagonal pattern]) were compared with the first 97 residues of 10 XPAs (seven species; black bars). The calcineurin data set contained 21 sequences (14 species) for the amino acids that align with the known disordered region (374–468) of human calcineurin. The histone H5 data set consisted of nine sequences (seven species) for the amino acids that align with the known disordered region (101–185) of chicken histone H5. The known disordered region (23–120) of mouse prion and the corresponding regions of 70 other prions were analyzed. Coordination number reflects how frequently a given amino acid is found internally vs. externally in a protein. Net charge is the absolute value in a window of 21 amino acids. The Y-axis is the difference between the indicated protein family composition and database of all known protein structures (NRL 3D) divided by the composition of the structure database (Δ/NRL 3D). When an amino acid attribute is below zero, the disordered family has less of that attribute than ordered proteins; above zero indicates the reverse.
Comparison of PONDR to programs that predict secondary structure
PONDR predictions for ordered and disordered regions of xXPA agree well with the partial proteolysis results and the NMR of the hMBD fragment (Fig. 6 ▶). There are important differences between secondary structure and order/disorder predictions. Secondary structure programs are very helpful but were not designed to predict disorder. In Figure 8 ▶, order/disorder predictions are compared with the results from three programs widely used to predict secondary structure: PHD (Rost and Sander 1994), SSP-Baylor (Solovyev and Salamov 1994), and Chou-Fasman (Chou and Fasman 1978). For the highly protease-sensitive N- and C-terminal regions of XPA, these programs all predicted large amounts of helix and substantial amounts of random coil, but almost no sheet (Fig. 8 ▶). These results emphasize the lack of correlation between predictions of disorder versus random coil, as might be expected, and also the negative correlation between predictions of disorder versus sheet. Such results are not specific for XPA, but are likely to be general as indicated from the analysis of disordered regions from 157 nonredundant proteins totaling more than 18,000 residues (Williams 2001).
Fig. 8.
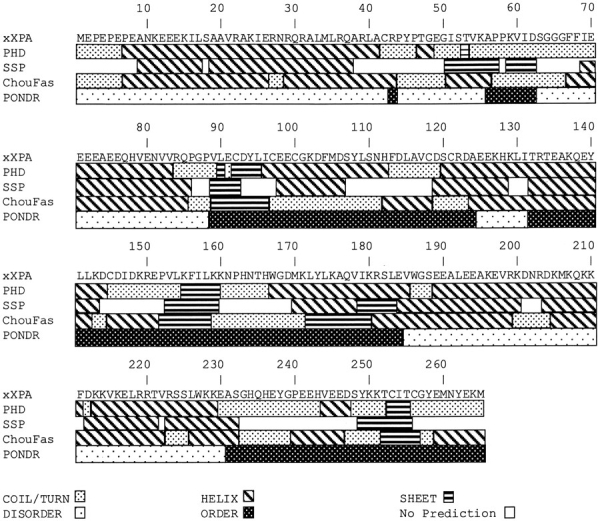
Comparison of PONDR's order/disorder predictions for xXPA to three programs that predict secondary structure. xXPA was analyzed by the programs PHD (Rost and Sander 1994), available at http://cubic.bioc.columbia.edu/predictprotein/; SSP-Baylor (Solovyev and Salamov 1994), available at http://dot.imgen.bcm.tmc.edu:9331/pssprediction/pssp.html; and Chou-Fasman (Chou and Fasman 1978) (Wisconsin Package Version 10.0, Genetics Computer Group). (Heavy stippled pattern) Coils and turns, (diagonal stripes) helices, (horizontal stripes) sheets, (light stippled pattern) disorder, (dark stippled pattern) order, (white) no prediction.
Discussion
Intrinsic disorder and flexibility
The distinction between flexibility and disorder is sometimes blurred. Disorder is characterized experimentally by missing regions of electron density in crystal structures (Bode et al. 1978; Huber 1979; Kissinger et al. 1995), NMR spectra concordant with the absence of tertiary structure (Aviles et al. 1978; Riek et al. 1996; Daughdrill et al. 1997; Fletcher et al. 1998), far-UV CD spectra indicating random coils (Schweers et al. 1994; Weinreb et al. 1996), near-UV CD spectra indicating molten globules (Dolgikh et al. 1981; Ohgushi and Wada 1983), and hypersensitivity to protease digestion (Fontana et al. 1986; Hubbard et al. 1994). Intrinsic disorder revealed by these methods, except for crystallography, very likely corresponds to equilibrium ensembles with time-varying Ramachandran φ and ψ angles along the backbone with mobile side chains. X ray-identified regions of disorder can be time-varying structural ensembles or ordered domains that wobble relative to the lattice-immobilized protein. Flexibility is commonly used to describe both order and intrinsic disorder. In ordered regions, flexibility refers to atomic movements around their equilibrium positions. In intrinsically disordered regions, flexibility relates to very different conformations and to the speed of their interconversions.
Complementarity of SDS-PAGE and ESI-FTICR data
Cleavage under partial proteolysis conditions is controlled by protein disorder, flexibility, and solvent accessibility. Resistant cleavage sites are typically inaccessible primarily because of rigid structure (Hubbard et al. 1994, 1998), either from local folding or from interactions with other parts of the molecule. Quantitation of our XPA proteolysis data by SDS-PAGE (Fig. 2B ▶) with fragment identification by mass spectrometry (Fig. 3 ▶) clearly showed that internal domains beginning at L40, V60, or Q85 and ending around 200 comprised the dominant gel bands. Cleavage at R39 precedes cleavage at K59, which precedes cleavage at R84. The overall experimental results show a protease-resistant, internal core region (Q85-I179) corresponding to the MBD, whereas both the N-terminal region up to position R84 and the C-terminal region beginning at R181 contain multiple accessible cleavage sites.
Absence of certain partial proteolysis fragments despite abundant target sites is especially significant with our sensitive (subfemtomoles) detection techniques. Small fragments are more easily detected than large fragments, yet most of the fragments we found were large, which means that undetected fragments were either not produced or they were present in such small amounts that they were undetectable. When no fragments in certain regions are observed, it reflects more order than in the regions that are rapidly cut.
Comparing XPA disordered regions with those in other proteins
The indication of disorder by PONDR agrees with proteolysis fragments identified by ESI-FTICR mass spectrometry. This is important because it suggests that the structurally uncharacterized ends of XPA share sequence attributes with a database of intrinsically disordered domains. When compared with the database of known disordered proteins (VL1) used to train PONDR, XPA's N-terminal disordered region is not unusual in charged or aromatic amino acid composition, net charge, or coordination number (Fig. 7 ▶). The histone H5 and prion families have attributes that diverge the most from other members of VL1 and yet have prediction accuracies by PONDR that are quite high (∼99%). The prediction accuracies for disordered regions of the calcineurin and XPA families were 83% and 82%, respectively. Thus, PONDR is reliable even when attribute values markedly diverge from the averages for the training set.
Comparing mass spectrometry data with PONDR predictions for full-length XPA (and the NMR structure for M98-F219 hMBD)
An ordered protease-resistant core flanked by disordered Nand C-terminal domains
Human MBD (M98-F219; i.e., L90-F211 in Xenopus) was defined by limited proteolysis with chymotrypsin and retention of DNA-binding activity (Kuraoka et al. 1996). We found the same protease-resistant core (Q85-I179) in xXPA using trypsin (Figs. 2 ▶,3,5,6), thus showing a common structural domain shared between these two proteins even though different proteases were used. The xXPA trypsin-resistant core is similar to hMBD with additional agreement that the R199 digestion site is close to an order/disorder boundary indicated by NMR. Despite multiple cleavage sites throughout the molecule, the Nand C-terminal domains were the primary targets. Two unassigned regions within the ordered core might have been potential targets based on the NMR structure of the 15-kD MBD. Regions K151-K163 (i.e., Xenopus K143-K155) and N169-D178 (i.e., Xenopus N161-D169) are depicted as lightly shaded areas in Figure 6 ▶ and are predicted to have a tendency for order by PONDR. The N161-D169 region has no trypsin cleavage sites and thus would not be expected to yield fragments. The K143-K155 region contains four trypsin cleavage sites in both species, yet no fragments from any of these sites were detected by our sensitive ESI-FTICR mass spectrometry. Unassigned amino acids in an NMR structure need not always signify disorder or lack of secondary structure. These loops did not have observable crosspeaks in NMR spectra due to internal exchanges and therefore were broadened as a consequence of motion on an intermediate timescale. An alternative possible explanation for no trypsin proteolysis in this target-rich region may be that it is exposed only in the hMBD fragment, but is buried in the full-length molecule.
ESI-FTICR mass spectrometry analysis of full-length xXPA partial proteolysis fragments revealed 32 (out of 43 total) unique fragments with C termini in the region K196-K229 containing 16 trypsin sites (Fig. 3 ▶). A refined NMR structure of the corresponding domain in hMBD could assign an α-helix for this region only upon interaction with DNA or a fragment of replication protein A. This indicates substantial flexibility or lack of fixed tertiary structure in the absence of a complex. It is interesting that, in agreement with our proteolysis data, PONDR predicts this same α-helical region to be disordered, similar to its prediction of disorder for the calmodulin target α-helix within the unobserved part of the X-ray structure of calcineurin (Kissinger et al. 1995). Like the XPA α-helix, the calmodulin target α-helix undergoes a disorder-to-order transition upon binding with its partner (Kissinger et al. 1995). This indicates that PONDR assigns mobile α-helices to be disordered rather than ordered, and it predicts lack of fixed tertiary structure rather than lack of regular secondary structure.
Zn-finger and adjacent region
No cleavage in the Zn-finger domain C97-C121 (i.e., human C105-C129) was detected in xXPA, consistent with both PONDR and the inaccessible, β-sheet structure assigned by NMR for hMBD fragment. PONDR predicts a short spike of disorder for a seven-residue segment, E125-I131, that is immediately adjacent to the Zn-finger. Interestingly, there was no structure assigned by NMR for precisely this region. Similar conserved clusters of charged residues with short spikes of disorder were predicted by PONDR for XPAs from four other species (data not shown). Thus, this adjacent charge cluster and accompanying spike provide a signature for XPA Zn-fingers.
Potential importance of disorder in XPA function
XPA sequences from four other organisms (human, mouse, chicken, and yeast) analyzed by PONDR yielded similar order/disorder predictions (data not shown). This strengthens the hypothesis that XPA's disordered regions serve functional roles. The sequence identities for the different regions in all five species declines from 70% (Zn-finger), to 63% (remainder of core), to 56% (C-terminal region), to 30% (N-terminal region). The predictions of disorder in regions of reduced sequence conservation suggest that amino acid substitutions allowed during evolution are likely to have been restricted to those maintaining disorder. What are likely functional role(s) for lengthy, conserved, disordered domains?
XPA's disordered Nand C-terminal regions each contain a putative nuclear localization signal (NLS), whose role is to assist transport of proteins across the nuclear envelope through large multiprotein pore complexes. The NLS sequence motif is poorly defined, although generally four of six residues are Lys or Arg with no Asp or Glu (Nigg 1997). An NLS in a disordered region might undergo disorder-to-order transitions during binding events associated with nuclear transport, thereby enabling many different primary sequences to bind to similar sites. Coupling moderate specificity with low affinity (Schulz 1979; Dunker et al. 1998) would be important to locate correct binding sites and then to eventually release the imported protein. A putative NLS in xXPA was proposed from A23-P44 (Shimamoto et al. 1991), although this 21-amino acid NLS would be unusually long and it contains Asp. We found two putative NLSs in xXPA: RNRQRA (27–32), which is located in the N-terminal disordered region, and KMKQKK (205–210), which resides in the C-terminal disordered region just beyond the flexible α-helix. Both of these hexamers are conserved in hXPA with only a single K to N amino acid substitution at residue 28. Our putative xXPA N-terminal NLS is contained within one determined experimentally (Miyamoto et al. 1992); both NLSs occur in protease-sensitive regions determined by ESI-FTICR mass spectrometry and have strong local tendencies for disorder predicted by PONDR, as do XPA NLSs from four other organisms. There are precedents for protease sensitivity in the NLS; e.g., NLSs of various topoisomerases reside in protease-sensitive regions (Nigg 1997).
There are likely other potential functional roles to assign for the N and C domains, because the NLS comprises only a small portion of the extensive disordered regions found in XPA. Disorder-to-order transitions upon DNA binding facilitate shape accommodations so that proteins with significant disordered regions could bind to a wide variety of structurally distinct substrates (Wright and Dyson 1999). This would be a desirable characteristic for a DNA-repair protein that must recognize and bind to many different bulky adducts and also interact with other proteins. When a protein binds to two or more ligands whose spacing or orientation change, then simultaneous binding can be enhanced when the domains are connected by flexible linkers (Dunker et al. 1998). Given the interactions of XPA with DNA and several other proteins, at least some of the intrinsic disorder is likely to provide this flexibility.
Closing remarks
Mapping structural domains of proteins involved in complex interactions is essential to understand function. However, increasing numbers of proteins containing substantial regions of functionally important, disordered structure have been reported (Wright and Dyson 1999). An exciting possibility to attack both the functional roles of disordered regions and the protein-folding problem is to automate partial proteolytic analysis by using ESI-FTICR mass spectrometry methods described here in combination with PONDR. The rate-limiting electrophoretic, chromatographic, and N-terminal sequencing steps could be eliminated, and ESI-FTICR mass spectrometry could be automated for mapping both disordered and ordered domains. Lack of cleavage despite cleavage sites strongly indicates order, especially considering the extreme sensitivity of ESI-FTICR mass spectrometry to detect proteolysis fragments. Analysis of numerous proteins as well as data from existing structural databases should enable compilation of a sequence or motif database with a high likelihood for disordered structures. This information would be essential to reliably predict protein structures because time and effort would not be squandered attempting to predict or solve structures for disordered regions.
Materials and methods
Reagents
Sequencing-grade trypsin was purchased from Boehringer Mannheim, dissolved in 1mM HCl at 1 mg/mL, and used immediately. Xenopus laevis XPA coding sequence was cloned in pET11a (Novagen), resulting in clone pET11a-XPA. xXPA protein contained 265 amino acids due to a 2-amino acid deletion (8E and 9Q) compared with SWISS-PROT accession #P27088. The Xenopus XPA cDNA (pXPACXE1) was a generous gift from Prof. Kenji Kohno from Nara Institute of Science and Technology, Nara, Japan. xXPA was prepared as previously described (Buchko et al. 1999b) and shown to be active by functional assays (Ackerman and Iakoucheva 2000) in efficient Xenopus NER extracts (Oda et al. 1996). Further evidence of activity was confirmed by fluorescence spectroscopy studies showing that xXPA has a nanomolar binding constant to DNA (L.M. Iakoucheva, R. Walker, B. Van Houten, and E.J. Ackerman, in prep.). DNA sequencing of the expression clone confirmed the expected sequence, as did N-terminal amino acid sequencing (University of Southern California, Comprehensive Cancer Center, Los Angeles, CA).
Proteolysis conditions—direct mass spectrometry
Limited proteolysis of xXPA was performed in 25mM HEPES-KOH, 100mM KCl at pH 7.5 with trypsin:xXPA ratios of 1:200 and 1:2000 (w/w) at 37°C. Twenty μL aliquots (10–50 μM protein) were removed at 5, 15, 30, 45, and 60 min and immediately dialyzed against 0.1 M acetic acid (Liu et al. 1997). After dialysis, samples were either directly electrosprayed into the mass spectrometer or analyzed by 4%–20% or 10%–20% gradient Tris-glycine (Novex) SDS-PAGE and visualized by Coomassie Blue staining.
Proteolysis conditions—liquid chromatography–mass spectrometry
Following limited proteolysis, fragments were solubilized by addition of guanidine HCl to 6 M and DTT to 120 mM; 100 μL samples were boiled 3 min, then 400 μL 6% acetonitrile/0.1% trifluoroacetic acid was added immediately and samples were loaded onto a Vydac C4 214MS5215 column equilibrated in 0.1% TFA, 5% MeCN. The column was washed with 10 column volumes (CV) of 5% MeCN and then consecutive gradients of 5%–15% MeCN (1.5 CV) at 2.5%/min, 15%–42.5% MeCN (11 CV) at 1%/min, and 42.5%–55% MeCN (2 CV) at 2.5%/min. All column buffers contained 0.1% TFA. Fractions were taken at 1-min intervals and analyzed by SDS-PAGE and by ESI-FTICR mass spectrometry.
Electrophoresis
Limited proteolysis reactions were terminated by boiling 5 min in SDS-PAGE loading buffer containing 120mM DTT. The 10% and 16% Tris-glycine gels were prepared as described (Laemmli 1970), and all other gels were purchased from Novex.
ESI-FTICR mass spectrometry
Mass spectrometry measurements were performed using a 7-tesla and an 11.5-tesla FT-ICR mass spectrometer designed and constructed at Pacific Northwest National Laboratory. The instrument is equipped with an elongated cylindrical open-ended cell (Bruce et al. 1999; Usdeth et al. 1999). The experiment was controlled by an Odyssey (Finnigan) data station. Digestion mixtures were introduced to the electrospray ionization (ESI) source at a rate of 0.3 μL/min using a Harvard Apparatus model 22 syringe-pump. A +1.8- to 2-kV voltage was applied to the ESI emitter, and charged species were injected through a 500 μm-diameter heated metal capillary maintained at 160°C. At the exit of the metal capillary, the ion beam was focused to the entrance of a quadrupole ion guide. Ions were accumulated for 1.5 sec in an external storage quadrupole before transfer to the FTICR cell. Following their trapping in the ICR cell, all ions were excited by a frequency chirp (100 Hz/μsec, amplitude 75 Vp-p) and detected (256-kb data points) at an acquisition frequency of 500 kHz. Up to 50 transient were summed to achieve a better signal-to-noise ratio for the most dilute samples. Data were analyzed using the software ICR-2LS developed in our laboratory. Transient data were baseline corrected before fast Fourier transform, and no apodization or zerofilling was used. Isotopic distributions were detected using the Horn Mass transform algorithm (Horn et al. 2000). Measured masses were derived from the detected isotopic distribution by using the "averagine" (Senko et al. 1995) hypothetical average protein and were compared with the monoisotopic (MW<15,000) or most abundant isotope (MW ≥15,000) calculated masses of the predicted tryptic fragments of xXPA. To minimize the risk for erroneous assignment, a tryptic peptide of xXPA was considered identified when its mass matched the measured mass and there was no other tryptic fragment within ±2 daltons of the measured mass.
PONDR
Previous neural network predictors were trained by back propagation using segments with intrinsic order and disorder collected by literature searches. Earlier versions of PONDR used five-cross validations on different training sets (Romero et al. 1997; Li et al. 1999). Our new PONDR was formed by merging the outputs of the two end-specific predictors (Li et al. 1999) with one for internal regions and then averaging and smoothing the overlap regions (Romero et al. 2000). PONDR now includes both NMR- and X ray-characterized disorder in the training data. It showed an accuracy of ∼80% for prediction of order when applied to a nonredundant, disorder-free data set containing 233,777 residues representing most protein families with currently known structures. The false-positive error rates among α-helix, β-sheet, turn, and other nondisordered regions were 22%, 18%, 17%, and 22%, respectively, which matched the per-residue false-positive predictions of 20% disorder overall. This nonredundant data set of ordered segments was constructed by removing disordered residues from the sequences in the August 3, 1999 version of PDB_Select_25. The identities of these proteins and their ordered and disordered parts are available at http://disorder.chem.wsu.edu.
Acknowledgments
We are grateful to Dr. V. Doseeva for subcloning the xXPA coding sequence into expression vector pET11a and for helping to develop an XPA purification strategy. We thank Gordon A. Anderson for development of software used in data analysis and Drs. Michael A. Kennedy and Paul Ellis for comments on the manuscript.
The publication costs of this article were defrayed in part by payment of page charges. This article must therefore be hereby marked "advertisement" in accordance with 18 USC section 1734 solely to indicate this fact.
Abbreviations
ESI-FTICR, electrospray ionization interface coupled to a Fourier transform ion cyclotron resonance
NER, nucleotide excision repair
NLS, nuclear localization signal
MBD, minimal binding domain
MW, molecular weight
PONDR, predictor of natural disordered regions
XPA, xeroderma pigmentosum group A
Article and publication are at www.proteinscience.org/cgi/doi/10.1110/ps.29401
References
- Ackerman, E.J. and Iakoucheva, L.M. 2000. Nucleotide excision repair in oocyte nuclear extracts from Xenopus laevis. Methods: Companion Meth. Enzymol. 22 : 188–193. [DOI] [PubMed] [Google Scholar]
- Araujo, S.J. and Wood, R.D. 1999. Protein complexes in nucleotide excision repair. Mutation Res. 435 23–33. [DOI] [PubMed] [Google Scholar]
- Aviles, F.J., Chapman, G.E., Kneale, G.G., Crane-Robinson, C., and Bradbury, E.M. 1978. The conformation of histone H5. Isolation and characterisation of the globular segment. Eur. J. Biochem. 88 363–371. [DOI] [PubMed] [Google Scholar]
- Bode, W., Schwager, P., and Huber, R. 1978. The transition of bovine trypsinogen to a trypsin-like state upon strong ligand binding. The refined crystal structures of the bovine trypsinogen-pancreatic trypsin inhibitor complex and of its ternary complex with Ile-Val at 1.9 A resolution. J. Mol. Biol. 118 99–112. [DOI] [PubMed] [Google Scholar]
- Bothner, B., Dong, X.F., Bibbs, L., Johnson, J.E., and Siuzdak, G. 1998. Evidence of viral capsid dynamics using limited proteolysis and mass spectrometry. J. Biol. Chem. 273 673–676. [DOI] [PubMed] [Google Scholar]
- Bruce, J.E., Anderson, G.A., Wen, J., Harkewicz, R., and Smith, R.D. 1999. High-mass-measurement accuracy and 100% sequence coverage of enzymatically digested bovine serum albumin from an ESI-FTICR mass spectrum. Anal. Chem. 71 2595–2599. [DOI] [PubMed] [Google Scholar]
- Buchko, G.W., Ni, S., Thrall, B.D., and Kennedy, M.A. 1998. Structural features of the minimal DNA binding domain (M98-F219) of human nucleotide excision repair protein XPA. Nucleic Acids Res. 26 2779–2788. [DOI] [PMC free article] [PubMed] [Google Scholar]
- Buchko, G.W., Daughdrill, G.W., de Lorimier, R., Rao, B.K., Isern, N.G., Lingbeck, J.M., Taylor, J.S., Wold, M.S., Gochin, M., Spicer, L.D., et al. 1999a. Interactions of human nucleotide excision repair protein XPA with DNA and RPA70ΔC327: Chemical shift mapping and 15N NMR relaxation studies. Biochemistry 38 15116–15128. [DOI] [PMC free article] [PubMed] [Google Scholar]
- Buchko, G.W., Iakoucheva, L.M., Kennedy, M.A., Ackerman, E.J., and Hess, N.J. 1999b. Extended X-ray absorption fine structure evidence for a single metal binding domain in Xenopus laevis nucleotide excision repair protein XPA. Biochem. Biophys. Res. Commun. 254 109–113. [DOI] [PubMed] [Google Scholar]
- Chou, P.Y. and Fasman, G.D. 1978. Empirical predictions of protein conformation. Annu. Rev. Biochem. 47 251–276. [DOI] [PubMed] [Google Scholar]
- Cohen, S.L., Ferre-D'Amare, A.R., Burley, S.K., and Chait, B.T. 1995. Probing the solution structure of the DNA-binding protein Max by a combination of proteolysis and mass spectrometry. Protein Sci. 4 1088–1099. [DOI] [PMC free article] [PubMed] [Google Scholar]
- Daughdrill, G.W., Chadsey, M.S., Karlinsey, J.E., Hughes, K.T., and Dahlquist, F.W. 1997. The C-terminal half of the anti-σ factor, FlgM, becomes structured when bound to its target, σ28. Nat. Struct. Biol. 4 285–291. [DOI] [PubMed] [Google Scholar]
- Dolgikh, D.A., Gilmanshin, R.I., Brazhnikov, E.V., Bychkova, V.E., Semisotnov, G.V., Venyaminov, S., and Ptitsyn, O.B. 1981. α-Lactalbumin: Compact state with fluctuating tertiary structure? FEBS Lett. 136 311–315. [DOI] [PubMed] [Google Scholar]
- Dunker, A.K., Garner, E., Guilliot, S., Romero, P., Albrecht, K., Hart, J., Obradovic, A., Kissinger, C., and Villafranca, J.E. 1998. Protein disorder and the evolution of molecular recognition: Theory, predictions and observations. Pac. Symp. Biocomput. 3 473–484. [PubMed] [Google Scholar]
- Fletcher, C.M., McGuire, A.M., Gingras, A.C., Li, H., Matsuo, H., Sonenberg, N., and Wagner, G. 1998. 4E binding proteins inhibit the translation factor eIF4E without folded structure. Biochemistry 37 9–15. [DOI] [PubMed] [Google Scholar]
- Fontana, A., Fassina, G., Vita, C., Dalzoppo, D., Zamai, M., and Zambonin, M. 1986. Correlation between sites of limited proteolysis and segmental mobility in thermolysin. Biochemistry 25 1847–1851. [DOI] [PubMed] [Google Scholar]
- Friedberg, E.C., Walker, G.C., and Siede, W. 1995. DNA Repair and Mutagenesis. ASM, Washington, D.C.
- Gervasoni, P., Staudenmann, W., James, P., and Pluckthun, A. 1998. Identification of the binding surface on β-lactamase for GroEL by limited proteolysis and MALDI-mass spectrometry. Biochemistry 37 11660–11669. [DOI] [PubMed] [Google Scholar]
- Horn, D.M., Zubarev, R.A., and McLafferty, F.W. 2000. Automated reduction and interpretation of high resolution electrospray mass spectra of large molecules. J. Am. Soc. Mass Spectrom. 11 320–332. [DOI] [PubMed] [Google Scholar]
- Hubbard, S.J., Eisenmenger, F., and Thornton, J.M. 1994. Modeling studies of the change in conformation required for cleavage of limited proteolytic sites. Protein Sci. 3 757–768. [DOI] [PMC free article] [PubMed] [Google Scholar]
- Hubbard, S.J., Beynon, R.J., and Thornton, J.M. 1998. Assessment of conformational parameters as predictors of limited proteolytic sites in native protein structures. Protein Eng. 11 349–359. [DOI] [PubMed] [Google Scholar]
- Huber, R. 1979. Conformational flexibility in protein molecules. Nature 280 538–539. [DOI] [PubMed] [Google Scholar]
- Ikegami, T., Kuraoka, I., Saijo, M., Kodo, N., Kyogoku, Y., Morikawa, K., Tanaka, K., and Shirakawa, M. 1998. Solution structure of the DNA- and RPA-binding domain of the human repair factor XPA. Nat. Struct. Biol. 5 701–706. [DOI] [PubMed] [Google Scholar]
- Kissinger, C.R., Parge, H.E., Knighton, D.R., Lewis, C.T., Pelletier, L.A., Tempczyk, A., Kalish, V.J., Tucker, K.D., Showalter, R.E., Moomaw, E.W., et al. 1995. Crystal structures of human calcineurin and the human FKBP12-FK506–calcineurin complex. Nature 378 641–644. [DOI] [PubMed] [Google Scholar]
- Kuraoka, I., Morita, E.H., Saijo, M., Matsuda, T., Morikawa, K., Shirakawa, M., and Tanaka, K. 1996. Identification of a damaged-DNA binding domain of the XPA protein. Mutation Res. 362 87–95. [DOI] [PubMed] [Google Scholar]
- Laemmli, U.K. 1970. Cleavage of structural proteins during the assembly of the head of bacteriophage T4. Nature 227 680–685. [DOI] [PubMed] [Google Scholar]
- Li, X., Rani, M., Romero, P., Obradovic, Z., and Dunker, A.K. 1999. Predicting protein disorder for N-, C-, and internal regions. Genome Informatics 10 30–40. [PubMed] [Google Scholar]
- Liu, C.L., Muddiman, D.C., Tang, K.Q., and Smith, R.D. 1997. Improving the microdialysis procedure for electrospray ionization-mass spectrometry of biological samples. J. Mass Spectrom. 32 425–431. [Google Scholar]
- Manalan, A.S. and Klee, C.B. 1983. Activation of calcineurin by limited proteolysis. Proc. Natl. Acad. Sci. U S A 80 4291–4295. [DOI] [PMC free article] [PubMed] [Google Scholar]
- Massotte, D., Yamamoto, M., Scianimanico, S., Sorokine, O., van Dorsselaer, A., Nakatani, Y., Ourisson, G., and Pattus, F. 1993. Structure of the membrane-bound form of the pore-forming domain of colicin A: A partial proteolysis and mass spectrometry study. Biochemistry 32 13787–13794. [DOI] [PubMed] [Google Scholar]
- Miyamoto, I., Miura, N., Niwa, H., Miyazaki, J., and Tanaka, K. 1992. Mutational analysis of the structure and function of the xeroderma pigmentosum group A complementing protein. Identification of essential domains for nuclear localization and DNA excision repair. J. Biol. Chem. 267 12182–12187. [PubMed] [Google Scholar]
- Nigg, E.A. 1997. Nucleocytoplasmic transport: signals, mechanisms and regulation. Nature 386 779–787. [DOI] [PubMed] [Google Scholar]
- Oda, N., Saxena, J.K., Jenkins, T.M., Prasad, R., Wilson, S.H., and Ackerman, E.J. 1996. DNA polymerases a and b are required for DNA repair in an efficient nuclear extract from Xenopus oocytes. J. Biol. Chem. 271 13816–13820. [DOI] [PubMed] [Google Scholar]
- Ohgushi, M. and Wada, A. 1983. `Molten-globule state': A compact form of globular proteins with mobile side-chains. FEBS Lett. 164 21–24. [DOI] [PubMed] [Google Scholar]
- Pasa-Tolic, L., Jensen, P.K., Anderson, G.A., Lipton, M.S., Peden, K.K., Martinovic, S., Toli, N., Bruce, J.E., and Smith, R.D. 1999. High throughput proteome-wide precision measurements of protein expression using mass spectrometry. J. Am. Chem. Soc. 121 7949–7950. [Google Scholar]
- Riek, R., Hornemann, S., Wider, G., Billeter, M., Glockshuber, R., and Wuthrich, K. 1996. NMR structure of the mouse prion protein domain PrP(121–321). Nature 382 180–182. [DOI] [PubMed] [Google Scholar]
- Romero, P., Obradovic, Z., Kissinger, K., Villafranca, J.E., and Dunker, A.K. 1997. Identifying disordered regions in proteins from amino acid sequence. Proc. Internatl. Conf. Neural Networks 1 90–95. [Google Scholar]
- Romero, P., Obradovic, Z., Li, X., Garner, E., Brown, C.J., and Dunker, A.K. 2001. Sequence complexity of disordered protein. Proteins 42 38–48. [DOI] [PubMed] [Google Scholar]
- Rost, R. and Sander, C. 1994. Combining evolutionary information and neural networks to predict protein secondary structure. Proteins 19 55–72. [DOI] [PubMed] [Google Scholar]
- Schulz, G. 1979. Nucleotide binding proteins. In, Molecular mechanism of biological recognition (ed. M. Balaban), pp. 79–94. Elsevier/North-Holland Biomedical, Amsterdam.
- Schweers, O., Schonbrunn-Hanebeck, E., Marx, A., and Mandelkow, E. 1994. Structural studies of τ protein and Alzheimer paired helical filaments show no evidence for β-structure. J. Biol. Chem. 269 24290–24297. [PubMed] [Google Scholar]
- Senko, M.W., Beu, S.C., and McLafferty, F.W. 1995. Automated assignment of charge states from resolved isotopic peaks for multiply charged ions. J. Am. Soc. Mass Spectrom. 6 229–233. [DOI] [PubMed] [Google Scholar]
- Shimamoto, T., Kohno, K., Tanaka, K., and Okada, Y. 1991. Molecular cloning of human XPAC gene homologs from chicken, Xenopus laevis and Drosophila melanogaster. Biochem. Biophys. Res. Commun. 181 1231–1237. [DOI] [PubMed] [Google Scholar]
- Solovyev, V.V. and Salamov, A.A. 1994. Predicting α-helix and β-strand segments of globular proteins. Comput. Appl. Biosci. 10 661–669. [DOI] [PubMed] [Google Scholar]
- Sugasawa, K., Ng, J.M., Masutani, C., Iwai, S., van der Spek, P.J., Eker, A.P., Hanaoka, F., Bootsma, D., and Hoeijmakers, J.H. 1998. Xeroderma pigmentosum group C protein complex is the initiator of global genome nucleotide excision repair. Mol. Cell 2 223–232. [DOI] [PubMed] [Google Scholar]
- Usdeth, H.R., Gorshkov, M.V., Belov, M.L., Pasa-Tolic, L., Bruce, J.E., Masselon, C.D., Harkewicz, R., Anderson, G.A., and Smith, R.D. 1999. Continuing development of the 11.5 tesla FT-ICR instrumentation. In Proc. 37th ASMS Conference on Mass Spectrometry and Allied Topics. Dallas, TX, June 13–17, 1999.
- Wakasugi, M. and Sancar, A. 1999. Order of assembly of human DNA repair excision nuclease. J. Biol. Chem. 274 18759–18768. [DOI] [PubMed] [Google Scholar]
- Weinreb, P.H., Zhen, W., Poon, A.W., Conway, K.A., and Lansbury, P.T., Jr. 1996. NACP, a protein implicated in Alzheimer's disease and learning, is natively unfolded. Biochemistry 35 13709–13715. [DOI] [PubMed] [Google Scholar]
- Williams, R.M., Obradovic, Z., Mathura, V., Braun, W., Garner, E.C., Young, J., Takayama, S., Brown, C.J., and Dunker, A.K. 2001. The protein non-folding problem: amino acid determinants of intrinsic order and disorder. Pac. Symp. Biocomput. 6 89–100. [DOI] [PubMed] [Google Scholar]
- Wright, P.E. and Dyson, H.J. 1999. Intrinsically unstructured proteins: Re-assessing the protein structure- function paradigm. J. Mol. Biol. 293 321–331. [DOI] [PubMed] [Google Scholar]