Crystallization and selenium substructure solution of RsbS from Moorella thermoacetica, the first ab initio phased crystal structure from Diamond.
Keywords: RsbS, Moorella thermoacetica, selenomethionine, SAD
Abstract
The thermophilic bacterium Moorella thermoacetica possesses an rsb operon that is related to the genetic locus common to many Gram-positive bacteria that regulates the activity of the stress-responsive sigma factor σB. One of the gene products of this operon is RsbS, a single STAS-domain protein that is a component of higher order assemblies in Bacillus subtilis known as ‘stressosomes’. It is expected that similar complexes are found in M. thermoacetica, but in this instance regulating the biosynthesis of cyclic di-GMP, a ubiquitous secondary messenger. Selenomethionine-labelled MtRsbS protein was crystallized at room temperature using the hanging-drop vapour-diffusion method. Crystals belonging to space group P212121, with unit-cell parameters a = 51.07, b = 60.52, c = 89.28 Å, diffracted to 2.5 Å resolution on beamline I04 of the Diamond Light Source. The selenium substructure was solved using SHELX and it is believed that this represents the first reported ab initio crystal structure to be solved using diffraction data collected at DLS.
1. Introduction
Moorella thermoacetica, previously known as Clostridium thermoaceticum, is a rod-shaped Gram-positive thermophilic acetogen that was originally isolated from horse manure (Fontaine et al., 1942 ▶). The normal habitat for M. thermoacetica is soil and it grows at an optimum temperature of 328–333 K; however, other strains have been isolated from spoiled canned foods, possibly owing to the microorganism’s ability to produce heat-resistant spores that can withstand temperatures as high as 394 K (Byrer et al., 2000 ▶). M. thermoacetica converts glucose to acetate via the acetyl-CoA pathway, using CO2, nitrate and nitrite or thiosulfate as terminal electron acceptors (Drake & Daniel, 2004 ▶; Carlier & Bedora-Faure, 2006 ▶).
Because this species is a spore-forming Gram-positive bacterium, it would seem reasonable to expect that M. thermoacetica might employ a similar system to deal with environmental stress to that of Bacillus subtilis, the Gram-positive endospore-forming paradigm. The response of B. subtilis to environmental stress is organized by σB, a subunit of RNA polymerase (Hecker & Volker, 2001 ▶). The availability of σB to form the holo-form of RNA polymerase is controlled predominantly by the gene products of the rsb operon (Kang et al., 1996 ▶; Wise & Price, 1995 ▶). At the very top of this signalling cascade stands the stressosome, a >1.5 MDa signalling complex comprising in the minimal sense RsbR, RsbS and RsbT (Delumeau et al., 2006 ▶; Chen et al., 2003 ▶). However, unlike in B. subtilis, the RsbRST module in M. thermoacetica (MtRsbRST) does not regulate stress resistance (Pane-Farre et al., 2005 ▶). Instead, the presence of a GGDEF domain downstream of the rsbRST operon indicates that M. thermoacetica utilizes the RsbRST module to coordinate biosynthesis of the nucleotide cyclic diguanosine monophosphate (cyclic di-GMP; Romling & Amikam, 2006 ▶). Cyclic di-GMP was recognized as a signalling molecule during the 1980s by Benziman and coworkers, regulating cellulose synthesis in Gluconacetobacter xylinum (Ross et al., 1990 ▶; Amikam & Benziman, 1989 ▶), but its ubiquity indicates its generic importance to signal transduction.
Stressosomes in B. subtilis comprise in the minimal sense multiple copies of RsbS, a single STAS (sulfate transporter and anti-antisigma factor) domain protein that associates with several molecules of RsbR to form >1.5 MDa complexes that sequester RsbT (Pane-Farre et al., 2005 ▶; Delumeau et al., 2006 ▶; Chen et al., 2003 ▶; Kim et al., 2004 ▶). RsbT is released during the response to stress by phosphorylating conserved serine and threonines in the STAS domains of RsbS, RsbR (and paralogues) and in doing so transduces the stress signal to σB. Because of the high degree of sequence conservation, it is anticipated that the MtRsbRST module forms similar structures in regulating secondary messenger biosynthesis. In this paper, we report the expression, purification, crystallization and preliminary X-ray analysis of the 123-amino-acid 13 566 Da MtRsbS protein, the crystal structure of which will provide a structural basis for the interpretation of the interactions in the core of the stressosome and of the binding and release of RsbT (Chen et al., 2003 ▶; Pane-Farre et al., 2005 ▶).
2. Overexpression and purification of MtRsbS
A DNA fragment encompassing the rsbS gene from M. thermoacetica ATC39073 (NCBI gene ID 3832355) was amplified from M. thermoacetica chromosomal DNA using the Pfu ultrahigh-fidelity polymerase (Roche). The oligonucleotides RsbSFwd, 5′-GGAATTCAT ATGAGTAGCCGGGTGCCCATCCTG-3′, and RsbSRev, 5′-CGGGATCCTTATCGCTGCTCCATTCGGGC-3′, were used as PCR primers (the NdeI and BamHI restriction sites, respectively, are shown in bold). The 372-base-pair product was cloned into the pET24a vector and the resultant plasmid was named S41.
Escherichia coli B834 cells were transformed with the resulting plasmid and used to produce protein as follows. A 100 ml overnight culture was inoculated into 1 l minimal M9 medium supplemented with amino acids (with selenomethionine replacing methionine), vitamins and 50 mg ml−1 kanamycin, which was then incubated at 308 K. When the culture reached mid-log phase (OD600 = 0.4), expression of the protein was induced by adding IPTG to a final concentration of 1 mM. The cells were grown for an additional 16 h at 291 K and harvested by centrifugation.
The harvested cells were resuspended in buffer A (20 mM Tris–HCl pH 7.5, 1 mM DTT) and disrupted by sonication. The crude cell lysate was centrifuged at 15 000g for 30 min at 277 K and the supernatant was further clarified by passing it through a 0.45 µm syringe-filter device (Millipore). The protein was loaded onto a 25 ml Q-Sepharose fast-flow anion-exhange column (Amersham Biosciences) pre-equilibrated with buffer A and bound proteins were eluted over a 250 ml linear gradient to buffer A with 1 M NaCl. Fractions containing MtRsbS as identified by SDS–PAGE were further purified by gel filtration using an S75 16/60 size-exclusion column pre-equilibrated with buffer B (20 mM Tris–HCl pH 7.5, 200 mM NaCl, 1 mM DTT). Purified protein was subsequently concentrated to 6 mg ml−1 for crystallization experiments.
3. Crystallization of RsbS
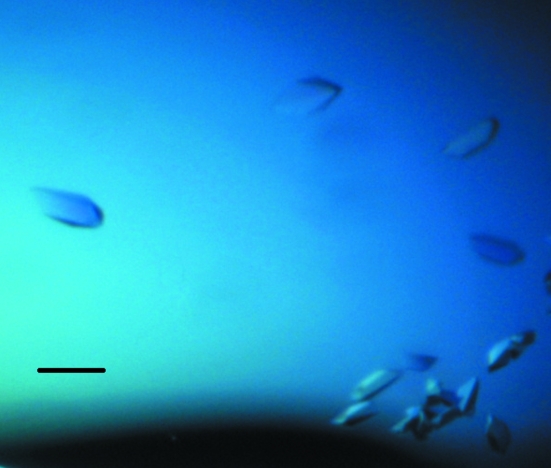
Crystallization of purified protein in 20 mM Tris–HCl pH 7.5, 200 mM NaCl, 1 mM DTT buffer was initially performed with commercially available screens from Qiagen using the sitting-drop vapour-diffusion technique. Each experiment was set up using a Mosquito (TTP Labtech) nanolitre pipetting robot and MRC crystallization plates containing 100 µl each of 96 conditions from the PACT screen. 100 nl protein solution was pipetted into the sample well of each of the 96 wells of the crystallization plate followed by 100 nl of each crystallant. Plates were sealed with clear sealing films and allowed to equilibrate at 294 K. MtRsbS crystals were observed in a number of conditions (PACT B10, B11, D10, D11, F4 and F9). An optimization screen for each of these conditions was set up in 24-well trays using the hanging-drop vapour-diffusion technique with 1 ml of crystallant in the reservoir and 1 µl protein solution mixed with 1 µl crystallant. Crystals appeared in 2 d from drops containing 0.2 M potassium thiocyanate, 0.1 M bis-tris propane pH 6.5, 20%(w/v) PEG 3350 (Fig. 1 ▶).
Figure 1.
Crystals of MtRsbS. The black scale bar represents 100 µm.
4. X-ray analysis
4.1. Data collection and processing
The crystals were transferred to a cryoprotectant solution containing 0.2 M potassium thiocyanate, 0.1 M bis-tris propane pH 6.5, 20%(w/v) PEG 3350 and 20%(v/v) PEG 300, mounted in a 0.1 mm litho-loop (Molecular Dimensions Ltd) and immediately flash-cooled by immersion in liquid nitrogen at 100 K.
Diffraction data were collected at a wavelength of 0.9699 Å to a resolution of 2.5 Å at beamline I04 of the Diamond Light Source using an ADSC CCD detector. A total of 790 images were collected with an oscillation angle of 0.5° and an exposure time of 1 s per image. The data were indexed and integrated using MOSFLM (Leslie, 2006 ▶). The MtRsbS crystals belong to the orthorhombic space group P212121, with unit-cell parameters a = 51.07, b = 60.52, c = 89.28 Å. Data were scaled using SCALA in CCP4i (Winn, 2003 ▶; Evans, 2006 ▶) with scales calculated in batch mode. Assuming the presence of two molecules of MtRsbS per asymmetric unit, the crystal volume per unit of protein weight was 2.54 Å3 Da−1, which corresponds to a solvent content of approximately 52%. Crystallographic data statistics are summarized in Table 1 ▶.
Table 1. Data-collection and processing statistics for MtRsbS.
Values in parentheses are for the highest resolution shell.
| Data collection | |
| X-ray source | DLS (I04) |
| Wavelength (Å) | 0.9699 |
| Detector | ADSC CCD |
| Crystal-to-detector distance (mm) | 250 |
| Space group | P212121 |
| Unit-cell parameters | |
| a (Å) | 51.07 |
| b (Å) | 60.52 |
| c (Å) | 89.28 |
| Resolution | 2.5 (2.64–2.5) |
| VM (Å3 Da−1) | 2.54 |
| Solvent content (%) | 51.62 |
| Monomers in ASU | 2 |
| Data processing | |
| No. of observed reflections | 145887 |
| No. of unique reflections | 10052 |
| Completeness | 99.8 (100) |
| Anomalous completeness | 99.9 (100) |
| Multiplicity | 14.5 (15.0) |
| Anomalous multiplicity | 7.8 (7.9) |
| Mean I/σ(I) | 22.4 (6.2) |
| Rmerge† | 0.114 (0.478) |
R
merge = 
 , where I
i(hkl) is the ith observation of reflection h and 〈I(hkl)〉 is the weighted average intensity for all observations i of reflection h.
4.2. Solution of the MtRsbS selenium substructure
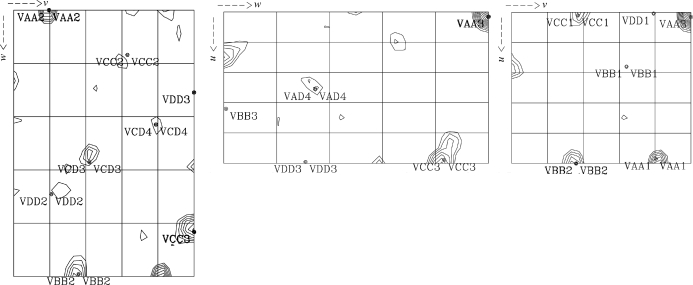
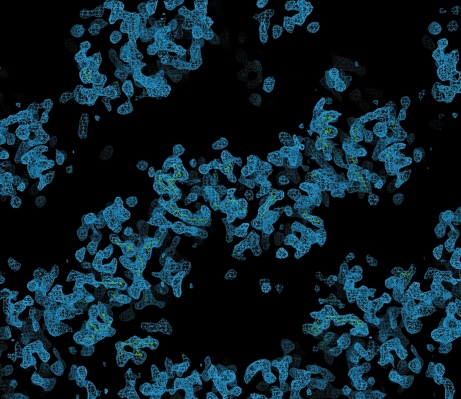
The scaled unmerged data were input into the SHELX (Sheldrick, 2008 ▶) suite of programs for structure solution. Analysis of the 〈d′/σ〉 distribution in SHELXC indicated that a significant anomalous signal was present in data extending to approximately 4.0 Å, which was used as a resolution cutoff for the heavy-atom location search in SHELXD. Four Se atoms were found in SHELXD to give a solution with an overall correlation coefficient of 52%. Analysis of the output of SHELXE indicated a clear difference in the contrast values between the two heavy-atom enantiomorphs; however, neither of the electron-density maps revealed any interpretable protein features. The Se-atom sites output by SHELXD were checked against an anomalous difference Patterson map using data extending to 4.0 Å and were found to correlate well with the observed Patterson peaks (Fig. 2 ▶), indicating that they were correct. These sites were then input into the program SOLVE/RESOLVE (Wang et al., 2004 ▶) for phase refinement and density modification using the ANALYSE_SOLVE keyword option. The electron-density map produced by RESOLVE corresponding to the inverted hand of the heavy-atom sites produced an interpretable electron-density map with phases extending to approximately 3.5 Å resolution (Fig. 3 ▶). An initial model was generated using RESOLVE based on the experimental phases and model building and refinement is currently in progress. To the best of our knowledge, this is the first reported ab initio structure determination from the Macromolecular Crystallography Beamlines at the Diamond Light Source.
Figure 2.
Plots of the u = 0.5 (left), v = 0.5 (centre) and w = 0.5 (right) Harker sections of the anomolous Patterson map for selenomethionine-incorporated MtRsbS showing vectors between the heavy-atom coordinates that were calculated in SHELXD. Contour levels are plotted in 0.5σ steps starting at a level of 1.5σ.
Figure 3.
Section of the 3.5 Å experimentally phased electron-density map produced by the program RESOLVE.
Acknowledgments
The authors would like to thank the beamline staff at I04 for their help, and the BBSRC and Newcastle University for funding.
References
- Amikam, D. & Benziman, M. (1989). J. Bacteriol.171, 6649–6655. [DOI] [PMC free article] [PubMed]
- Byrer, D. E., Rainey, F. A. & Wiegel, J. (2000). Arch. Microbiol.174, 334–339. [DOI] [PubMed]
- Carlier, J. P. & Bedora-Faure, M. (2006). Syst. Appl. Microbiol.29, 581–588. [DOI] [PubMed]
- Chen, C. C., Lewis, R. J., Harris, R., Yudkin, M. D. & Delumeau, O. (2003). Mol. Microbiol.49, 1657–1669. [DOI] [PubMed]
- Delumeau, O., Chen, C. C., Murray, J. W., Yudkin, M. D. & Lewis, R. J. (2006). J. Bacteriol.188, 7885–7892. [DOI] [PMC free article] [PubMed]
- Drake, H. L. & Daniel, S. L. (2004). Res. Microbiol.155, 869–883. [DOI] [PubMed]
- Evans, P. (2006). Acta Cryst. D62, 72–82. [DOI] [PubMed]
- Fontaine, F. E., Peterson, W. H., McCoy, E., Johnson, M. J. & Ritter, G. J. (1942). J. Bacteriol.43, 701–715. [DOI] [PMC free article] [PubMed]
- Hecker, M. & Volker, U. (2001). Adv. Microb. Physiol.44, 35–91. [DOI] [PubMed]
- Kang, C. M., Brody, M. S., Akbar, S., Yang, X. & Price, C. W. (1996). J. Bacteriol.178, 3846–3853. [DOI] [PMC free article] [PubMed]
- Kim, T. J., Gaidenko, T. A. & Price, C. W. (2004). J. Mol. Biol.341, 135–150. [DOI] [PubMed]
- Leslie, A. G. W. (2006). Acta Cryst. D62, 48–57. [DOI] [PubMed]
- Pane-Farre, J., Lewis, R. J. & Stulke, J. (2005). J. Mol. Microbiol. Biotechnol.9, 65–76. [DOI] [PubMed]
- Romling, U. & Amikam, D. (2006). Curr. Opin. Microbiol.9, 218–228. [DOI] [PubMed]
- Ross, P., Mayer, R., Weinhouse, H., Amikam, D., Huggirat, Y., Benziman, M., de Vroom, E., Fidder, A., de Paus, P., Sliedregt, L. A., van der Marel, G. A. & van Boom, J. H. (1990). J. Biol. Chem.265, 18933–18943. [PubMed]
- Sheldrick, G. M. (2008). Acta Cryst. A64, 112–122. [DOI] [PubMed]
- Wang, J. W., Chen, J. R., Gu, Y. X., Zheng, C. D., Jiang, F., Fan, H. F., Terwilliger, T. C. & Hao, Q. (2004). Acta Cryst. D60, 1244–1253. [DOI] [PubMed]
- Winn, M. D. (2003). J. Synchrotron Rad.10, 23–25. [DOI] [PubMed]
- Wise, A. A. & Price, C. W. (1995). J. Bacteriol.177, 123–133. [DOI] [PMC free article] [PubMed]


