The crystal structure of Ca2+-bound human S100A13 at pH 7.5 is reported.
Keywords: human S100A13, calcium-binding proteins
Abstract
S100A13 is a member of the S100 family of EF-hand-containing calcium-binding proteins. S100A13 plays an important role in the secretion of fibroblast growth factor-1 and interleukin 1α, two pro-angiogenic factors released by the nonclassical endoplasmic reticulum/Golgi-independent secretory pathway. The X-ray crystal structure of human S100A13 at pH 7.5 was determined at 1.8 Å resolution. The structure was solved by molecular replacement and was refined to a final R factor of 19.0%. The structure revealed that human S100A13 exists as a homodimer with two calcium ions bound to each protomer. The protomer is composed of four α-helices (α1–α4), which form a pair of EF-hand motifs. Dimerization occurs by hydrophobic interactions between helices α1 and α4 and by intermolecular hydrogen bonds between residues from helix α1 and the residues between α2 and α3 of both chains. Despite the high similarity of the backbone conformation in each protomer, the crystal structures of human S100A13 at pH 7.5 (this study) and at pH 6.0 [Li et al. (2007 ▶), Biochem. Biophys. Res. Commun. 356, 616–621] exhibit recognizable differences in the relative orientation (∼2.5°) of the protomers within the dimer and also remarkable differences in the side-chain conformations of several amino-acid residues.
1. Introduction
S100-family proteins are small acidic calcium-binding proteins containing two EF-hand motifs: a canonical EF-hand at the C-terminus and an S100-specific EF-hand at the N-terminus. They are expressed in a cell- and tissue-specific manner and have been implicated in intracellular and extracellular regulatory activities (Donato, 1999 ▶). Most S100 members exist as homodimers or heterodimers. S100A13 is one of the most recently identified members of the S100 family. Human S100A13 consists of 98 amino-acid residues and has a molecular weight of 11 kDa. Unlike most members of this family, S100A13 is ubiquitously expressed in various tissues (Wicki et al., 1996 ▶) and does not expose hydrophobic patches upon Ca2+ binding, which is thought to be essential for the interaction of the other S100 proteins with their target proteins (Ridinger et al., 2000 ▶).
S100A13 participates in the stress-induced release of the pro-angiogenic polypeptides fibroblast growth factor-1 (FGF-1) and interleukin 1α (IL-1α), which are secreted by the nonclassical endoplasmic reticulum/Golgi-independent pathway (Carreira et al., 1998 ▶; Mandinova et al., 2003 ▶; Prudovsky et al., 2003 ▶). The crystal structures of FGF-1 and IL-1α demonstrated remarkable structural similarity, despite the absence of sequence similarity (Thomas et al., 1985 ▶; Zhang et al., 1991 ▶). Both Ca2+ and Cu2+ ions are needed for the interaction of S100A13 with these proteins (Landriscina et al., 2001 ▶). The binding of Ca2+ to S100A13, which is triggered by Ca2+ influx through N-type Ca2+ channels (Matsunaga & Ueda, 2006 ▶), is likely to form the Cu2+-binding sites on S100A13 (Arnesano et al., 2005 ▶). The solution structures of human S100A13 at pH 5.6 in the presence and absence of Ca2+ (PDB codes 1yut and 1yur, respectively) have been reported (Arnesano et al., 2005 ▶). In addition, the 2.0 Å crystal structure of human S100A13 at pH 6.0 in the presence of Ca2+ has very recently been reported (Li et al., 2007 ▶). Here, we report the 1.8 Å crystal structure of the Ca2+-bound form of homodimeric human S100A13 at the physiological pH 7.5 and compare it with the solution structures at pH 5.6 and the crystal structure at pH 6.0.
2. Materials and methods
2.1. Expression and purification
Human S100A13 cDNA (GenBank accession No. AK097132) cloned from a first-strand cDNA library from human spleen (Origene Technologies) was amplified by polymerase chain reaction (PCR) and subcloned into the NdeI/BamHI site of pET-16b vector (Novagen). Escherichia coli BL21(DE3) cells harbouring the expression vector pET-16b-human S100A13 were grown at 310 K. The expression of S100A13 with an N-terminal 10×His tag was induced at an OD600 of 0.6 with 1 mM isopropyl β-d-1-thiogalactopyranoside (IPTG) and the culture was continued at 310 K for 4 h. The cells were harvested by centrifugation at 3000g for 10 min at 277 K, disrupted by sonication and centrifuged at 26 000g for 20 min at 277 K. The supernatant was applied onto a His-Bind affinity chromatography column precharged with Ni2+ (Novagen). The 10×His-tagged human S100A13 eluted from the resin was digested with factor Xa protease (Novagen, 10 U enzyme per milligram of protein substrate) at room temperature for 4 h, which resulted in human S100A13 with one additional histidine residue at the N-terminus. The cleaved protein was subjected to an Econo-Pac High Q (Bio-Rad) anion-exchange column equilibrated with 25 mM Tris–HCl pH 8.1 and eluted with a linear gradient of 0–0.1 M NaCl. Fractions containing the purified S100A13 were concentrated to 7.4 mg ml−1.
2.2. Crystallization and data collection
Crystallization experiments were performed using the hanging-drop vapour-diffusion method. Calcium chloride was added to the protein solution to a final concentration of 2 mM prior to crystallization in order to obtain the calcium-bound form of S100A13. Crystals were obtained in two weeks by mixing 0.5 µl protein solution (7.4 mg ml−1 in 25 mM Tris–HCl pH 8.1, 0.1 M NaCl and 2 mM CaCl2) and 0.5 µl of a reservoir solution consisting of 22%(w/v) PEG 3350, 0.1 M HEPES–NaOH pH 7.5, 0.2 M NaCl and 1.5%(w/v) 1,2,3-heptanetriol. The drop was equilibrated against 500 µl reservoir solution at 293 K.
X-ray diffraction data were collected on beamline BL41XU at SPring-8 (Harima, Japan). The wavelength was set to 1.000 Å and the distance between the crystal and the detector was set to 200 mm. The diffraction data were indexed, integrated and scaled using HKL-2000 (Otwinowski & Minor, 1997 ▶). The best crystal diffracted X-rays beyond 1.8 Å resolution and the diffraction data set was scaled to 1.80 Å resolution. The crystal belonged to space group P212121, with unit-cell parameters a = 39.8, b = 59.3, c = 77.6 Å. The crystal contains two S100A13 molecules in the asymmetric unit (V M = 2.0 Å3 Da−1, solvent content = 38%).
2.3. Structure determination and refinement
The structure of S100A13 was solved using the CCP4 program suite (Collaborative Computational Project, Number 4, 1994 ▶). Molecular replacement with MOLREP (Vagin & Teplyakov, 1997 ▶) produced a good solution when the protein atomic coordinates of S100A8 in the S100A8–S100A9 heterodimer (PDB code 1xk4; I. P. Korndoerfer, F. Brueckner & A. Skerra, unpublished results) were used as the search model. Initial model building was performed with ARP/wARP (Perrakis et al., 1999 ▶). Iterative model fitting and restrained refinement were performed with Coot (Emsley & Cowtan, 2004 ▶) and REFMAC5 (Murshudov et al., 1997 ▶). The two S100A13 molecules in the asymmetric unit (chains A and B) formed a homodimer. TLS (Winn et al., 2001 ▶) and restrained refinement in REFMAC5 was used as the final refinement, in which the chains A and B were divided into 14 and 15 TLS groups, respectively. The refined structure was validated with PROCHECK (Laskowski et al., 1993 ▶). The refined 1.80 Å structure has an R factor of 19.0% and a free R of 22.7%. The data-collection and refinement statistics are shown in Table 1 ▶. Molecular graphics were generated with PyMOL (DeLano, 2002 ▶). Dimer-interface interactions were analyzed with PISA (Krissinel & Henrick, 2005 ▶). Interhelical angles were calculated with MOLMOL (Koradi et al., 1996 ▶). Superpositions of three-dimensional protein structures were made with CCP4. The atomic coordinates and experimental structure factors of human S100A13 at pH 7.5 have been deposited in the PDB under code 2egd, where chains A and B correspond to chains A and B of PDB entry 2h2k, the crystal structure of human S100A13 at pH 6.0 with the same space group P212121 and similar unit-cell parameters a = 40.2, b = 60.7, c = 78.5 Å (Li et al., 2007 ▶).
Table 1. Summary of data-collection and refinement statistics.
| Data-collection statistics | |
| Wavelength () | 1.000 |
| Space group | P212121 |
| Unit-cell parameters () | a = 39.8, b = 59.3, c = 77.6 |
| Resolution range () | 50.01.80 (1.861.80) |
| Observed reflections | 122381 |
| Unique reflections | 17786 |
| Data completeness (%) | 99.1 (93.0) |
| Redundancy | 6.9 (6.3) |
| R merge † | 0.066 (0.335) |
| I/(I) | 30.7 (3.4) |
| Refinement statistics | |
| Resolution range () | 50.01.80 |
| R factor (%) | 19.0 |
| R free (5.0% total data) (%) | 22.7 |
| No. of reflections used for refinement | 16686 |
| No. of protein residues | 86 (chain A) and 90 (chain B) |
| No. of Ca2+ ions | 4 |
| No. of water molecules | 101 |
| Average B values (2) | |
| Protein atoms | 25.4 |
| Ca2+ ions | 23.1 |
| Water O atoms | 38.5 |
| R.m.s. bond-length deviations () | 0.017 |
| R.m.s. bond-angle deviations () | 1.378 |
| Ramachandran plot | |
| Most favoured regions (%) | 93.3 |
| Additional allowed regions (%) | 6.7 |
| Generously allowed regions (%) | 0 |
| Disallowed regions (%) | 0 |
R
merge = 
 , where I
i(hkl) is the ith observation of reflection hkl and
  is the weighted average intensity for all observations i of reflection hkl.
3. Results and discussion
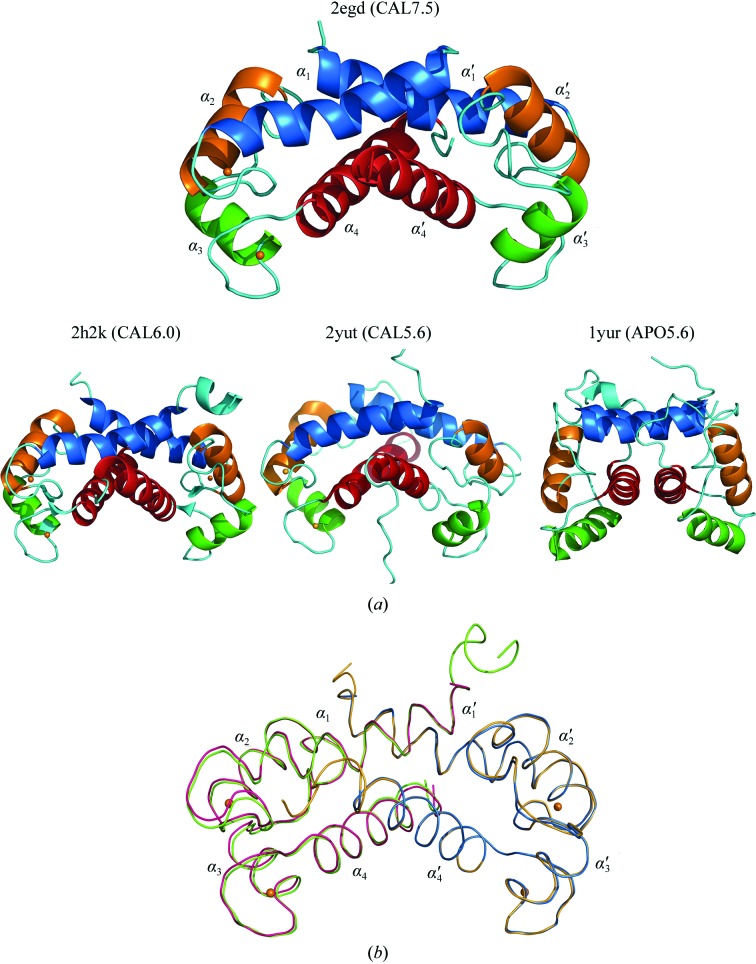
The crystallization and preliminary X-ray analysis of S100A13 have previously been reported (Imai et al., 2006 ▶). The 1.8 Å crystal structure of human S100A13 at pH 7.5 (referred to in this paper as CAL7.5; PDB code 2egd) was solved by molecular replacement (Fig. 1 ▶ a). S100A13 exists as a homodimer (chains A and B) with two Ca2+ ions bound to each protomer. Each protomer is composed of four α-helices (α1–α4), which form a pair of EF-hand motifs. The N-terminal EF-hand (EF1) is composed of helix α1 (Glu8–Ala24), a Ca2+-binding loop (Arg25–Ser34) and helix α2 (Val35–Gln45). The C-terminal EF-hand (EF2) is composed of helix α3 (Leu56–Leu63), a second Ca2+-binding loop (Asp64–Tyr72) and helix α4 (Phe73–Tyr90). These EF-hands are joined by a hinge region (Leu46–Ser55).
Figure 1.
Three-dimensional structures of human S100A13. (a) Ribbon diagrams showing the crystal structures of a Ca2+-bound S100A13 homodimer at pH 7.5 (CAL7.5; PDB code 2egd) and at pH 6.0 (CAL6.0; PDB code 2h2k) and the solution structures of Ca2+-bound and Ca2+-free S100A13 at pH 5.6 (CAL5.6 and APO5.6; PDB codes 1yut and 1yur, respectively). The helices in chain A are labelled α1, α2, α3, α4 and the helices in chain B are labelled α1′, α2′, α3′, α4′. Ca2+ ions are shown as orange spheres. (b) Comparison between the CAL7.5 and CAL6.0 backbone structures. When the B chains of CAL7.5 (blue) and CAL6.0 (yellow) are superposed, the A chains (pink and green lines for CAL7.5 and CAL6.0, respectively) are placed in slightly different orientations.
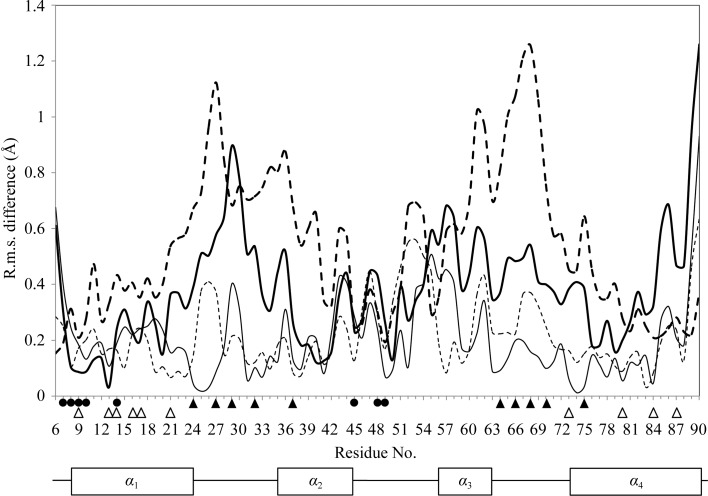
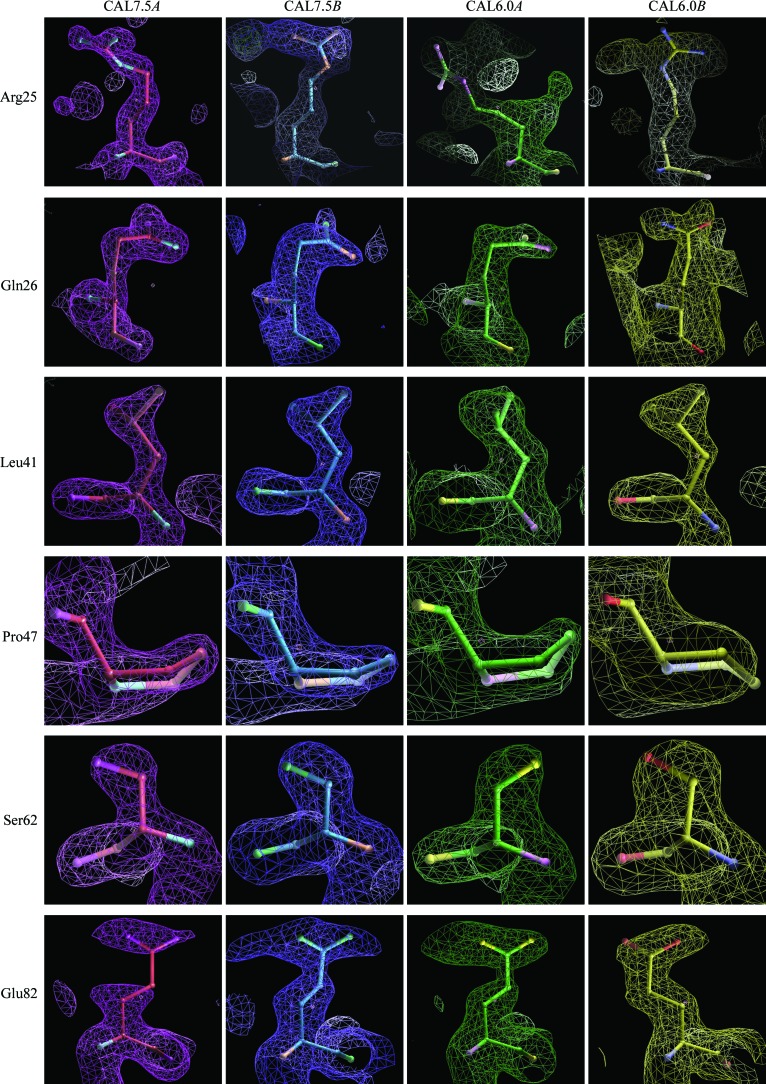
To date, three structures of human S100A13 have been reported: solution structures at pH 5.6 of the Ca2+-bound form (CAL5.6; PDB code 1yut) and of the apo form (APO5.6; PDB code 1yur) (Arnesano et al., 2005 ▶) and the 2.0 Å crystal structure at pH 6.0 (CAL6.0; PDB code 2h2k; Li et al., 2007 ▶; Fig. 1 ▶ a). The atomic (Cα) r.m.s. differences between our crystal structure (CAL7.5) and these structures at different pH values are shown in Table 2 ▶. Comparison with the solution structures shows that CAL7.5 is moderately similar to CAL5.6, while it shows less similarity to APO5.6 because of the conformational changes that occur upon Ca2+ binding (Fig. 2 ▶ a). The two crystal structures CAL7.5 and CAL6.0 were both obtained from P212121 crystals grown by the hanging-drop vapour-diffusion method and had similar unit-cell parameters. The CAL7.5 crystal (P212121; a = 39.8, b = 59.3, c = 77.6 Å) was obtained from nontagged human S100A13 at pH 7.5 and 293 K with 22%(w/v) PEG 3350 as the precipitant in the presence of 2 mM Ca2+, whereas the CAL6.0 crystal (P212121; a = 40.2, b = 60.7, c = 78.5 Å) was obtained from human S100A13 with an N-terminal 6×His tag at pH 6.0 and 277 K with 25%(v/v) PEG MME 550 as the precipitant in the presence of 10 mM Ca2+. Chains A and B of CAL7.5 correspond to chains A and B of CAL6.0, respectively. CAL7.5 and CAL6.0 are quite similar, with atomic (Cα) r.m.s. differences of 0.25 and 0.26 Å for chains A and B, respectively, and of 0.31 Å overall (Table 2 ▶). However, there are recognizable differences between CAL7.5 and CAL6.0 (∼2.5°) in the relative orientations of the protomers within the dimer; when the B chains of CAL7.5 and CAL6.0 are superposed, the helices in their A chains are differently oriented by 2.2° (α2), 2.7° (α3) and 2.6° (α4) (Fig. 1 ▶ b). Consistently, relatively large r.m.s. differences are seen in helices α2, α3 and α4 as well as in the Ca2+-binding loops (Figs. 1 ▶ b and 2 ▶). In addition, side-chain conformational differences are observed for Arg25, Leu41, Ser62, Asn66, Lys72, Asn74, Lys85 and Arg88 in the A chains of CAL7.5 and CAL6.0 and for Arg25, Gln26, Glu40, Thr43, Pro47, His48 and Glu82 in the B chains of CAL7.5 and CAL6.0 (Fig. 3 ▶). With the exception of that of Leu41, all of these side chains are exposed to solvent, indicating that the exposed side chains underwent conformational adjustments when incorporated into the P212121 crystals at different pH values. On the other hand, the side chain of Leu41 is buried in the molecule and is involved in the hydrophobic cluster. The side-chain conformations of the Leu41 residues in chains A and B of CAL7.5 and in chain B of CAL6.0 are almost the same (χ2 = 149.2 ± 3.9°), whereas that in chain A of CAL6.0 differs (χ2 = 87.1°). Since the side chains of the four Leu41 residues fit well to the respective 2F o − F c electron densities with no recognizable F o − F c densities (Fig. 3 ▶), the side chain of Leu41 of S100A13 can adopt two conformations at pH 6.0. Since most human cells maintain the cytosolic pH at about 7.2 (Alberts et al., 2002 ▶), our crystal structure at pH 7.5 (CAL7.5) should reflect the physiologically active form of S100A13.
Table 2. C r.m.s. differences between S100A13 structures at pH 7.5 (CAL7.5) and at other pH values.
(a).
R.m.s.d. between S100A13 homodimers.
(b).
R.m.s.d. between S100A13 protomers.
| CAL7.5 (2egd) | ||
|---|---|---|
| Chain A | Chain B | |
| CAL7.5 (2egd) | ||
| Chain A | 0.200 | |
| Chain B | 0.222 | |
| CAL6.0 (2h2k) | ||
| Chain A | 0.259 | 0.299 |
| Chain B | 0.234 | 0.254 |
| CAL5.6 (1yut) | ||
| Chain A | 1.909 | 1.935 |
| Chain B | 1.998 | 2.045 |
| APO5.6 (1yur) | ||
| Chain A | 5.078 | 5.086 |
| Chain B | 5.040 | 5.045 |
R.m.s.d. when chains A and B of CAL7.5 are superposed onto chains A and B, respectively, of the other S100A13 structure.
R.m.s.d. when chains A and B of CAL7.5 are superposed onto chains B and A, respectively, of the other S100A13 structure.
Figure 2.
Atomic (Cα) r.m.s. difference of each residue between CAL7.5 and CAL6.0. The r.m.s. differences between the A chains are shown as thin lines and those between the B chains are shown as thin dashed lines when the corresponding chains are superposed. The r.m.s. differences between the A chains are shown as thick lines and those between the B chains are shown as thick dashed lines when the other chains are superposed. Residues that participate in interchain hydrogen bonds and hydrophobic interactions are indicated by spheres and white triangles, respectively. Ca2+-binding residues are indicated by black triangles. Secondary-structure elements are shown below the graph.
Figure 3.
Amino-acid residues with different side-chain conformations in CAL7.5 and CAL6.0. The amino-acid residues and their electron densities were coloured pink, blue, green and yellow for CAL7.5 chain A, CAL7.5 chain B, CAL6.0 chain A and CAL6.0 chain B, respectively.
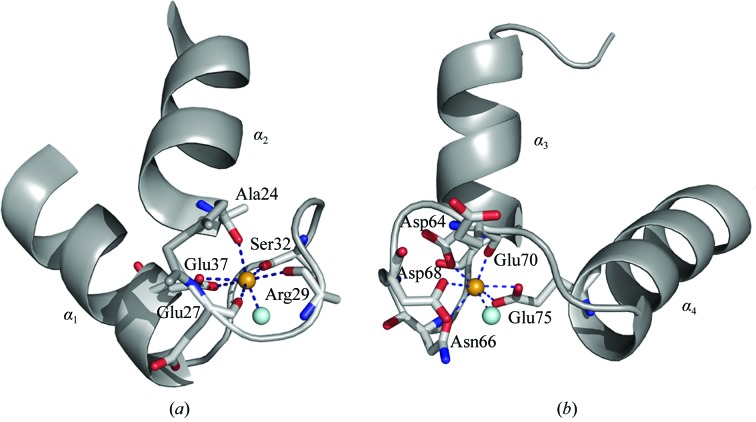
In the S100-specific EF-hand (EF1) the main-chain carbonyl O atoms of Ala24, Glu27, Arg29 and Ser32, the side-chain O atoms of Glu37 and a water O atom coordinate to a Ca2+ ion (Fig. 4 ▶ a), while in the canonical EF-hand (EF2) the main-chain carbonyl O atom of Glu70, the side-chain O atoms of Asp64, Asn66, Asp68 and Glu75, and a water O atom coordinate to a Ca2+ ion (Fig. 4 ▶ b). A water molecule of EF1 might interact with the side chain of Glu70 in EF2, forming a possible site of cooperativity of the two EF-hands, as observed by Li et al. (2007 ▶). The presence of Arg29 in the Z position in EF1 of S100A13 is unusual among the Ca2+-binding loops of EF-hand proteins (Marsden et al., 1990 ▶). S100A13 differs in Ca2+-binding affinity from other S100 proteins. In general, the four Ca2+-binding sites of homodimeric S100 proteins, e.g. S100A2, S100A3, S100A4, S100A5, S100A6 and S100A11, display almost equal affinities for Ca2+ ions and a positive cooperativity (Heizmann & Cox, 1998 ▶). In contrast, those in S100A13 display two different sets of affinities for Ca2+ ions (Ridinger et al., 2000 ▶), which indicates that the unusual Arg in the Z position of EF1 in S100A13 probably diminishes the Ca2+-binding affinity.
Figure 4.
The Ca2+-binding sites of S100A13 in the N-terminal (a) and the C-terminal (b) EF-hands. The residues that participate in the coordination of Ca2+ are shown as stick models. The bound Ca2+ ion is shown as an orange sphere and the coordinating water molecule is shown as a cyan sphere.
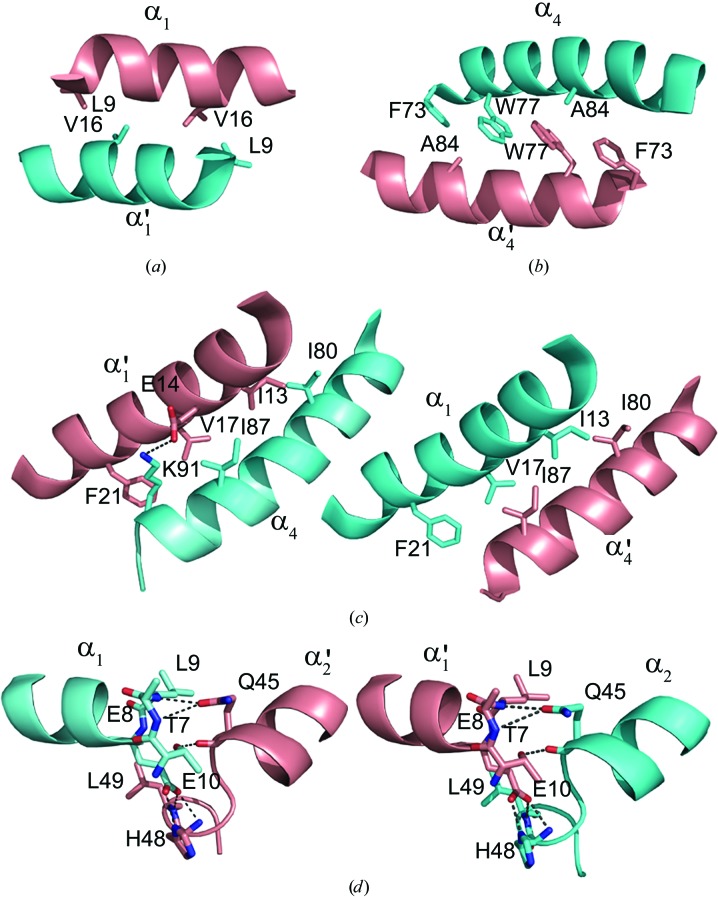
The dimer interface of S100A13 has an accessible surface area of 1380 Å2, covering approximately 24% of the total accessible surface area of each protomer. The interface residues are located in helices α1 and α4 and in the hinge region between α2 and α3. The dimer interface is mainly built up by hydrophobic interactions between α1 and α1′, α4 and α4′, α1 and α4′, and α4 and α1′ (Figs. 5 ▶ a, 5 ▶ b and 5 ▶ c). The intermolecular hydrogen bonds are mainly located between α1 and the hinge region of the other protomer, as shown in Fig. 5 ▶(d). The pattern of intermolecular interactions is similar to those found in the S100A6 homodimer (PDB code 1k9k; Otterbein et al., 2002 ▶) and the S100A8/–S100A9 heterodimer (PDB code 1xk4). The dimer-interface residues located in helix α1 and the hinge region between α2 and α3 are well conserved among these S100-family proteins.
Figure 5.
The dimer interface of the S100A13 homodimer. The segments of chains A and B are coloured pink and cyan, respectively. (a) The interface between helices α1 and α1′. (b) The interface between α4 and α4′. (c) The interface between α1/α4′ and α1′/α4. (d) Intermolecular hydrogen bonds between α1 and the hinge region. Thr7 (Oγ1), Glu8 (N), Leu9 (N), Glu10 (O∊1 and O∊2), Gln45 (O and O∊1), His48 (N and Nδ1) and Leu49 (N) of both chains participate in the hydrogen bonding between the protomers. The side chains involved in the dimer interface are shown in the stick model. O and N atoms are coloured red and blue, respectively. Hydrogen bonds are shown as broken lines.
S100A13 can form a multiprotein complex with FGF-1 and p40 synaptotagmin (Carreira et al., 1998 ▶; Landriscina et al., 2001 ▶). This ternary complex formation is essential for the stress-induced release of FGF-1, which is inhibited by the anti-inflammatory drug amlexanox (Carreira et al., 1998 ▶), a specific binder of S100A13 (Shishibori et al., 1999 ▶). FGF-1 is a pro-angiogenic factor that induces endothelial cell proliferation and differentiation and plays an important role in chronic inflammatory diseases (Lai & Adams, 2005 ▶) such as rheumatoid arthritis (Malemud, 2007 ▶). A VAST structural-homology search (http://www.ncbi.nlm.nih.gov/structure/VAST/vastsearch.html) revealed the structural similarity of the S100A13 homodimer (CAL7.5) to the S100A8–S100A9 heterodimer (PDB code 1xk4) and the S100A1 homodimer (PDB code 1zfs; Wright et al., 2005 ▶), with r.m.s. differences of 1.2 and 2.5 Å, respectively. Interestingly, these structurally similar proteins are functionally related to inflammatory conditions. The S100A1 homodimer binds amlexanox (Okada et al., 2002 ▶) as does S100A13, while the S100A8–S100A9 heterodimer, which is implicated in Ca2+-dependent functions during inflammation (Odink et al., 1987 ▶), is expressed in human peripheral blood mononuclear cells under inflammatory conditions and in rheumatoid arthritis (Brun et al., 1992 ▶).
The basic C-terminal part of S100A13 has a flexible character as in S100A9 (Itou et al., 2002 ▶) as shown by the unobserved electron densities for the C-terminal eight and three residues (91–98 and 96–98) in chains A and B of CAL7.5, respectively. The C-terminus of chain B is less flexible owing to the crystal packing. Since the C-terminal region is implicated in intermolecular interaction with FGF-1 and amlexanox, the flexible character of this region would be important for the ternary complex formation for FGF-1 secretion (Landriscina et al., 2001 ▶).
Supplementary Material
PDB reference: calcium-bound human S100A13, 2egd, r2egdsf
Acknowledgments
Synchrotron-radiation experiments were performed at SPring-8 (Harima, Japan) with the approval of the Japan Synchrotron Radiation Research Institute (Proposal Nos. 2006A2721 and 2006A2728). This work was supported in part by the National Project on Protein Structural and Functional Analyses (NPPSFA) and Targeted Proteins Research Program (TPRP) of the Ministry of Education, Culture, Sports, Science and Technology of Japan and by the Grants-in-Aid from The Japan Society for the Promotion of Science (JSPS).
References
- Alberts, B., Johnson, A., Lewis, J., Raff, M., Roberts, K. & Walter, P. (2002). Molecular Biology of the Cell, p. 622. New York/London: Garland Science.
- Arnesano, F., Banci, L., Bertini, I., Fantoni, A., Tenori, L. & Viezzoli, M. S. (2005). Angew. Chem. Int. Ed. 44, 2–5. [DOI] [PubMed]
- Brun, J. G., Haga, H. J., Boe, E., Kallay, I., Lekven, C., Berntzen, H. B. & Fagerhol, M. K. (1992). J. Rheumatol. 19, 859–862. [PubMed]
- Carreira, C. M., La Vallee, T. M., Tarantini, F., Jackson, A., Lathrop, J. T., Hampton, B., Burgess, W. H. & Maciag, T. (1998). J. Biol. Chem. 273, 22224–22231. [DOI] [PubMed]
- Collaborative Computational Project, Number 4 (1994). Acta Cryst. D50, 760–763.
- DeLano, W. L. (2002). The PyMOL Molecular Graphics System. http://www.pymol.org/.
- Donato, R. (1999). Biochim. Biophys. Acta, 1450, 191–231. [DOI] [PubMed]
- Emsley, P. & Cowtan, K. (2004). Acta Cryst. D60, 2126–2132. [DOI] [PubMed]
- Heizmann, C. W. & Cox, J. A. (1998). Biometals, 11, 383–397. [DOI] [PubMed]
- Imai, F. L., Nagata, K., Yonezawa, N., Yu, J., Ito, E., Kanai, S., Tanokura, M. & Nakano, M. (2006). Acta Cryst. F62, 1144–1146. [DOI] [PMC free article] [PubMed]
- Itou, H., Yao, M., Fujita, I., Watanabe, N., Suzuki, M., Nishihira, J. & Tanaka, I. (2002). J. Mol. Biol. 316, 265–276. [DOI] [PubMed]
- Koradi, R., Billeter, M. & Wüthrich, K. (1996). J. Mol. Graph. 14, 51–55. [DOI] [PubMed]
- Krissinel, E. & Henrick, K. (2005). CommpLife 2005, edited by M. R. Berthold, R. Glen, K. Diederichs, O. Kohlbacher & I. Fischer, pp. 163–174. Berlin/Heidelberg: Springer-Verlag.
- Lai, W. K. & Adams, D. H. (2005). J. Hepatol. 42, 7–11. [DOI] [PubMed]
- Landriscina, M., Bagala, C., Mandinova, A., Soldi, R., Micucci, I., Bellum, S., Prudovsky, I. & Maciag, T. (2001). J. Biol. Chem. 276, 25549–25557. [DOI] [PubMed]
- Laskowski, R. A., MacArthur, M. W., Moss, D. S. & Thornton, J. M. (1993). J. Appl. Cryst. 26, 283–291.
- Li, M., Zhang, P. F., Pan, X. W. & Chang, W. R. (2007). Biochem. Biophys. Res. Commun. 356, 616–621. [DOI] [PubMed]
- Malemud, C. J. (2007). Clin. Chim. Acta, 375, 10–19.
- Mandinova, A., Soldi, R., Graziani, I., Bagala, C., Bellum, S., Landriscina, M., Tarantini, F., Prudovsky, I. & Maciag, T. (2003). J. Cell Sci. 116, 2687–2696. [DOI] [PubMed]
- Marsden, B. J., Shaw, G. S. & Sykes, B. D. (1990). Biochem. Cell Biol. 68, 587–601. [DOI] [PubMed]
- Matsunaga, H. & Ueda, H. (2006). Cell. Mol. Neurobiol. 26, 237–246. [DOI] [PMC free article] [PubMed]
- Murshudov, G. N., Vagin, A. A. & Dodson, E. J. (1997). Acta Cryst. D53, 240–255. [DOI] [PubMed]
- Odink, K., Cerletti, N., Bruggen, J., Clerc, R. G., Tarcsay, L., Zwadlo, G., Gerhards, G., Schelegel, R. & Sorg, C. (1987). Nature (London), 330, 80–82. [DOI] [PubMed]
- Okada, M., Tokumitsu, H., Kubota, Y. & Kobayashi, R. (2002). Biochem. Biophys. Res. Commun. 292, 1023–1030. [DOI] [PubMed]
- Otterbein, L. R., Kordowska, J., Witte-Hoffmann, C., Wang, C.-L. A. & Dominguez, R. (2002). Structure, 10, 557–567. [DOI] [PubMed]
- Otwinowski, Z. & Minor, W. (1997). Methods Enzymol. 276, 307–326. [DOI] [PubMed]
- Perrakis, A., Morris, R. & Lamzin, V. S. (1999). Nature Struct. Biol. 6, 458–463. [DOI] [PubMed]
- Prudovsky, I., Mandinova, A., Soldi, R., Bagala, C., Graziani, I., Landriscina, M., Tarantini, F., Duarte, M., Bellum, S., Doherty, H. & Maciag, T. (2003). J. Cell Sci. 116, 4871–4881. [DOI] [PubMed]
- Ridinger, K., Schafer, B. W., Durussel, I., Cox, J. A. & Heizmann, C. W. (2000). J. Biol. Chem. 275, 8686–8694. [DOI] [PubMed]
- Shishibori, T., Oyama, Y., Matsushita, O., Yamashita, K., Furuichi, H., Okabe, A., Maeta, H., Hata, Y. & Kobayashi, R. (1999). Biochem. J. 338, 583–589. [PMC free article] [PubMed]
- Thomas, K. A., Rios-Candelore, M., Gimenez-Gallego, G., DiSalvo, J., Bennett, C., Rodkey, J. & Fitzpatrick, S. (1985). Proc. Natl Acad. Sci. USA, 82, 6409–6413. [DOI] [PMC free article] [PubMed]
- Vagin, A. & Teplyakov, A. (1997). J. Appl. Cryst. 30, 1022–1025.
- Wicki, R., Schafer, B. W., Erne, P. & Heizmann, C. W. (1996). Biochem. Biophys. Res. Commun. 227, 594–599. [DOI] [PubMed]
- Winn, M. D., Isupov, M. N. & Murshudov, G. N. (2001). Acta Cryst. D57, 122–133. [DOI] [PubMed]
- Wright, N. T., Varney, K. M., Ellis, K. C., Markowitz, J., Gitti, R. K., Zimmer, D. B. & Weber, D. J. (2005). J. Mol. Biol. 353, 410–426. [DOI] [PubMed]
- Zhang, J. D., Cousens, L. S., Barr, P. J. & Sprang, S. R. (1991). Proc. Natl Acad. Sci. USA, 88, 3446–3450. [DOI] [PMC free article] [PubMed]
Associated Data
This section collects any data citations, data availability statements, or supplementary materials included in this article.
Supplementary Materials
PDB reference: calcium-bound human S100A13, 2egd, r2egdsf


