

Abstract
Addition of 8-anilino-1-naphthalenesulfonate (ANS) to acid-denatured pectate lyase C (pelC) leads to a large increase in the fluorescence quantum yield near 480 nm. The conventional interpretation of such an observation is that the ANS is binding to a partially folded intermediate such as a molten globule. Far-ultraviolet circular dichroism demonstrates that the enhanced fluorescence results from the induction of a partially folded protein species that adopts a large fraction of native-like secondary structure on binding ANS. Thus, ANS does not act as a probe to detect a partially folded species, but induces such a species. Near-ultraviolet circular dichroism suggests that ANS is bound to the protein in a specific conformation. The mechanism of ANS binding and structure induction was probed. The interaction of acid-unfolded pelC with several ANS analogs was investigated. The results strongly indicate that the combined effects of hydrophobic and electrostatic interactions account for the relatively high binding affinity of ANS for acid-unfolded pelC. These results demonstrate the need for caution in interpreting enhancement of ANS fluorescence as evidence for the presence of molten globule or other partially folded protein intermediates.
Keywords: Pectate lyase C, ANS, molten globule, electrostatic stabilization, circular dichroism
ANS is an amphipathic dye, with hydrophobic naphthalene and phenyl groups, and a charged sulfonate group. It is frequently used for the investigation of equilibrium and kinetic protein folding intermediates (Semisotnov et al. 1987; Ptitsyn et al. 1990; Semisotnov et al. 1991). When ANS is bound to a protein in a nonpolar environment, there is a large increase in the fluorescence quantum yield (Stryer 1965; Turner and Brand 1968). ANS has been used extensively as a probe for protein folding intermediates, especially molten globules, because their partially structured nature provides access for ANS to bind exposed hydrophobic regions (Ptitsyn et al. 1990), whereas ANS has a very weak affinity for fully unfolded or folded proteins. ANS has also been widely used as a probe for kinetic intermediates in protein folding (Semisotnov et al. 1987; Ptitsyn et al. 1990). Partially folded transient species will bind ANS, and the time dependence of its emission is indicative of the lifetime of the species.
Acid denaturation is a widely used method of inducing protein conformational transitions. The major cause of acid denaturation of proteins is the charge–charge repulsion of basic amino acid side chains that have uncompensated positive charges resulting from the neutralization of carboxylate groups. It has been shown that addition of excess acid to an acid-denatured protein can induce a significant fraction of secondary structure (Goto et al. 1990a). A similar result is obtained on the addition of neutral salts (Goto et al. 1990b). This has been interpreted as the formation of a molten globule state stabilized by the binding of anions (Goto and Fink 1989; Goto et al. 1990a,b). Other recent work has demonstrated that the addition of ANS to acid-denatured cytochrome c also induces the formation of a partially folded conformation, or molten globule (Ali et al. 1999). Refolding occurs because the sulfonate group of ANS behaves as a counterion to the positive charges, reducing the charge density, thus permitting refolding. ANS has also been reported to act as a conformational tightening agent to acid-expanded bovine serum albumin and >-globulin (Matulis et al. 1999). In this paper we demonstrate that a similar phenomenon occurs in the acid-unfolded form of pelC from Erwinia chrysanthemi.
PelC is a member of the parallel β-helix class of proteins (Jurnak et al. 1994; Yoder and Jurnak 1995). It contains a relatively large number of amino acids with basic side chains. Of the 353 amino acids, 37 are lysine, arginine, or histidine; only 32 are glutamate or aspartate; and the pI is 9. We propose that ANS acts as a counterion that neutralizes some of the positive charges in acid-unfolded pelC, causing subsequent burial of the dye and increased ANS fluorescence. The relatively high affinity of ANS for pelC results from a combination of hydrophobic and ionic interactions. The results we present indicate that caution should be exercised in inferring the existence of folding intermediates in acid denaturation, based on ANS binding alone.
Results
PelC, like many proteins, is susceptible to denaturation by acid. ANS fluorescence emission was used to probe the structure of pelC at pH 2. CD spectroscopy was further used to assess any structural changes in acid-unfolded pelC on addition of ANS.
The fluorescence quantum yield of ANS is dramatically increased when the dye is in a nonpolar environment, as compared with an aqueous environment. Hydrophobic regions in a partially structured protein provide such an environment. Partially unfolded proteins may be present in a protein solution at low pH, in high salt, or in the presence of moderate concentrations of chaotropic denaturants. Figure 1 ▶ shows that, as the pH of a solution of pelC is lowered below 4, the fluorescence emission of added ANS increases. The emission is 50-fold more intense at pH 2 than at pH 7, which indicates the presence of a stable hydrophobic core or binding pocket. This was surprising because evidence from CD experiments indicated that pelC was completely unfolded at pH 2 (Kamen et al. 2000). Further CD experiments were conducted to determine if ANS interacts with acid-unfolded pelC.
Fig. 1.

Fluorescence emission spectra of pelC/ANS complex at pH 2–9. The cluster of solid lines at approximately zero intensity is pH 4–8, pH 9 (dot and dash), pH 3 (dash), and pH 2 (solid). Protein:ANS ratios were 1:200.
Figure 2 ▶ shows the far-UV CD spectra of pelC alone and in complex with ANS at pH 2. The CD spectrum of pelC alone at pH 2 shows the characteristics of an unfolded protein conformation (Fig. 2B ▶). There is a slight negative shoulder at 220 nm and a very prominent negative band at 200 nm. Spectral features such as these are very typical of an unordered protein, which is an ensemble of many conformations. Titration with ANS results in a dramatic change in the shape of the CD spectrum as a complex between ANS and pelC forms. The shoulder at 220 nm evolves into a very distinct band with a broad minimum at 216 nm. The negative band at 200 nm in the unordered protein spectrum, in the absence of ANS, evolves into a positive band with a maximum at about 192 nm on addition of 50-fold excess of ANS. A CD spectrum of this type is characteristic of β-sheet, which is the dominant type of secondary structure in pelC (Fig. 2B ▶). The binding of ANS to pelC appears to be responsible for the induction of secondary structure in acid-unfolded pelC. This is a very interesting result because it raises further questions about the usefulness of ANS as a probe for partially folded protein conformations. If in fact the probe that is used to observe these structures is actually inducing an intermediate conformation, other independent probes are required to substantiate the existence of partially folded intermediates.
Fig. 2.

(A) Far-UV CD spectra of pelC (5 μM) with increasing concentration of ANS. The inset to A shows the ellipticity values at 200 nm (filled circles) and 215 nm (filled triangles). PelC:ANS ratios were 1:1, 2, 5, 10, 12, 15, 20, 30, 40, and 50. Arrows indicate the direction of increasing ANS concentration. (B) Far-UV CD spectra of pelC at pH 2 (dashed line) and pH 7 (solid line) without ANS.
The far-UV CD spectrum of a protein can be deconvoluted to estimate the fractions of secondary structure components (Greenfield and Fasman 1969; Sreerama and Woody 2000). An analysis of the secondary structure of pelC under several conditions is shown in Table 1. The far-UV CD spectrum of pelC in the native state in water was compared with the acid-unfolded state at pH 2 and the acid-unfolded state at pH 2 with 50-fold excess of ANS. An analysis of the CD data indicates that β-sheet and α-helix are stabilized (their fractions increase) and a significant fraction of unordered structure (∼50%) is lost on the addition of ANS. Compared with native pelC, the ANS-induced intermediate has about 60% higher β-sheet content as estimated by CD. In fact, the CD-derived estimates of α-helix and β-sheet fractions for the ANS-induced form agree better with the X-ray data for the native structure than do the CD-derived data for the native protein. The poor estimates from CD for the native structure may be attributable to the absence of proteins with a similar β-sheet architecture in the reference proteins used in the CD analysis. Alternatively, contributions of aromatic side chains in the native protein that are absent in the ANS-induced conformation may be responsible for the poor analysis of the native structure by CD. In any case, the analysis is consistent with our proposed model.
Table 1.
Percentages of secondary structure determined by CD or X-ray crystallography for pelC
| α-Helix | β-Sheet | Turns | Unordered | |
| Native (CD) | 24 ± 4 | 21 ± 3 | 22 ± 1 | 31 ± 2 |
| Native (DSSP) | 9 | 32 | 8 | 51 |
| pH 2/no ANS | 8 ± 2 | 16 ± 4 | 13 ± 1 | 64 ± 3 |
| pH 2/1:50 ANS | 10 ± 3 | 36 ± 1 | 23 ± 2 | 31 ± 3 |
Secondary structures calculated by CD are an average from three methods, and the reported errors are the standard deviation. (Provencher and Glöckner 1981; Sreerama and Woody 2000; Johnson 1999).
Secondary structures determined from X-ray crystallography are from the DSSP method (Kabsch and Sander 1983).
Near-UV CD was also used to study the pelC/ANS complex. A significant induced CD occurs in the near-UV spectrum when ANS is bound to model β-sheet peptides at alkaline pH (Sato and Woody 1980). ANS also displays an induced CD when bound to bovine serum albumin (Anderson 1969; Daniel and Yang 1973), hemoglobin (Hsu and Woody 1971), and NAD-dependent dehydrogenases (Ivanov and Nagradova 1974; Vanek 1975). Induced CD is also observed in the near-UV CD of the pelC/ANS complex (Fig. 3 ▶). The CD spectrum of the native conformation of pelC displays a maximum at 280 nm (Fig. 3B ▶). In the complex with ANS, the maximum at 280 nm is lost, but new maxima at 260 and 340 nm appear. These features are absent in proteins such as pelC that lack extrinsic chromophores. However, ANS has absorption bands at the same wavelengths (inset to Fig. 3A ▶). Therefore, these bands arise from induced CD of ANS. ANS is a molecule that is optically inactive in solution, but on binding to a protein can give rise to CD bands. CD induced in ANS absorption bands is interesting for two reasons. ANS is thereby demonstrated to be bound to the protein in a chiral environment in such a way that its conformation is well defined. For example, the aromatic rings may be buried in a hydrophobic pocket. The induced optical activity is also interesting from a more fundamental perspective. Optically inactive probes can display optical activity when bound to a protein matrix, suggesting that the binding site favors a particular conformation of the ligand. This can potentially provide information regarding the structure of the binding site, and provide clues as to how the ligand is distorted on binding. Knowledge of the structure of bound ligands could lead to the more efficient design of synthetic ligands or inhibitors.
Fig. 3.

(A) Near-UV CD spectra of pelC (5 μM) with increasing concentration of ANS. PelC:ANS ratios are 1:1, 5, 10, 15, 25, and 40. The inset to A shows the absorption spectrum of ANS in water. (B) Near-UV CD spectra of pelC at pH 2 (dashed line) and pH 7 (solid line) without ANS. In both figures, the molar ellipticity is based on the protein concentration.
Some experiments were done to probe the nature of the interaction of ANS with pelC. Nile Red is an uncharged dye at neutral pH, is similar in structure to ANS, and has previously been used as a neutral control for the induction of structure in cytochrome c (Ali et al. 1999). The pH dependence of the fluorescence spectrum of Nile Red from pH 8 to 2 shows two regions where the fluorescence changes sharply (data not shown). Behavior such as this suggests that at pH 2, the dye is not neutral but has a charge of +2. This is consistent with the chemical structure of Nile Red, which indicates that there are two nitrogens capable of being protonated at low pH. This fact, along with the low solubility of the dye in aqueous buffer (Sackett and Wolff 1987), prevented any conclusions from being made regarding the structure-inducing ability of uncharged ANS analogs on pelC.
Matulis and Lovrien (1998) demonstrated that ion pair formation is responsible for the interaction of ANS with some proteins. NaCl is capable of inducing structure in pelC, as demonstrated by the far-UV CD spectra (Fig. 4A ▶). However, it requires about 100 mM salt, whereas only 100 μM ANS is required to achieve a comparable CD spectrum. We tested whether or not binding of ANS is enhanced as a result of combining hydrophobic interactions with electrostatic interactions. DSS is a very simple molecule containing a sulfonate group, as in ANS, and a short aliphatic chain (Fig. 5A ▶). DSS is capable of inducing structure in pelC but it requires about 8 mM. This suggests that ionic interactions play a strong role in the structure formation in pelC but also that they are not the whole driving force.
Fig. 4.

(A) Far-UV CD spectra of pelC at pH 2 in the presence of NaCl (0, 10, 30, 50, 60, 70, 80, 90, 100, 115, 130, 150 mM). The inset shows the ellipticity values at 200 nm (open circles) and 215 nm (filled triangles). (B) Near-UV CD spectra of pelC at pH 7(solid line) and pH 2 (dotted line) without NaCl, and pH 2 with 100 (dashed line) and 150 mM (dot-dashed line) NaCl.
Fig. 5.

(A) Far-UV CD spectra of pelC at pH 2 in the presence of increasing amounts of DSS (0.05, 0.1, 0.2, 0.5, 1, 2, 2.5, 3, 3.5, 4, 5, and 10 mM) (the structure is shown as an inset). The inset to A shows the ellipticity values at 200 nm (filled circles) and 215 nm (filled triangles). (B) Far-UV CD spectra of pelC (5 μM) at pH 2 with increasing amounts of 2-naphthalenesulfonate (0.05, 0.2, 0.3, 0.5, 1, 1.2, 1.5, 1.8, 2, 3, and 5 mM). The inset shows the ellipticity values at 200 nm (open circles). The structure of 2-naphthalenesulfonate is also shown as an inset. The poor signal-to-noise ratio near 220 nm is a result of absorption by the naphthalene.
The ability of 2-naphthalenesulfonate to induce structure in pelC was investigated. This molecule contains a sulfonate group but the amount of hydrophobic surface area is reduced compared with ANS. The hypothesis was that a molecule with a negative charge, but reduced hydrophobic surface area, would require higher concentrations to induce structure in pelC compared with ANS, but not so high as using NaCl alone. Induction of secondary structure appears at about 1 mM 2-naphthalenesulfonate concentration (Fig. 5B ▶). This supports the notion that a combination of hydrophobic and electrostatic interactions are responsible for the formation of structure in pelC.
Induced intermediate protein conformations are not necessarily molten globules. Molten globules lack tertiary structure, as demonstrated by the absence of significant near-UV CD. Figure 4B ▶ indicates a significant near-UV CD intensity when pelC is at pH 2 in 100 and 150 mM NaCl. If the induction of structure occurs through a similar mechanism with NaCl as it does with ANS, then we can assume that the intermediates are similar in nature. Native pelC shows a positive CD amplitude at 280 nm but the chloride-induced intermediate is negative at 280 nm. The ANS-induced structure might also have a negative CD from aromatic side chains that is not observed due to the strong CD intensity of bound ANS. The intermediate tertiary structure may or may not be native-like. It is possible that the negative CD band observed in high salt is due to aromatic side chains in a nonnative conformation. Alternatively, the aromatic side chains that are structured in the intermediate could be native-like and make a negative contribution to the overall positive near-UV CD of the native protein.
Spectral features such as those observed for pelC in the presence of ANS might be the result of intermolecular association. Sedimentation equilibrium experiments were therefore performed to assure that pelC is still monomeric under these solution conditions. The results indicated that pelC is indeed behaving as a monomer. However, the apparent relative molecular mass (Mr app), in the presence of ANS, is lower than, but within the estimated error of, the expected monomer Mr app of 37.7 kD. The data indicate that the low molecular mass is due to solution nonideality. The observed molecular mass decreases with increasing rotor speed and concentration (Table 2). For pelC at pH 2, Mr app = 38.0 ± 2.6 kD. In the presence of 100 μM ANS and at pH 2, the Mr app = 34.8 ± 7.9 kD (reported errors are 95% confidence intervals). The low Mr app results because charged protein molecules repel each other, which counters the tendency of the protein to sediment toward the outside of the cell. The result is an Mr app that is lower than expected. Although the mechanism of secondary structure induction in pelC involves neutralization of charges, the residual charge on the protein is likely to be sizeable. The data fit well to a single-species model (Fig. 6 ▶). Addition of a second virial term to the analysis yields the expected molecular mass (Table 2). The data could not be fit to a single-species model by using the dimer or tetramer molecular mass. It was also not possible to fit the data to a monomer–dimer, or monomer–tetramer equilibrium model. These observations indicate that aggregation is not likely to be a problem. To decrease or eliminate nonideality, the solution conditions are usually adjusted to have an ionic strength of about 150 mM. This was not possible in this case because addition of salts such as 50 mM NaCl to the ANS-containing solutions resulted in precipitation of the protein.
Table 2.
Apparent relative molecular mass of pelC complexed with ANS determined by analytical ultracentrifugation
| [PelC] (μM) | Rotor speed (1000 rpm) | ||
| 18 | 25 | 33 | |
| 2 | 44.2 (37.8, −2.9e-6) | 30.7 (37.6, 1.0e-5) | 25.2 (37.7, 3.6e-5) |
| 3 | 50.1 (N/D) | 30.1 (37.6, 2.2e-5) | 23.8 (37.2, 1.7e-5) |
| 5 | 49.5 (N/D) | 30.6 (37.7, 4.2e-6) | 29.3 (32.1, 2.1e-5) |
Numbers in parentheses indicate the apparent molecular mass determined using a second virial coefficient, and the coefficient used. A mass was not determined for 3 and 5 μM at 18,000 revolutions per minute using a second virial coefficient.
Fig. 6.
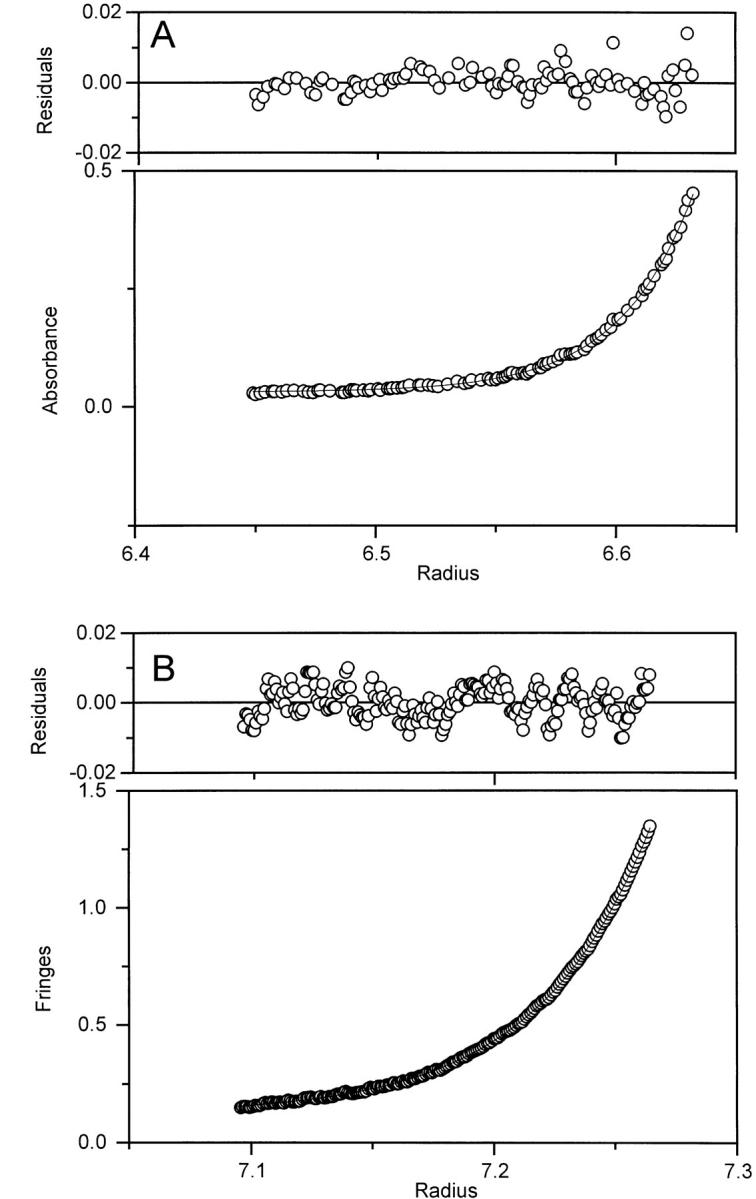
Sedimentation equilibrium data for pelC at pH 2 without ANS (A) and with 100 μM ANS (B). Both sets of data are fit to a single-species model. Absorption optics were used for samples without ANS, and interference optics were used for samples containing ANS. Symbols represent the measured signal, and the lines fit well to a single-species model. Both figures show the data collected at 25,000 rpm.
Sedimentation velocity experiments were also performed on native pelC (50 mM NaPO4, 100 mM NaCl at pH 7), pelC at pH 2 (50 mM Gly-HCl), and pelC at pH 2 in the presence of 100 μM ANS (Fig. 7 ▶). A g(s*) analysis (Stafford 1992) of the sedimentation data for native pelC indicated the presence of a single species with Mr app of ∼33 kD and s* (the apparent Svedberg coefficient) of 3.5 S. For pelC at pH 2, a single species is also observed with Mr app of ∼40 kD, and s* of 1.8 S. When ANS is present, two species are observed. One has a rather expanded conformation with Mr app of 41 kD and s* of 2.3 S. The other is somewhat more compact with Mr app of 28 kD and s* of about 6 S. The two species are assigned to (1) pelC unfolded without ANS bound and (2) pelC refolded to the intermediate with ANS bound. These data indicate direct observation of two distinct species of similar mass and different shapes. This strongly supports the idea of a conformational change in pelC on addition of ANS.
Fig. 7.
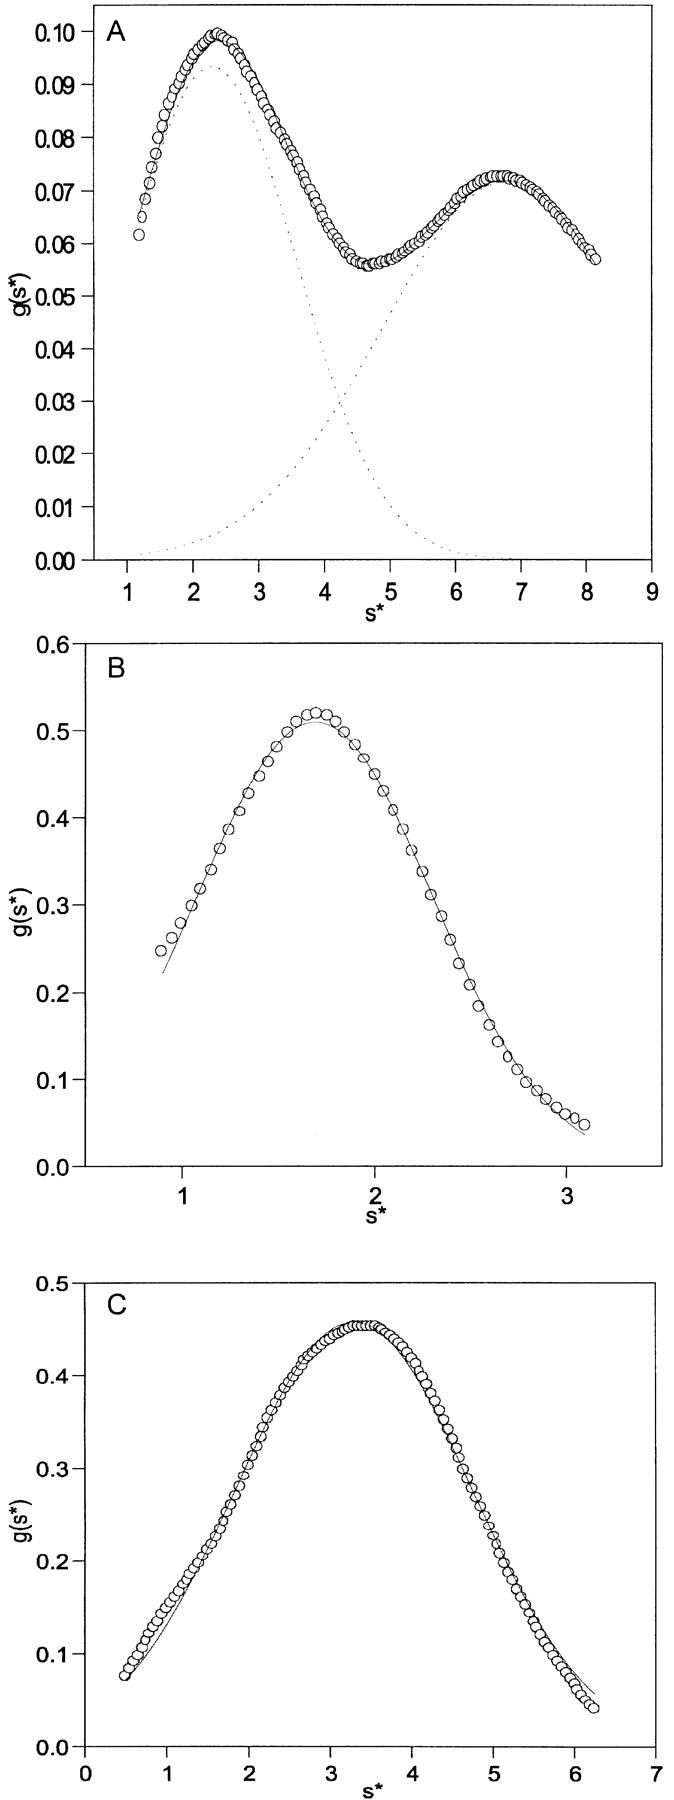
Sedimentation velocity data for pelC at pH 2 with 100 μM ANS (A). The symbols are the measured g(s*) values, the dashed lines are the Gaussian fits to each species, and the solid line is the sum of the two Gaussian peaks. (B) Data for pelC at pH 2 and (C) pH 7. The symbols and lines represent the measured g(s*) values and the Gaussian fit to a single species, respectively. All sedimentation velocity experiments were performed at 60,000 revolutions per minute.
Overall, the sedimentation data support the idea that pelC is monomeric when refolded by ANS. The observed spectral features are not the result of aggregation.
Discussion
A significant fraction of β-sheet structure is induced, along with a small increase in the fraction of α-helix, when acid-denatured pelC is complexed with ANS. Extension of the polypeptide chain in the process of acid denaturation is the result of the repulsion of excess positive charges from basic amino acid side chains. The negative sulfonate group of ANS partially neutralizes the basic groups, which results in stabilization of native-like secondary structure. The increased fluorescence emission of ANS results from the burial of this dye in the hydrophobic regions of the protein on induction of folding. The large fraction of native-like secondary structure and the apparent lack of ordered aromatic structure in the pelC-ANS complex indicate that a partially structured intermediate is stabilized in the complex. Our results indicate that this phenomenon can also occur with the addition of salt. However, it requires almost 1000-fold higher concentrations of NaCl than ANS to observe similar results. We conclude that the interaction between ANS and acid-unfolded pelC is both electrostatic and hydrophobic in nature and this accounts for the relatively high affinity of ANS for acid-unfolded pelC.
Our CD results are consistent with the findings of Ali et al. (1999), who showed that ANS binding to the acid-denatured form of oxidized cytochrome c leads to refolding of the protein. Taken together, the two studies strongly indicate that ANS is a noninnocuous probe that can significantly perturb the unfolded state of a protein, particularly if the protein has a sizeable positive charge as in the cases of cytochrome c and pelC. Thus, reports of molten globule formation detected by ANS fluorescence enhancement must be considered suspect unless corroborated by other types of evidence.
Materials and methods
Materials
PelC was prepared as previously described (Kita et al. 1996). The samples were buffered at pH 2 with 25 mM gly-HCl. ANS was purchased from Sigma and recrystallized several times from water (Weber and Young, 1964). Nile Red was purchased from Sigma. DSS was purchased from Cambridge Isotopes. 2-Naphthalenesulfonate was from ACROS Organics. Other reagents were of high quality and used without further purification.
Fluorescence spectroscopy
Fluorescence measurements were obtained on an Aviv Instruments model ATF-105 fluorometer. The excitation wavelength was 350 nm with a 2-nm bandwidth. Emission was monitored from 600–400 nm with an 8-nm bandwidth. The temperature was regulated at 25° C by a thermoelectric cell holder. The pelC concentration was 1 μM. ANS was used in 200-fold molar excess. A reference blank containing only buffer and ANS was subtracted from each spectrum.
CD spectroscopy
All CD spectra were obtained on a Jasco J-720 spectropolarimeter. A 0.02-cm pathlength cell was used to collect data in the far UV, and a 1.0-cm cell was used to collect data in the near UV. The temperature was regulated at 25° C with circulating water. PelC concentrations were 5 μM. Spectra were collected with a scan rate of 100 nm/sec, 1 nm bandwidth, and a 4-sec response time. The spectrum of a blank containing buffer and other reagents was subtracted from all spectra.
Analytical ultracentrifugation
Analytical ultracentrifugation experiments were performed on a Beckman XL-I. For sedimentation equilibrium experiments, pelC concentrations were 2, 3, and 5 μM. The ANS concentration was 100 μM. Because ANS has a strong absorbance in the same region as proteins, interference optics were used. For sedimentation velocity experiments, pelC concentrations were 1, 2.5, 5, and 7.5 μM and the ANS concentration was 100 μM. The samples were spun at a speed of 60K rpm and data were collected every 30 sec for 2 h. PelC has a partial specific volume of 0.726 cm3/g. Samples were dialyzed against buffer overnight before experiments. Data were analyzed with Origin software (Microcal Software Inc).
Acknowledgments
We thank Professor Noel Keen for providing us with starter cultures of the cloned pelC, Dr. A-Young Woody for recrystallizing the ANS, and Dr. Tom Laue for helpful discussions and suggestions regarding the sedimentation experiments. The Beckman XL-I was purchased with an NIH multi-user equipment grant (RR11847) to Colorado State University. This work was supported by USPHS grant GM 22994.
The publication costs of this article were defrayed in part by payment of page charges. This article must therefore be hereby marked "advertisement" in accordance with 18 USC section 1734 solely to indicate this fact.
Abbreviations
ANS, 8-anilino-1-naphthalenesulfonate
pelC, pectate lyase C
DSS, 2,2-dimethyl-2-silapentane-5-sulfonate
CD, circular dichroism
UV, ultraviolet
DSSP, definition of secondary structure of proteins
pI, isoelectric pH
rpm, revolutions per minute
Article and publication are at http://www.proteinscience.org/cgi/doi/10.1101/ps.19801.
From a dissertation submitted to the Academic Faculty of Colorado State University in partial fulfillment of the requirements for the degree of Doctor of Philosophy.
References
- Ali, V., Prakash, K., Kulkarni, S., Ahmad, A., Madhusudan, K.P., and Bhakuni, V. 1999. 8-Anilino-1-naphthalene sulfonic acid (ANS) induces folding of acid unfolded cytochrome c to molten globule state as a result of electrostatic interactions. Biochemistry 38 13635–13642. [DOI] [PubMed] [Google Scholar]
- Anderson, S.R. 1969. The circular dichroism spectra of the complexes of 1-anilino-8-naphthalenesulfonate with bovine serum albumin. Evidence for heterogeneity of binding. Biochemistry 8 4838–4842. [DOI] [PubMed] [Google Scholar]
- Daniel, E. and Yang, J.T. 1973. Analysis of the circular dichroism of the complexes of 8-anilino-1-naphthalenesulfonate with bovine serum albumin. Biochemistry 12 508–512. [DOI] [PubMed] [Google Scholar]
- Goto, Y. and Fink, A.L. 1989. Conformational states of β-lactamase: Molten-globule states at acidic and alkaline pH with high salt. Biochemistry 28 945–952. [DOI] [PubMed] [Google Scholar]
- Goto, Y., Calciano, L.J., and Fink, A.L. 1990a. Acid-induced folding of proteins. Proc. Natl. Acad. Sci. 87 573–577. [DOI] [PMC free article] [PubMed] [Google Scholar]
- Goto, Y., Takahashi, N., and Fink, A.L. 1990b. Mechanism of acid-induced folding of proteins. Biochemistry 29 3480–3488. [DOI] [PubMed] [Google Scholar]
- Greenfield, N. and Fasman, G.D. 1969. Computed circular dichroism spectra for the evaluation of protein conformation. Biochemistry 8 4108–4116. [DOI] [PubMed] [Google Scholar]
- Hsu, M.-C. and Woody, R.W. 1971. Optical activity of dye-apohemoglobin complexes. Biopolymers 10 1421–1425. [DOI] [PubMed] [Google Scholar]
- Ivanov, M.V. and Nagradova, N.K. 1974. Optical characteristics of the interaction of 1-anilinonaphthalene-8-sulfonate with yeast glyceraldehyde-3-phosphate dehydrogenase. Int. J. Biochem. 5 569–578. [Google Scholar]
- Johnson, W.C. 1999. Analyzing protein circular dichroism spectra for accurate secondary structures. Proteins 35 307–312. [PubMed] [Google Scholar]
- Jurnak, F., Yoder, M.D., Pickersgill, R., and Jenkins, J. 1994. Parallel β-domains: A new fold in protein structures. Curr. Opin. Struct. Biol. 4 802–806. [DOI] [PubMed] [Google Scholar]
- Kabsch, W. and Sander, C. 1983. Dictionary of protein secondary structure: pattern recognition of hydrogen-bonded and geometrical features. Biopolymers 22 2577–2637. [DOI] [PubMed] [Google Scholar]
- Kamen, D.E., Griko, Y., and Woody, R.W. 2000. The stability, structural organization, and denaturation of pectate lyase C, a parallel β-helix protein. Biochemistry 39 15932–15943. [DOI] [PubMed] [Google Scholar]
- Kita, N., Boyd, C.M., Garrett, M.R., Jurnak, F., and Keen, N.T. 1996. Differential effect of site-directed mutations in pelC on pectate lyase activity, plant tissue maceration, and elicitor activity. J. Biol. Chem. 271 26529–26535. [DOI] [PubMed] [Google Scholar]
- Matulis, D. and Lovrien, R. 1998. 1-Anilino-8-naphthalene sulfonate anion-protein binding depends primarily on ion pair formation. Biophys. J. 74 422–429. [DOI] [PMC free article] [PubMed] [Google Scholar]
- Matulis, D., Baumann, C.G., Bloomfield, V.A., and Lovrien, R.E. 1999. 1-Anilino-8-naphthalene sulfonate as a protein conformational tightening agent. Biopolymers 49 451–458. [DOI] [PubMed] [Google Scholar]
- Provencher, S.W. and Glöckner, J. 1981. Estimation of globular protein secondary structure from circular dichroism. Biochemistry 20 33–37. [DOI] [PubMed] [Google Scholar]
- Ptitsyn, O.B., Pain, R.H., Semisotnov, G.V., Zerovnik, E., and Razgulyaev, O.I. 1990. Evidence for a molten globule state as a general intermediate in protein folding. FEBS Lett. 262 20–24. [DOI] [PubMed] [Google Scholar]
- Sackett, D.L. and Wolff, J. 1987. Nile Red as a polarity-sensitive fluorescent probe of hydrophobic protein surfaces. Anal. Biochem. 167 228–234 [DOI] [PubMed] [Google Scholar]
- Sato, Y. and Woody, R.W. 1980. Circular dichroism of N-phenylnaphthylamine derivatives complexed with the β-form of poly(L-Lysine). Biopolymers 19 2021–2031. [Google Scholar]
- Semisotnov, G.V., Rodionova, N.A., Kutyshenko, V.P., Ebert, B., Blanck, J., and Ptitsyn, O.B. 1987. Sequential mechanism of refolding of carbonic anhydrase B. FEBS Lett. 224 9–13. [DOI] [PubMed] [Google Scholar]
- Semisotnov, G.V., Rodionova, N.A., Razgulyaev, O.I., Uversky, V.N., Gripas, A.F., and Gilmanshin, R.I. 1991. Study of the "Molten Globule" intermediate state in protein folding by a hydrophobic fluorescent probe. Biopolymers 31 119–128. [DOI] [PubMed] [Google Scholar]
- Sreerama, N. and Woody, R.W. 1993. A self-consistent method for the analysis of protein secondary structure from circular dichroism. Anal. Biochem. 209 32–44. [DOI] [PubMed] [Google Scholar]
- Sreerama, N. and Woody, R.W. 2000. Estimation of protein secondary structure from CD spectra: Comparison of CONTIN, SELCON and CDSSTR methods with an expanded reference set. Anal. Biochem. 287 252–260. [DOI] [PubMed] [Google Scholar]
- Stafford, W.F. 1992. Boundary analysis in sedimentation transport experiments: A procedure for obtaining sedimentation coefficient distributions using the time derivative of the concentration profile. Anal. Biochem. 203 295–301. [DOI] [PubMed] [Google Scholar]
- Stryer, L. 1965. The interaction of a naphthalene dye with apomyoglobin and apohemoglobin. A fluorescent probe of non-polar binding sites. J. Mol. Biol. 13 482–495. [DOI] [PubMed] [Google Scholar]
- Turner, D.C. and Brand, L. 1968. Quantitative estimation of protein binding site polarity. Fluorescence of N-Arylaminonaphthalenesulfonates. Biochemistry 7 3381–3390. [DOI] [PubMed] [Google Scholar]
- Vanek, C.F. 1975. Circular dichroism of ANS and TNS complexes with horse liver and yeast alcohol dehydrogenases. M.S. thesis, Arizona State University, Tempe.
- Weber, G. and Young, L.B. 1964. Fragmentation of bovine serum albumin by pepsin. J. Biol. Chem. 239 1415–1423. [PubMed] [Google Scholar]
- Yoder, M.D. and Jurnak, F. 1995. Protein ms. 3. The parallel β helix and other coiled folds. FASEB J. 9 335–342. [DOI] [PubMed] [Google Scholar]